SIMULATION AND THE MONTE CARLO METHOD Episode 6 doc
Bạn đang xem bản rút gọn của tài liệu. Xem và tải ngay bản đầy đủ của tài liệu tại đây (1.35 MB, 30 trang )
130
CONTROLLING THE
VARIANCE
Suppose that
X
can be generated via the composition method. Thus, we assume that there
exists a random variable
Y
taking values in
{
1,
. .
.
,
m},
say, with known probabilities
{p,,
i
=
1,
.
.
. ,
m},
and we assume that it is easy to sample from the conditional distri-
bution of
X
given
Y.
The events
{Y
=
i}, i
=
1,.
. . ,
m
form disjoint subregions, or
strata
(singular: stratum), of the sample space
0,
hence the name
stratification.
Using the
conditioning formula (1.1
l),
we can write
m
e
=
E[E[H(X)
I
Y]]
=
Cpz
E[H(X)
I
Y
=
i]
.
(5.33)
1.=
1
This representation suggests that we can estimate
l
via the following
stratijed sampling
estimator:
m
N,
e^.
=
CP1
N,
CH(Xl,)
1
(5.34)
where
X,,
is the j-th observation from the conditional distribution
of
X
given
Y
=
i.
Here
N,
is
the sample size assigned to the i-th stratum. The variance
of
the stratified sampling
estimator
is
given by
1=
1
3=1
(5.35)
where
uz
=
Var(H(X)
I
Y
=
i).
How the strata should be chosen depends very much on the problem at hand. However,
for a given particular choice of the strata, the sample sizes
{
N,}
can be obtained in an
optimal manner, as given in the next theorem.
Theorem
5.5.1
(Stratified Sampling)
Assuming that
a
maximum number
of
N
samples
can be collected, that is,
El”=,
N,
=
N,
the optimal value
of
N,
is given by
which gives
a
minimal variance
of
(5.36)
(5.37)
Proof:
The theorem is straightforwardly proved using Lagrange multipliers and is left as
an exercise
to
the reader; see Problem 5.9.
0
Theorem
5.5.1
asserts that the minimal variance of
e^.
is attained for sample sizes
Ni
that
are proportional to
pi
ui.
A
difficulty is that although the probabilities
pi
are assumed to be
known, the standard deviations
{ai}
are usually unknown. In practice, one would estimate
the
{
ui}
from “pilot” runs and then proceed to estimate the optimal sample sizes,
Nt
,
from
(5.36).
A
simple stratification procedure, which can achieve variance reduction without requiring
prior knowledge of
u:
and H(X), is presented next.
IMPORTANCE
SAMPLING
131
Proposition
5.5.1
Let the sample sizes
N,
beproportional to
p,,
that is,
N,
=
p,
N,
i
=
1,.
.
.
m.
Then
var(e^s)
6
Er(lj
.
Proof
Substituting
N,
=
p,
N
in
(5.35)
yields Var(e^.)
=
&
zz,
p,
0:.
The result now
follows from
m
NVar(P^)
=
Var(H(X))
2
E[Var(H(X)
1
Y)]
=
xpla:
=
NVar(e^s),
r=l
where we have used
(5.21)
in the inequality.
0
Proposition 5.5.1 states that the estimator
is more accurate than the CMC estimator
It effects stratification by favoring those events
{Y
=
i}
whose probabilities
p,
are largest.
Intuitively, this cannot, in general, be an optimal assignment, since information on
a:
and
H(X) is ignored.
In the special case of equal weights
(p,
=
l/m
and
N,
=
N/m),
the estimator
(5.34)
reduces to
(5.38)
and the method is known as the
systematic sampling method
(see, for example, Cochran
[61).
5.6
IMPORTANCE SAMPLING
The most fundamental variance reduction technique is
importancesampling.
As
we shall
see
below, importance sampling quite often leads to a dramatic variance reduction (sometimes
on the order
of
millions, in particular when estimating rare event probabilities), while with
all
of
the above variance reduction techniques only a moderate reduction, typically up to
10-fold, can be achieved. Importance sampling involves choosing a sampling distribution
that favors important samples. Let, as before,
where
H
is the sample performance and
f
is the probability density of
X.
For
reasons that
will become clear shortly, we add a subscript
f
to the expectation to indicate that it is taken
with respect to the density
f.
Let
g
be another probability density such that
H
f
is
dominated
by
g.
That is,
g(x)
=
0
+
H(x)
f(x)
=
0.
Using the density
g
we can represent
e
as
(5.40)
where the subscript
g
means that the expectation is taken with respect to
g.
Such a density
is called the
importance sampling
density,
proposal
density, or
instrumental
density (as we
use
g
as an instrument
to
obtain information about
l).
Consequently, if
XI,
. .
.
,
XN
is a
random sample
from
g,
that is, XI,
. . . ,
XN
are iid random vectors with density
g,
then
(5.41)
132
CONTROLLING THE VARIANCE
is an unbiased estimator of
e.
This estimator is called the
importance sampling estimator.
The ratio of densities,
(5.42)
is called the
likelihood ratio.
For this reason the importance sampling estimator
is
also
called the
likelihood ratio estimator.
In the particular case where there is no change of
measure, that is,
g
=
f,
we have
W
=
1,
and the likelihood ratio estimator in
(5.41)
reduces to the usual CMC estimator.
5.6.1
Weighted Samples
The likelihood ratios need only be known
up
to
a constanf,
that is,
W(X)
=
cw(X)
for
some known function
w(.).
Since IE,[W(X)]
=
1,
we can write
f2
=
IEg[H(X) W(X)] as
This suggests, as an alternative
to
the standard likelihood ratio estimator
(5.42),
the follow-
ing
weighted sample estimator:
(5.43)
Here the
{wk},
with
'uik
=
w(&),
are interpreted as
weights
of the random sample
{Xk},
and the sequence
{(xk,Wk)}
is
called a
weighted (random) sample
from
g(x).
Similar to the regenerative ratio estimator in Chapter
4,
the weighted sample estimator
(5.43)
introduces some bias, which tends
to
0
as
N
increases. Loosely speaking, we
may view the weighted sample
{
(&,
Wk)}
as a representation of
f(x)
in the sense that
e
=
IE,[H(X)I
=:
e2,
for any function
H(.).
5.6.2
The Variance Minimization Method
Since the choice of the importance sampling density
g
is
crucially linked to the variance
of
the estimator Fin
(5.41),
we consider next the problem of minimizing the variance of
with respect to
g,
that is,
minVarg (H(x)
g(x,>
f
(XI
.
9
(5.44)
It is not difficult to prove (see, for example, Rubinstein and Melamed
[3
11
and Problem
5.13)
that the solution of the problem
(5.44)
is
In particular, if
H(x)
0
-
which we will assume from now on
-
then
(5.45)
(5.46)
and
Var,.
(F)
=
varg-
(H(x)w(x))
=
Var,.
(e)
=
o
.
The density
g*
as per
(5.45)
and
(5.46)
is called the
optimal importance sampling density.
IMPORTANCE
SAMPLING
133
EXAMPLE58
Let
X
-
Exp(u-')
and
H(X)
=
I{x27)
for some
y
>
0.
Let
f
denote the pdf of
X.
Consider the estimation of
We have
Thus, the optimal importance sampling distribution of
X
is the
shfted
exponential
distribution. Note that
H
f
is dominated by
g'
but
f
itself is not dominated by
g*.
Since
g*
is optimal, the likelihood ratio estimator zis constant. Namely, with
N
=
1,
It is important to realize that, although
(5.41)
is an unbiased estimator for
any
g
dominating
H
f,
not all such pdfs are appropriate. One of the main rules for choosing a
good importance sampling pdf is that the estimator
(5.41)
should have finite variance. This
is equivalent to the requirement that
(5.47)
This suggests that
g
should not have a "lighter tail" than
f
and that, preferably, the likelihood
ratio,
f
/g.
should be bounded.
In general, implementation of the optimal importance sampling density
g*
as per
(5.45)
and
(5.46)
is problematic. The main difficulty lies in the fact that to derive
g*(x)
one needs
to know
e.
But
e
is precisely the quantity we want to estimate from the simulation!
In most simulation studies the situation is even worse, since the analytical expression
for the sample performance
H
is unknown in advance.
To
overcome this difficulty, one
can perform a pilot run with the underlying model, obtain a sample
H(X1),
.
.
. ,
H(XN),
and then use it to estimate
g*.
It is important to note that sampling from such an artificially
constructed density may be a very complicated and time-consuming task, especially when
g
is a high-dimensional density.
Remark5.6.1 (Degeneracy
of
the Likelihood Ratio Estimator)
The likelihood ratio
es-
timator
C
in
(5.41)
suffers from a form of degeneracy in the sense that the distribution of
W(X)
under the importance sampling density
g
may become increasingly skewed as the
dimensionality
n
of
X
increases. That is,
W(X)
may take values close to
0
with high
probability, but may also take very large values with a small but significant probability.
As
a consequence, the variance of
W(X)
under
g
may become very large for large
n.
As
an
example of this degeneracy, assume for simplicity that the components in
X
are iid, under
both
f
and
g.
Hence, both
f
(x)
and
g(x)
are the products of their marginal pdfs. Suppose
the marginal pdfs of each component
Xi
are
fl
and
91,
respectively. We can then write
W(X)
as
(5.48)
134
CONTROLLING
THE
VARIANCE
Using the law of large numbers, the random variable
c:=,
In
(fl(Xi)/gl(Xi))
is approx-
imately equal to
n
E,,
[In
(fi
(X)/gl
(X))]
for large
n.
Hence,
(5.49)
Since
E,,
[ln(gl(X)/fl(X))]
is nonnegative (see page 31), the likelihood ratio
W(X)
tends to
0
as
n
+
00.
However, by definition, the expectation of
W(X)
under
g
is always
1.
This indicates that the distribution of
W(X)
becomes increasingly skewed when
n
gets
large. Several methods have been introduced to prevent this degeneracy. Examples are
the heuristics of Doucet et al.
[8],
Liu [23], and Robert and Casella [26] and the so-called
screening method. The last will be presented in Sections
5.9
and 8.2.2 and can be considered
as a dimension-reduction technique.
When the pdf
f
belongs to some parametric family of distributions, it is often convenient
to
choose the importance sampling distribution from the
same
family. In particular, suppose
that
f(.)
=
f(.;
u)
belongs to the family
9
=
{f(.;v),
v
E
Y}
.
Then the problem of finding an optimal importance sampling density in this class reduces
to the following
parametric
minimization problem:
min Var,
(H(X)
W(X;
u,
v))
,
(5.50)
where
W(X;
u,
v)
=
f(X; u)/f(X;
v).
We will call the vectorv the
referenceparameter
vector
or
tilting vector.
Since under
f(.;
v)
the expectation
C
=
Ev[H(X) W(X;
u,
v)] is
constant, the optimal solution of
(5.50)
coincides with that of
VEY
minV(v)
,
VEY
(5.51)
where
V(v)
=
Ev[H2(X) W2(X;
u,
v)]
=
E"[H2(X) W(X;
u,
v)]
.
(5.52)
We shall call either
of
the equivalent problems
(5.50)
and
(5.5
1)
the
variance minimization
(VM) problem, and we shall call the parameter vector
.v
that minimizes programs
(5.50)
-
(5.5
1)
the
optimal VMreferenceparameter vector.
We refer to
u
as the
nominal
parameter.
The sample average version
of
(5.51)
-
(5.52) is
where
(5.53)
(5.54)
and the sample
XI,
. .
.
,
XN
is from
f(x;
u).
Note that as soon as the sample
X1,.
. .
,
XN
is available, the function
v(v)
becomes a deterministic one.
Since in typical applications both functions V(v) and 6(v) are convex and differentiable
with respect to
v,
and since one can typically interchange the expectation and differentiation
operators (see Rubinstein and Shapiro [32]), the solutions of programs
(5.51)
-
(5.52) and
IMPORTANCE SAMPLING
135
(5.53)
-
(5.54)
can be obtained by solving (with respect to
v)
the following system of
equations:
IE"[P(X) VW(X;
u,
v)]
=
0
(5.55)
(5.56)
respectively, where
f
(X.
u)
f
(X;
v)
VW(X;
u,
v)
=
V-
=
[V
Inf(X;
v)]
W(X;
u,
v)
,
the gradient is with respect to
v
and the function V In
f
(x;
v)
is the score function, see
(1.64).
Note that the system of nonlinear equations (5.56)is typically solved using numerical
methods.
EXAMPLES9
Consider estimating
e
=
IE[X],
where
X
N
Exp(u-').
Choosing
f(z;v)
=
v-'
exp(z,u-'),
z
2
0
as the importance sampling pdf, the program
(5.51)
reduces
The optimal reference parameter
*v
is
given by
*v
=
221.
We see that
.IJ
is exactly two times larger than
u.
Solving the sample average version
(5.56)
(numerically), one should find that, for large
N,
its optimal solution
.z
will be
close to the true parameter
*v.
EXAMPLE
5.10
Example
5.8
(Continued)
Consider again estimating
e
=
PU(X
2
y)
=
exp(-yu-').
In this case, using the
family
{
f
(z;
v),
v
>
0)
defined by
f
(2;
v)
=
vP1
exp(zv-l),
z
2
0,
the program
(5.51)
reduces to
The optimal reference parameter
.w
is given by
1
2
*?I
=
-
{y
+
'u
+
&G2}
=
y
+
;
+
O((u/y)2)
,
where O(z2) is a function of
z
such that
lim
(30
=
constant
2-0
52
We see that for
y
>>
u,
.v
is
approximately equal to
y.
136
CONTROLLING THE VARIANCE
It is important
to
note that in this case the sample version
(5.56)
(or
(5.53)
-
(5.54))
is meaningful only for small
y,
in particular for those
y
for which
C
is not
a
rare-event
probability, say where
C
<
For very small
C,
a tremendously large sample
N
is
needed (because of the indicator function
I{
x)y}).
and thus the importance sampling
estimator Fis useless. We shall discuss the estimation of rare-event probabilities in
more detail in Chapter
8.
Observe that the VM problem
(5.5
1)
can also be written as
min
V(V)
=
min
E,
[H’(x)
W(X;
u, v)
W(X;
u,
w)]
,
(5.57)
VEY
VEY
where
w
is an arbitrary reference parameter. Note that
(5.57)
is obtained from
(5.52)
by
multiplying and dividing the integrand by
f(x;
w).
We now replace the expected value in
(5.57)
by its sample (stochastic) counterpart and then take the optimal solution of the asso-
ciated Monte Carlo program as an estimator of
*v.
Specifically, the stochastic counterpart
of
(5.57)
is
N
1
min
?(v)
=
min
-
H’(X,) W(Xk
;
u,v)
W(Xk
;
u,
w)
,
(5.58)
where
XI,
.
.
.
,
XN
is
an iid sample from
f(
.;
w)
and
w
is an appropriately chosen trial
parameter. Solving the stochastic program
(5.58)
thus yields an estimate, say
3,
of
*v.
In some cases it may be useful to iterate this procedure, that is, use as a trial vector in
(5.58),
to obtain a better estimate.
Once the reference parameter
v
=
3
is determined,
C
is estimated via the likelihood
ratio estimator
VEY
“EY
N
,=I
(5.59)
where
XI,
. .
.
,
XN
is a random sample from
f(.;
v).
Typically, the sample size
N
in
(5.59)
is larger than that used for estimating the reference parameter. We call
(5.59)
the standard
likelihood ratio (SLR) estimator.
5.6.3
The Cross-Entropy
Method
An alternative approach for choosing an “optimal” reference parameter vector in
(5.59)
is
based on the Kullback-Leibler cross-entropy,
or
simply crass-entropy (CE), mentioned in
(1
S9).
For clarity we repeat that the CE distance between two pdfs
g
and
h
is given (in the
continuous case) by
Recall that
ID(g,
h)
2
0,
with equality if and only if
g
=
h.
The general idea
is
to choose the importance sampling density, say
h,
such that the CE
distance between the optimal importance sampling density
g*
in
(5.45)
and
h
is minimal.
We call this the
CE
optirnalpdf: Thus, this pdf solves the followingfunctional optimization
program:
min
ID
(g’,
h)
.
I1
IMPORTANCE SAMPLING
137
If we optimize over all densities
h,
then it is immediate from
’D(g*,
h)
2
0
that
the
CE
optimal pdf coincides
with
the VM optimal pdf
g*.
As with the VM approach
in
(5.50)and
(5.5
I),
we shall restrict ourselves to the parametric
family of densities
{
f(.;
v), v
E
Y}
that contains the “nominal” density
f(.;
u).
The CE
method now aims to solve the
parametric
optimization problem
min
’D
(g*,
f(.;
v))
.
V
Since the first term on the right-hand side of (5.60) does not depend on
v,
minimizing the
Kullback-Leibler distance between
g’
and
f(.;
v)
is equivalent to
maximizing
with respect
to
v,
1
H(x)
f(x;
u)
In
f(x;
v)
dx
=
EU
[ff(X)
In
f(x;
v)l,
where we have assumed that
H(x)
is nonnegative. Arguing as in
(5.5
I),
we find that the CE
optimal reference parameter vector
v*
can be obtained from the solution of the following
simple program:
max
D(v)
=
max
IE,
[H(X)
In
f(X;
v)]
.
(5.61)
Since typically
D(v)
is convex and differentiable with respect to
v
(see Rubinstein and
V
V
Shapiro [32]), the solution to (5.61) may be obtained by solving
E,
[H(X)
V
In
f(X;
v)]
=
0
,
(5.62)
provided that the expectation and differentiation operators can be interchanged. The sample
counterpart of (5.62) is
.N
(5.63)
By analogy
to
the VM program
(5.51),
we call (5.61) the
CE
program,
and we call the
parameter vector
v*
that minimizes the program (5.64) the
optimal
CE
referenceparameter
vector.
Arguing as
in
(5.57),
it is readily seen that (5.61) is equivalent to the following program:
max
D(v)
=
max
E,
[H(X) W(X;
u,
w)
In
f(X;
v)]
,
(5.64)
where
W(X;
u,
w)
is again the likelihood ratio and
w
is an
arbitrary
tilting parameter.
Similar to
(5.58),
we can estimate
v*
as the solution of the stochastic program
V
N
1
vN
max
~(v)
=
max
-
C
H(x~)
w(x~;
u,
w)
In
f(&;
v)
,
(5.65)
where
XI,.
.
.
,
XN
is a random sample from
I(.;
w).
As in the VM case, we mention the
possibility of
iterating
this procedure, that is, using the solution of (5.65) as a trial parameter
for the next iteration.
Since
in
typical applications the function
5
in
(5.65)
is convex and differentiable with
respect to
v
(see
[32]),
the solution of (5.65) may be obtained by solving (with respect to
v)
the following system of equations:
k=l
(5.66)
138
CONTROLLING THE VARIANCE
where the gradient is with respect to
v.
Our extensive numerical studies show that for moderate dimensions
n,
say
n
5
50,
the
optimal solutions of the CE programs (5.64)and (5.65) (or (5.66)) and their VM counterparts
(5.57)
and (5.58) are typically nearly the same. However, for high-dimensional problems
(n
>
50),
we found numerically that the importance sampling estimator gin (5.59) based
on VM updating of
v
outperforms its CE counterpart in both variance and bias. The latter
is
caused by the degeneracy of
W,
to which, we found, CE is more sensitive.
The advantage of the CE program is that it can often be solved
analytically.
In particular,
this happens when the distribution of
X
belongs to an
exponentialfamily
of distributions; see
Section A.3 of the Appendix. Specifically (see
(A.
16)). for a one-dimensional exponential
family parameterized by the mean, the CE optimal parameter is
always
and the corresponding sample-based updating formula is
(5.67)
(5.68)
respectively, where
XI,.
.
.
,
XN
is a random sample from the density
f(.;
w)
and
w
is
an
arbitrary parameter. The multidimensional version of (5.68) is
(5.69)
for
i
=
1,
.
. .
,
n,
where
Xkt
is the i-th component of vector
Xk
and
u
and
w
are parameter
vectors.
Observe that for
u
=
w
(no likelihood ratio term
W),
(5.69) reduces to
(5.70)
where
Xk
N
f(x;
u).
Observe also that because of the degeneracy of
W,
one would always prefer the estimator
(5.70)
to (5.69), especially for high-dimensional problems. But as we shall see below, this
is not always feasible, particularly when estimating rare-event probabilities in Chapter
8.
EXAMPLE 5.11
Example
5.9
continued
Consider again the estimation of
l
=
E[X],
where
X
N
Exp(u-l)
and
f(z;
v)
=
v-'
exp(zv-'),
z
2
0.
Solving (5.62). we find that the optimal reference parameter
v*
is equal to
Thus,
v*
is exactly the same as
*v.
For the sample average of (5.62), we should find
that for large
N
its optimal solution
8'
is close to the optimal parameter
v*
=
2u.
IMPORTANCE SAMPLING
139
I
EXAMPLE
5.12
Example
5.10
(Continued)
Consider again the estimation of
C
=
Bu(X
>
y)
=
exp(-yv ').
In this case, we
readily find from
(5.67)
that the optimal reference parameter is
w*
=
y
+
u.
Note that
similar
to
the
VM
case, for
y
>>
u,
the optimal reference parameter is approximately
7.
Note that in the above example, similar to the
VM
problem, the CE sample version
(5.66)
is meaningful only when
y
is chosen such that
C
is
not
a
rare-eventprobability,
say
when
l
<
In Chapter
8
we present
a
general procedure for estimating rare-event
probabilities of the form
C
=
B,(S(X)
2
y)
for an arbitrary function
S(x)
and level
y.
EXAMPLE
5.13
Finite Support Discrete Distributions
Let
X
be a discrete random variable with finite support, that is,
X
can only take a
finite number of values, say
al,.
.
.
Let
ui
=
B(X
=
ai),i
=
1,.
. .
,
m
and
define
u
=
(u1,
. .
.
,
urn).
The distribution of
X
is thus trivially parameterized by
the vector
u.
We can write the density of
X
as
m
From the discussion at the beginning of this section we know that the optimal
CE
and
VM
parameters
coincide,
since we optimize over
all
densities on
{
a1
,
.
. .
,
am}.
By
(5.45)
the
VM
(and CE) optimal density is given by
so
that
for any reference parameter
w,
provided that
Ew[H(X) W(X;
u,
w)]
>
0.
The vector
V*
can be estimated from the stochastic counterpart of
(5.71),
that is,
as
where
XI,
. .
.
,
XN
is an iid sample from the density
f(.;
w).
A similar result holds for a random vector
X
=
(XI,
.
.
.
,
X,)
where
XI,
. . .
,
X,
are independent discrete random variables with finite support, characterized by
140
CONTROLLING THE VARIANCE
the parameter vectors
ul,
.
. .
,
u,.
Because of the independence assumption, the
CE problem
(5.64)
separates into
n
subproblems of the form above, and all the
components of the optimal
CE
reference parameter
v*
=
(v;,
.
.
.
,
v;),
which is
now a vector of vectors, follow from
(5.72).
Note that in this case the optimal
VM
and
CE
reference parameters are usually not equal, since we are not optimizing the
CE over all densities. See, however, Proposition
4.2
in Rubinstein and Kroese
[29]
for an important case where they
do
coincide and yield a zero-variance likelihood
ratio estimator.
The updating rule
(5.72),
which involves discrete finite support distributions, and in
particular the Bernoulli distribution, will be extensively used for combinatorial optimization
problems later on in the book.
EXAMPLE
5.14
Example
5.1
(Continued)
Consider the bridge network in Figure
5.1,
and let
S(X)
=
min(Xl+
X4,
XI
+
X3
+
X5, Xz
+
X3
+
X4,
XZ
+
X5).
Suppose we wish to estimate the probability that the shortest path from node
A
to
node
B
has a length of at least
y;
that is, with
H(x)
=
I{s(x)2r},
we want to estimate
e
=
WWI
=
PU(S(X)
2
7)
=
L[I{S(X)>y}I
'
We assume that the components
{X,}
are independent, that
Xi
-
Exp(u;l),
i
=
1,
.
.
.
,5,
and that
y
is chosen such that
C
2
lo-'.
Thus, here the
CE
updating formula
(5.69)
and its particular case
(5.70)
(with
w
=
u)
applies. We shall show that this
yields substantial variance reduction. The likelihood ratio in this case
is
As
a concrete example, let the
nominal
parameter vector
u
be
equal to
(1,1,0.3,
0.2,O.l) and let
y
=
1.5. We will see that this probability
C
is approximately
0.06.
Note that the typical length of a path from
A
to
B
is smaller than
y
=
1.5;
hence, using importance sampling instead of
CMC
should be beneficial. The idea
is to estimate the optimal parameter vector
v*
without
using likelihood ratios, that
is, using
(5.70),
since likelihood ratios, as in
(5.69)
(with quite arbitrary
w,
say by
guessing an initial trial vector
w),
would typically make the estimator of
v*
unstable,
especially for high-dimensional problems.
Denote by
G1
the
CE
estimator of
v*
obtained from
(5.70).
We can iterate (repeat)
this procedure, say for
T
iterations, using
(5.69),
and starting with
w
=
Gg,.
.
Once the final reference vector
V^T
is obtained, we then estimate
C
via a
larger
sample
from
f(x;G~),
say of size
N1,
using the SLR estimator
(5.59).
Note, however,
that for high-dimensional problems, iterating in this way could lead to an unstable
final estimator
GT.
In short, a single iteration with
(5.70)
might often be the best
alternative.
SEQUENTIAL IMPORTANCE
SAMPLING
141
0
1
2
3
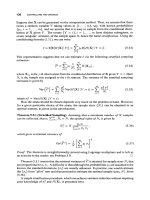
Table 5.1 presents the performance of the estimator
(5.59),
starting from
w
=
u
=
(1,1,0.3,0.2,0.1)
and then iterating
(5.69)
three times. Note again that in the first
iteration we generate a sample
X1,.
. .
XN
from
f(x;
u)
and then apply
(5.70)
to
obtain an estimate
v^
=
(51,
. .
.
,55)
of the CE optimal reference parameter vector
v*
.
The sample sizes for updating
v^
and calculating the estimator
l
were
N
=
lo3
and
N1
=
lo5,
respectively. In the table RE denotes the estimated relative error.
1
1
0.3 0.2
0.1
0.0643 0.0121
2.4450 2.3274 0.2462
0.2113 0.1030
0.0631 0.0082
2.3850 2.3894 0.3136
0.2349
0.1034 0.0644
0.0079
2.3559 2.3902
0.3472
0.2322
0.1047
0.0646 0.0080
Table
5.1
Iterating the five-dimensional vector
0.
iteration
I
V
IF
RE
Note that
v^
already converged after the first step,
so
using likelihood ratios in
Steps
2
and
3
did not add anything to the quality of
v^.
It also follows from the
results of Table
5.1
that CE outperforms CMC (compare the relative errors
0.008
and
0.0121
for CE and CMC, respectively).
To
obtain a similar relative error of
0.008
with CMC would require a sample size of approximately
2.5.
lo5
instead of
lo5;
we
thus obtained a reduction by a factor of
2.5
when using the CE estimation procedure.
As
we shall see in Chapter
8
for smaller probabilities, a variance reduction of several
orders of magnitude can be achieved.
5.7
SEQUENTIAL IMPORTANCE SAMPLING
Sequential importance sampling (SIS), also called
dynamic importancesampling,
is simply
importance sampling carried out in a sequential manner. To explain the SIS procedure,
consider the expected performance
l
in
(5.39)
and its likelihood ratio estimator Fin
(5.41).
with
f(x)
the “target” and
g(x)
the importance sampling, or proposal, pdf. Suppose that
(a)
X
is decomposable, that is, it can be written as a vector
X
=
(XI,
.
.
.
,
Xn),
where each
of the
Xi
may be multi-dimensional, and (b) it is easy to sample from
g(x)
sequentially.
Specifically, suppose that
g(x)
is of the form
(5.74)
where it is easy to generate
X1
from density
gl(q),
and conditional on
X1
=
21,
the
second component from density
92(52121).
and
so
on, until one obtains a single random
vector
X
from
g(x).
Repeating this independently
N
times, each time sampling from
g(x),
one obtains a random sample
XI,.
.
.
,
XN
from
g(x)
and estimates
C
according to
(5.41).
To
further simplify the notation, we abbreviate
(21,.
. .
zt)
to
x1:t
for all
t.
In particular,
~1:~
=
x.
Typically,
t
can be viewed as a (discrete) time parameter and
~1:~
as a path or
trajectory. By the product rule of probability
(1.4),
the target pdf
J(x)
can also be written
sequentially, that is,
g(x)
=
g1(21)
g2(22
1x1)
’‘
’
gn(2n Izlr
.
zn-1)
7
f(x)
=
f(21)
f(z2
151)’
‘
f(zn
1
X1:n-1).
(5.75)
142
CONTROLLING THE VARIANCE
From (5.74) and (5.75)
it
follows that we can write the likelihood ratio in product form
as
(5.76)
f(~l)f(~ Ixl)"'f(xn Ix1:n-l)
g1(21)g2(22 I~l) gn(xn Ix1:n-l)
W(x)
=
or,
if
WL(xl:t)
denotes the likelihood ratio up to time
t,
recursively as
Wt(X1:t)
=
Ut
Wt-l(Xl:t-l),
t
=
1,.
.
.1
n
7
(5.77)
with initial weight
Wo(x1:o)
=
1
and
incremental weights
u1
=
f(z1)/g1(xi)
and
,
t
=
2
, ,
n.
(5.78)
In order to update the likelihood ratio recursively, as
in
(5.78), one needs to known the
marginal pdfs
f(x~:~).
This may not be easy when
f
does not have a Markov structure, as
it
requires integrating
f(x)
over all
z~+~,
. . .
,
2,.
Instead one can introduce a sequence of
auxiliary
pdfs
fl,
f2, .
. .
,
fn
that are easily evaluated and such that each
ft(xl:t)
is a good
approximation to
f(xpt).
The terminating pdf
fn
must be equal to the original
f.
Since
f(.t
I
at-1)
-
-
f
(X1:t)
f(xl:t-l)gt(xt
I
X1:t-1)
ut
=
gt(ZL
I
X1:t-1)
we have as a generalization of (5.78) the incremental updating weight
(5.79)
(5.80)
fort
=
1,.
.
.
,
n,
where we put
fo(x1:o)
=
1.
Remark
5.7.1
Note that the incremental weights
ut
only need to be defined
up
to
uconstunt,
say
ct,
for each
t.
In this case the likelihood ratio
W(x)
is known up to a constant as well, say
W(x)
=
Cw(x),
where
1/C
=
E,[w(X)]
can be estimated via the corresponding sample
mean. In other words, when the normalization constant is unknown, one can still estimate
e
using the weighted sample estimator (5.43) rather than the likelihood ratio estimator
(5.42).
Summarizing, the
SIS
method can be written as follows.
Algorithm
5.7.1
(SIS
Algorithm)
I.
For eachjnite
t
=
1,.
. .
,
n,
sample
Xt
from
gt(Zt
1
xpt-1).
2.
Compute
wt
=
ut
wL-l,
where
wo
=
1
and
t=
l, ,n.
(5.81)
ft(X1:t)
Ut
=
ft-l(XI:t-l)gt(Xt
IX1:t-1)'
3.
Repeat
N
times and estimate
e
via
;in
(5.42)
or
xu
in
(5.43).
SEQUENTIAL
IMPORTANCE
SAMPLING
143
EXAMPLE
5.15
Random Walk on
the
Integers
Consider the random walk on the integers of Example 1.10 on page 19, with prob-
abilities
p
and
q
for jumping up or down, respectively. Suppose that
p
<
q,
so
that
the walk has a drift toward
-m.
Our goal is to estimate the rare-event probability
C
of reaching state
K
before state
0,
starting from state
0
<
k
<<
K,
where
K
is a
large number.
As
an intermediate step consider first the probability of reaching
K
in
exactly
n
steps, that is,
P(X,
=
K)
=
IE[IA,,],
where
A,
=
{X,
=
K}.
We have
f(X1:n)
=
f(s1
I
k)
f(x2
1x1)
f(53
1x2).
' '
f(zn
I
%-l)
7
where the conditional probabilities are either
p
(for upward jumps) or
q
(for down-
ward jumps). If we simulate the random walk with
different
upward and downward
probabilities,
6
and
ij,
then the importance sampling pdf
g(x1:,)
has the same form as
f(xl:,)
above. Thus, the importance weight after Step
t
is
updated via the incremental
weight
The probability
P(A,)
can now be estimated via importance sampling as
.N
(5.82)
2=1
where the paths
i
=
1,.
. .
,
N
are generated via
g.
rather than
f
and
Wi,,
is
the likelihood ratio
of
the i-th such path. Returning to the estimation
of
e,
let
7
be the
first time that either
0
or
K
is reached. Writing
I{xt=~)
=
H(Xl,t),
we have
00
e
=
IE~[I{~,=~}]
=
IE~[H(x~:,)I
=
CE[H(X~:,)
I{T=n}]
n=l
00
n=l
x
with
W,
the likelihood ratio of
XI:,,
which can be updated at each time
t
by multi-
plying with either
p/p
or
q/ij
for upward and downward steps, respectively. Note that
is indeed a function of
x,
=
(21,
. . .
,
x,).
This leads to the same estimator as
(5.82) with the deterministic
n
replaced by the stochastic
7.
It can be shown (see, for
example, [5]) that choosing
6
=
q
and
ij
=
p,
that is,
interchanging
the probabilities,
gives an efficient estimator fore.
144
CONTROLLING
THEVARIANCE
5.7.1
Nonlinear Filtering
for
Hidden Markov Models
This section describes an application of
SIS
to nonlinear filtering. Many problems in
engineering, applied sciences, statistics, and econometrics can be formulated as
hidden
Markov models
(HMM). In its simplest form, an HMM is a stochastic process
{
(Xt,
Y,)}
where
Xt
(which may be multidimensional) represents the
true
state of some system and
Yt
represents the
observed
state of the system at a discrete time
t.
It is usually assumed
that
{X,}
is a Markov chain, say with initial distribution
f(z0)
and one-step transition
probabilities
J(xt
I
It is important to note that the actual state of the Markov chain
remains
hidden,
hence the name HMM. All information about the system is conveyed by
the process
{Y,}.
We assume that, given
XO,
. . .
,
Xt,
the observation
Yt
depends only
on
Xt
via some conditional pdf
f(yt
I
x,).
Note that we have used here a Bayesian style
of notation in which all (conditional) probability densities are represented by the
same
symbol
f.
We will use this notation throughout the rest of this section. We denote by
XI:,
=
(XI,.
. .
,
Xt)
and
Ylrt
=
(Y1,
. .
.
,
yt)
the unobservable and observable sequences
up to time
t,
respectively
-
and similarly for their lowercase equivalents.
The HMM is represented graphically in Figure
5.2.
This is an example of a
Bayesian
network.
The idea
is
that edges indicate the dependence structure between two variables. For
example, given the states
XI,
.
.
.
,
Xt,
the random variable
Yt
is conditionally independent
of
XI,
. . .
,
Xt-l,
because there
is
no direct edge from
Yt
to any of these variables. We thus
have
J(yt
I
XIxt)
=
f(yt
I
xt),
and more generally
Figure
5.2
A
graphical representation
of
the
HMM
Summarizing, we have
Xt
-
f
(.t
yt
-
f
(YL
~-1)
-
state equation
xt)
-
observation equation.
EXAMPLE
5.16
An example of
(5.84)
is the following popular model:
(5.84)
(5.85)
where
cpl(.)
and
cp2(.)
are given vector functions and
€lt
and
.5gt
are independent
d-dimensional Gaussian random vectors with zero mean and covariance matrices
C1
and
C2,
respectively.
SEQUENTIAL IMPORTANCE SAMPLING
145
Our
goal, based on an outcome
~1:~
of
YlZt,
is to determine, or estimate
on-line,
the
following quantities:
1.
The joint conditional pdf
f(x~:~
I
~1:~)
and, as a special case, the marginal conditional
f(zt
I
y1:t),
which is called thejlteringpdf.
2.
The expected performance
It is well known
[8]
that the conditional pdf
f(xlZt 1~1:~)
or the filtering pdf
f
(xt
I
y1:t)
can be found explicitly only for the following two particular cases:
(a) When
91
(x)
and
92
(x)
in
(5.85)
are linear, the filtering pdf
is
obtained from the cele-
brated
Kalmanjlter.
The Kalman filter is explained in Section A.6 of the Appendix.
(b) When the
{xt}
can take only a finite number, say
K,
ofpossible values, forexample, as
in binary signals, one can calculate
f(xt
I
ypt)
efficiently with complexity
0(K2
t).
Applications can be found in digital communication and speech recognition;
see,
for
example, Section A.7 of the Appendix.
Because the target pdf
/(xpt
1~1:~)
for the general state space model (5.84) is difficult
to obtain exactly, one needs to resort to Monte Carlo methods.
To
put the nonlinear filtering
problem in
thesequentialMonteCarloframeworkofSection5.7,wefirst
write
f(x~:~
1~1:~)
in sequential form, similar to (5.79).
A
natural candidate for the “auxiliary” pdf at time
t
is
the conditional pdf
f(x~,~
I
Y~:~).
That is, only the observations up to time
t
are used. By
Bayes’ rule we have for each
t
=
1,
.
. .
,
n,
f(x1:t
I
Y1:t)
f(x1:t-1
I
Y1:t-1)
-
-
f(Y1:t
I
Xl:t)f(Xl:t) f(Y1:t-1)
f
(Yl:t) J(Y1:t-1
I
Xl:t-l)f(Xl:t-l)
-
-
f(Y1:t-1
I
X1:t-1)
f(Yt
I
.t)
f(x1:t-1)
f(zt
I
zt-1)
f(Y1:t-1)
f(Yt
I
Y1:t-1)
f
(Y1:t-1)
f
(Y
1:t-1
I
X1:t-1 If(x1:t-
1)
(5.87)
where we have also used
(5.83)
and the fact that
f(xt
I
X~:~-I)
=
f(x~
I
xt-l),
t
=
1,2,.
.
.
by the Markov property.
This result is of little use for an exact calculation of
f(xl:,
I
yl:,),
since it requires com-
putation of
f(yt
I
y1:~-1),
which involves the evaluation of complicated integrals. However,
if both functions (pdfs)
f(zt
Ixt-l)
and
f(yt
I
zt)
can be evaluated exactly (which is a rea-
sonable assumption), then
SIS
can be used to approximately simulate from
f(x~,~
1~1:~)
as follows: Let
gt(xlrt
1
ypt)
be the importance sampling pdf. We assume that, similar to
(5.74), we can write
gt(xl:t
I
ylrt)
recursively as
146
CONTROLLING THE VARIANCE
Then, by analogy to (5.77), and using (5.87) (dropping the normalization constant
f(yt
ly~:~-~)), we can write the importance weight wt of a path
~1:~
generated from
gt(x1:t
I
y1:t) recursively as
(5.89)
A
natural choice for the importance sampling pdf
is
d"t
IXl:t-l,Yl:t)
=
f(.t
IXt-1)
,
(5.90)
in which case the incremental weight simplifies to
Ut
=
f(Yt
I
Xt).
(5.91)
With this choice of sampling distribution, we are simply guessing the values of the hidden
process
{
X,}
without paying attention to the observed values.
Once the importance sampling density is chosen, sampling from the target pdf
f(xpt
1~1:~)
proceeds as described in Section
5.7.
For
more details, the interested reader
is
referred
to
[8], [23], and [261.
W
EXAMPLE
5.17
Bearings-Only Tracking
Suppose we want to track an object (e.g., a submarine) via a radar device that only
reports the
angle
to
the object (see Figure
5.3).
In addition, the angle measurements
are noisy. We assume that the initial position and velocity are known and that the
object moves at
a
constant speed.
Let
Xt
=
(pit,
w1trp2,,
~2~)~
be the vector of positions and (discrete) velocities
of the target object at time
t
=
0,
1,2,
.
.
.,
and let Yt be the measured angle. The
problem is to track the unknown state
of
the object
Xt
based on the measurements
{
yt
}
and the initial conditions.
Figure
5.3
Track
the
object
via
noisy measurements
of
the
angle.
The process
(X,,
Yt),
t
=
0,1,2,.
.
.
is described by the following system:
Xt
=
A
Xt-1
+
€11
Yt
=
arctan(mt,pzt)
+
€2,
.
Here arctan(u,
w)
denotes the four-quadrant arc-tangent, that is, arctan(w/u)
+
c,
where
c
is either
0,
*7r,
or
f.rr/Z,
depending on the quadrant in which
(u,
u)
lies.
SEQUENTIAL
IMPORTANCE
SAMPLING
147
The random noise vectors
{€It}
are assumed to be
N(0, Cl)
distributed, and the
measurement noise
€gt
is
N(0,
“22)
distributed. All noise variables are independent
of each other. The matrix
A
is given by
1100
A=
(:
:
:
0001
The problem is to find the conditional pdf
f(xt
I
ylZt)
and, in particular, the ex-
pected system state
E[Xt
I
y~:~].
We indicate how this problem can be solved via
SIS.
Using
(5.90)
for the sampling
distribution means simply that
Xt
is drawn from a
N(Azt-l, Cl)
distribution.
As
a consequence of
(5.91)
the incremental weight,
ut
=
f(yt
I
zt),
is equal to the
value at
yt
of the normal pdf with mean
arctan(plt,pzt)
and variance
0;.
The
corresponding
SIS
procedure is summarized below. We note that the
SIS
procedure
is
Often implemented in parallel; that is, instead of computing the
{wkt}
and
{Xkt}
in series, one can compute them at the same time by running
N
parallel processes.
SIS
Procedure
1.
Initialize
XO.
2.
For each
t
=
1,.
.
.
,
n
draw
Xt
-
N(AXt-l,
CI).
3.
Update the weights
w1
=
IL~
wt-l,
where
wo
=
1
and
4.
Repeat
N
times and estimate the expected system state at time
t
as
where
xkt
and
Wkt
are the state and weight for the k-th sample, respectively.
As
a numerical illustration, consider the case where
02
=
0.005 and
with
“1
=
0.001.
Let
Xo
-
N
(pol
CO),
with
po
=
(-0.05,0.001,0.2, -0.055)T,
and
0
0.012
7
(I.
0
0.52
0
0
0
0.0052
0
0
0.32
0
‘
Ca
=
0.l2
Figure
5.4
shows how the estimated process
{Zt}
tracks the actual process
{xt}
over
100
time steps.
148
CONTROLLING
THE
VARIANCE
I
-0.5
-0.4
-0.3
-0.2
-0.1
0
Figure
5.4
Tracking
with
SIS.
1
As time increases, the tracking rapidly becomes more unstable. This is a con-
sequence of the degeneracy of the likelihood ratio. Indeed, after a few iterations,
only a handful of samples contain the majority
of
the importance weight. This yields
high variability between many runs and provides less reliable estimates.
To
prevent
this degeneracy, several heuristic resampling techniques have been proposed; see, for
example,
[8].
5.8
THE TRANSFORM LIKELIHOOD RATIO METHOD
The
transform likelihood ratio
(TLR) method is a simple, convenient, and
unifiing
way of
constructing efficient importance sampling estimators.
To
motivate the TLR method, we
consider the estimation of
e
=
q"X)I
t
(5.92)
where
X
-
f(x).
Consider first the case where
X
is one-dimensional (we write
X
instead
of
X).
Let
F
be the cdf of
X.
According to the IT method, we can write
x
=
F-'(U),
(5.93)
where
CJ
N
U(0,l)
and
F-'
is the inverse of the cdf
F.
Substituting
X
=
F-'(CJ)
into
C
=
JE[H(X)],
we obtain
e
=
IE[H(F-'(u))]
=
IE[H(u)]
.
Notethatincontrasttoe
=
E[H(X)],
wheretheexpectationistakenwithrespecttof(z),
in
C
=
[H(U)],
the expectation is taken with respect to the uniform
U(0,l)
distribution.
The extension to the multidimensional case is simple.
THE
TRANSFORM
LIKELIHOOD
RATIO
METHOD
149
Let
h(u;
v)
be another density on
(0,
I), parameterized by some reference parameter
v,
with
h(u;
u)
>
0
for all
0
<
u
<
1
(note that
u
is a variable and not a parameter). An
example is the Beta(v, 1) distribution, with density
h(u;
v)
=
vuv-1,
u
E
(0,l)
,
h(u;
v)
=
v
(1
-
u)-l,
u
E
(0,l)
.
with
v
>
0,
or
the Beta(1,
v)
distribution, with density
Using Beta(
1,
v)
as the importance sampling pdf, we can write
l
as
e
=
IE,[H(U)
W(U;
v)]
,
where
U
-
h(u;
v).
and
(5.94)
(5.95)
is the likelihood ratio. The likelihood ratio estimator of
C
is given by
N
e^=
N-'
1
k(Uk) w(uk;
U)
,
where
U1,.
. .
,
UN
is a random sample from
h(u;
v),
We call (5.96) the
inverse transform
likelihoodratio
(ITLR) estimator; see Kroese and Rubinstein
[
191.
(5.96)
k=l
Suppose, for example,
X
N
Weib(cr,
A),
that
is,
X
has the density
f(z;
a,
A)
=
aA(Az)a-1e-(X2.)u.
(5.97)
Note that a Weibull random variable can be generated using the transformation
x
=
A-1
Z'I",
(5.98)
where
2
is a random variable distributed
Exp(
1).
Applying the IT method, we obtain
x
=
F-'(u)
=
A-'(- ln(1
-
u))"~,
(5.99)
and
k(U,)
@(Ut;
v)
in (5.96) reduces to
H(A-'
(-
ln(1
-
Ui))'Ia)/h(Ui;
u).
The TLR method is a natural extension of the ITLR method. It comprises two steps.
The first
is
a simple
change
of
variable
step, and the second involves an application of the
SLR
technique to the transformed pdf.
To
apply the first step, we simply write
X
as a function of another random vector, say as
x
=
C(Z)
.
(5.100)
If we define
RZ)
=
H(G(Z))
9
then estimating
(5.92)
is equivalent to estimating
e
=
E[H(Z)]
.
(5.101)
Note that the expectations in (5.92) and (5.101) are taken with respect to the original density
of
X
and the transformed density
of
Z.
As an example, consider again a one-dimensional
150
CONTROLLING THE VARIANCE
case and let
X
-
Weib(cu,
A).
Recalling
(5.98),
we have
H(Z)
=
H(X-'
Z1/a)
and thus,
To
apply the second step, we assume that
Z
has a density
h(z;O)
in some class of
densities
{h(z;
q)}.
Then we can seek to estimate
e
efficiently via importance sampling,
for example, using the standard likelihood ratio method. In particular, by analogy to
(5.59).
we obtain the following estimator:
e
=
IqH(A-1
Z'/")]
.
where
(5.102)
and
zk
-
h(z;
q).
We shall call the SLR estimator
(5.102)
based on the transformation
(5.100), the
TLR
estimator.
As an example, consider again the
Weib(a,
A)
case. Using
(5.98).
we could take
h(z;
7)
=
e-qz
as the sampling pdf, with
7
=
6
=
1
as the nominal
parameter. Hence, in this case, Fin
(5.102)
reduces to
with
(5.103)
and
Zk
-
Exp(7).
analogy to (5.64), the following
CE
program:
To
find the optimal parameter vector
q*
of
the
TLR
estimator (5.102) we can solve, by
max
~(q)
=
max
E,
[
H(z)
W(z;
e,
7)
In
h(z;
711
(5.104)
11 11
and similarly for the stochastic counterpart of (5.104).
Since
Z
can be distributed quite arbitrarily, one would typically choose its distribution
from an exponential family of distributions (see Section
A.3
of the Appendix), for which
the optimal solution
q*
of (5.104) can be obtained analytically in a convenient and simple
form. Below we present the TLR algorithm for estimating
e
=
E,[H(X)],
assuming that
X
is a random vector with independent, continuously distributed components.
Algorithm
5.8.1
(TLR
Algorithm)
I,
For a given random vector
X,
find a transformation
G
such that
X
=
G(Z), with
Z
-
h(z;
0).
For example, take
Z
with all components being iid and distributed
according to an exponential family (e.g.,
Exp(
1)).
2.
Generate a random sample
z1,.
. .
,
ZN
from
h(.;
7).
3.
Solve
the stochastic counterpart
of
the program
(5.104)
@or
a one-parameter expo-
nential family parameterized by the mean, apply directly the analytic solution
(A.
IS)).
Iterate gnecessary Denote the solution by
6.
PREVENTING
THE DEGENERACY
OF
IMPORTANCE
SAMPLING
151
4.
Generate a (larger) random sample
Z1,
.
,
.
,
ZN,
from
h(.;
?j)
and estimate
L
=
The TLR Algorithm 5.8.1 ensures that as soon as the transformation
X
=
G(Z)
is
chosen, one can estimate
C
using the TLR estimator (5.102) instead of the SLR estimator
(5.59). Although the accuracy of both estimators (5.102) and (5.59) is the same (Rubinstein
and Kroese [29]), the advantage of the former is its universality and it ability to avoid the
computational burden while directly delivering the analytical solution of the stochastic
counterpart of the program (5.104).
lE[H(G(Z))]
via the
TLR
estimator
(5.102).
takingr]
=
6.
5.9
PREVENTING THE DEGENERACY
OF
IMPORTANCE SAMPLING
In this section, we show how to prevent the
degeneracy
of importance sampling estimators.
The degeneracy of likelihood ratios in high-dimensional Monte Carlo simulation problems
is one of the central topics in Monte Carlo simulation.
To
prevent degeneracy, several
heuristics have been introduced (see, for example, [8],
[23],
[26]),
which are not widely
used by the Monte Carlo community. In this section we first present
a
method introduced
in [22] called the
screening
method. Next, we present its new modification, which quite
often allows substantial reduction of the dimension
of
the likelihood ratios. By using this
modification we not only automatically prevent the degeneracy of importance sampling
estimators but also obtain variance reduction.
To motivate the screening method, consider again Example 5.14 and observe that
only the first two importance sampling parameters of the five-dimensional vector
?
=
(51,
G2,
G3,
G4,
G5)
are substantially different from those in the nominal parameter vector
u
=
(u1,
~2~21.3,
214,
u5).
The reason is that the partial derivatives of
l
with respect to
u1
and
u2
are significantly larger than those with respect to
us,
214,
and
us.
We call such ele-
ments
u1
and
212
bottleneck elements.
Based on this observation, one could use instead of
the importancesampling vector?
=
(51,52,G3,G4,$5)
the vector?
=
(51,52,
ug,u4,u5),
reducing the number
of
importance sampling parameters from five to two. This not only
has computational advantages
-
one needs to solve a two-dimensional variance or CE min-
imization program instead of a five-dimensional one
-
but also leads to further variance
reduction since the likelihood ratio term W with two product terms is less “noisy” than the
one with five product terms.
To identify the bottleneck elements in our bridge example we need to estimate, for every
i
=
1,
. . .
,5,
the partial derivative
Observe that for general
w
#
u
we obtain
152
CONTROLLING
THE
VARIANCE
0
1
2
3
Point estimators for al(u)/aui, based on a random sample X1,. . .
,
XN
from
f(x;
v),
are thus found as the sample mean, say
M,
of the random variables
1
1
0.3
0.2
0.1
0.0623 0.0123
2.1790 2.5119
0.3
0.2
0.1
0.0641 0.0079
2.3431 2.4210
0.3
0.2 0.1 0.0647 0.0080
2.3407 2.2877
0.3 0.2
0.1
0.0642 0.0079
1N.
(5.105)
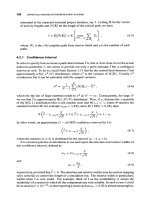
The corresponding (1
-a)
confidence interval is given (see (4.7)) by
(M
*
21-+
S/fi),
with
S
being the sample standard deviation of (5.105).
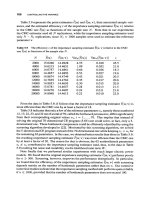
Table 5.2 presents point estimates and
95%
confidence intervals for
al(u)/au,,
i
=
1
, ,
5,withC(u)=P(S(X) 1.5)andu=
(l,1,0.3,0.2,0.1),asinExample5.14.The
partial derivatives were estimated using the initial parameter vector
u
=
(1,1,0.3,0.2,0.1)
and a sample size of
N
=
lo4.
The bottleneck cuts, corresponding
to
the largest values of
the partial derivatives, are marked in the last column of the table by asterisks.
Table
5.2
Point estimates
and
confidence
intervals
for
6"(u)/du,,
i
=
1,
. . .
,5.
i
PE
CI
bottleneck
1
8.7 e-2 (7.8 e-2,9.5 e-2)
*
2 9.2 e-2 (8.3 e-2,
1.0
e-1)
*
3
-
6.0 e-3 (-2.2 e-2,
1
.O
e-2)
4 4.5 e-2
(1.5
e-2,7.4 e-2)
5
5.5
e-2 (6.4 e-4,
1.1
e-1)
We see in Table 5.2 that not only are the partial derivatives with respect to the first two
components larger than the remaining three, but also that the variability
in
the estimates is
much smaller for the first two.
So,
we
can exclude the remaining three from updating and
thus proceed with the first two.
Table 5.3 presents data similar to those in Table 5.1 using the screening method, that
is,
with
(q,
vz1
ug,
u4,
us)
starting from
u
=
(1,1,0.3,0.2,0.1) and iterating again
(5.70)
(for the first iteration) and (5.69) two more times. One can see that the results are very
similar to the ones obtained in Table
5.1.
Table
5.3
Iterating
the
two-dimensional vector
?
using
the
screening
method.
iteration
I
V
IF
RE
A
In general, large-dimensional, complex simulation models contain both bottleneck and
nonbottleneck parameters. The number of bottleneck parameters is typically smaller than
the number of nonbottleneck parameters. Imagine a situation where the size (dimension)
PREVENTING
THE
DEGENERACY
OF
IMPORTANCE
SAMPLING
153
of the vector
u
is large, say 100, and the number of bottleneck elements
is
only about
10-
15.
Then, clearly, an importance sampling estimator based on bottleneck elements alone
will not only
be
much more accurate than its standard importance sampling counterpart
involving all 100 likelihood ratios (containing both bottleneck and nonbottleneck ones), but
in contrast to the latter will not be degenerated.
The bottleneck phenomenon often occurs when one needs to estimate the probability
of a nontypical event in the system, like a rare-event probability. This will be treated in
Chapter
8.
For example, if one observes a failure in a reliability system with highly reliable
elements, then it
is
very likely that several elements (typically the less reliableones) forming
a minimal cut in the model all fail simultaneously. Another example is the estimation of
a
buffer overflow probability in a queueing network, that is, the probability that the total
number of customers in all queues exceeds some large number. Again, if a buffer overflow
occurs, it is quite likely that this has been caused by a buildup in the bottleneck queue,
which is the most congested one in the network.
Recall that for high-dimensional simulation models the CE updating formula
(5.65)
is
useless, since the likelihood ratio term
W
is the product of
a
large number of marginal
likelihoods, and will cause degeneracy and large variance of the resulting importance Sam-
pling estimator On the other hand, importance sampling combined with screening and
involving only a relatively small number of bottleneck elements (and thus a product of a
relatively small number of likelihoods) will not only lead to tremendous variance reduction
but will produce a stable estimator as well.
If not stated otherwise, we will deal with estimating the following performance:
where
H(X)
is assumed to be an arbitrary sample function and
X
is an n-dimensional
random vector with pdf
f(x;
u).
A particular case is
H(X)
=
I{sp~2~},
that is,
H(X)
is an indicator function. In Chapter
8
we apply our methodology to rare events, that is, we
assume that
y
is very large,
so
e
is a rare-event probability, say
e
5
Next, we introduce a modification of the above screening method
[22],
where we screen
out the bottleneck parameters using the estimator
G
in
(5.70)
rather than (the estimator
of)
the gradient of
l(u).
As
we shall see below, there are certain advantages in using the vector
G
for identifying the bottleneck parameters rather than its gradient.
5.9.1
The Two-Stage Screening Algorithm
Here we present a two-stage screening algorithm, where at the first stage we identifi the
bottleneck parameters and at the second stage wejndthe estimator of the optimal bottleneck
parameter vector by solving the standard convex CE program
(5.66).
For simplicity, we
assume that the components
of
X
are independent and that each component is distributed
according to a one-dimensional exponential family that is parameterized by the mean
-
the
dependent case could be treated similarly. Moreover,
H(x)
is assumed to be a monotonically
increasing function in each component of
x.
A consequence of the above assumptions is
that the parameter vector
v
has dimension
n.
That is,
v
=
(~1,
.
.
.
,7in).
Let
B
c
{
1,.
,
. ,
n}
denote the indices of the bottleneck parameters and
B
denote the
indices
of
the nonbottleneck parameters. For any n-dimensional vector y, let
yv
denote
the IVI-dimensional vector with components
{yt,
i
E
V}.
154
CONTROLLING
THE
VARIANCE
As soon as
B
is identified in the first stage and the corresponding optimal parameter
vector,
vh
say, is estimated in the second stage, via
GB
say, one can estimate
!
via
(5.106)
where
X~B
is the k-th sample of
Xg,
and
fB
is the pdf of
Xg.
We call this estimator the
screening estimator.
Note that
u
and the nonscreening importance sampling estimator
G
of the optimal param-
eter
v*
can be written as
u
=
(UB,
ug)
and
G
=
(GB,
GB).
where
us
and
GB
denote the
nonbottleneck
parameter vectors
of
the original and estimated reference parameter vectors
of the standard importance sampling estimator
(5.59),
respectively. It is crucial to under-
stand that in the screening estimator (5.106) we automatically set
3,
=
UB.
Consequently,
because
of
the independence of the components, the likelihood ratio term
W(X)
reduces
to a product of
IBI
quotients of marginal pdfs instead
of
the product of
n
such quotients.
Note also that the optimal parameter vector
GB
in (5.106) can be obtained by using the stan-
dard convex CE program (5.65), provided that the pair
(u,
v)
is replaced by its bottleneck
counterpart
(UB,
VB).
For convenience we rewrite
(5.65)
by omitting
W
(that is, XI,
.
.
. ,
XN
are generated
under
u).
We have
.N
(5.107)
Since (5.107) contains no likelihood ratios, the parameter vector
G
obtained from the solu-
tion
of
(5.107)
should be quite accurate.
We shall implement screening for both CE and VM methods. Recall that for the CE
method the parameter vector
G
(and
GB)
can often be updated analytically, in particular
when the sampling distribution comes from an exponential family. In contrast, for VM the
updating typically involves a numerical procedure.
The identification of the size of the bottleneck parameter vector
vh
at the first stage
is associated with a simple classification procedure that divides the n-dimensional vector
C
into two parts, namely,
G
=
(CB,?B),
such that
VB
z
UB
(componentwise), while
GB
#
UB
(componentwise). Note that it can be readily shown, by analogy to Proposition
A.4.2 in the Appendix, that if each component of the random vector
X
is from a one-
parameter exponential family parameterized by the mean and if
H(x)
is a monotonically
increasing function in each component of
x,
then each element of
v;j
is at least as large as
the corresponding one of
UB.
We leave the proof as an exercise for the reader.
Below we present a detailed two-stage screening algorithm based on CE, denoted as the
CE-SCR algorithm. Its VM counterpart, the VM-SCR algorithm, is similar. At the first
stage of our algorithm we purposely solve the same program
(5.107)
several times.
By
doing
so
we collect statistical data, which are used to identify the size
of
the estimator of
Vk.