Báo cáo y học: " What happened after the initial global spread of pandemic human influenza virus A (H1N1)? A population genetics approach" ppsx
Bạn đang xem bản rút gọn của tài liệu. Xem và tải ngay bản đầy đủ của tài liệu tại đây (2.11 MB, 9 trang )
SHOR T REPOR T Open Access
What happened after the initial global spread of
pandemic human influenza virus A (H1N1)?
A population genetics approach
Fernando Martinez-Hernandez
1
, Diego Emiliano Jimenez-Gonzalez
1
, Arony Martinez-Flores
1
,
Guiehdani Villalobos-Castillejos
2
, Gilberto Vaughan
3
, Simon Kawa-Karasik
1
, Ana Flisser
4
, Pablo Maravilla
1
,
Mirza Romero-Valdovinos
1*
Abstract
Viral population evolution dynamics of influenza A is crucial for surveillance and control. In this paper we analyzed
viral genetic features during the recent pandemic caused by the new influenza human virus A H1N1, using a con-
ventional population gene tics approach based on 4689 hemagglutinin (HA) and neuraminidase (NA) sequences
available in GenBank submitted between March and December of 2009. This analysis showed several relevant
aspects: a) a scarce initial genetic variability within the viral isolates from some countries that increased along 2009
when influenza was dispersed around the world; b) a worldwide virus polarized behavior identified when compar-
ing paired countries, low differentiation and high gene flow were found in some pairs and high differentiation and
moderate or scarce gene flow in others, independently of their geographical closeness, c) lack of positive selection
in HA and NA due to increase of the population size of virus variants, d) HA and NA variants spread in a few
months all over the world being identified in the same countries in different months along 2009, and e) contain-
ment of viral variants in Mexico at the beginning of the outbreak, probably due to the control measures applied
by the government.
Findings
In April 2009 the Mexican Secretar iat of Health
reported an outbreak of respiratory disease. A new
human influenza virus A H1N1 with molecular features
of North American and Eurasian swine, avian, and
human influenza viruses was identified [1]. In the same
month, the W orld Health Organization (WHO) classi-
fied the global spread of this virus as a public health
event of international concern. After documentation of
human to human transmission of the virus in at least
two WHO reg ions, the highest pandemic level was
declared [2]. As a result of the epidemiological surveil-
lance, large amounts of A H 1N1 genetic sequences were
accumulated in the GenBank and s everal molecular epi-
demiological studies monitoring evolutionary inferences
of viral gene flow in time and space were reported [3-6].
In December 2009, A H1N1 was worldwide spread,
affecting 208 countries, wi th at least 12,220 deaths [7].
Thus, more sequences were reported but no overall
population genetics studies were performed, and also no
compa rison of the initial and the viral v ariants (VV) has
been reported. The goal of the present study is to pro-
vide an overview with a phylogeographic behavior dur-
ing the initial spread and subsequent worldwide
establishment of influenza pandemic.
Analysis of genetic diversity within and between popu-
lations were calculated using DnaSP v4 [8-10] and
included nucleotide diversity (π), haplotyp e polymorph-
ism (θ), genetic differentiation index (G
ST
), coancestry
coefficient (F
ST
) and migration (Nm). These indexes
refer to: π, average proportion of nucleotide differences
between all possible pairs of sequences in the sample; θ,
proportion of nucleotide sites that are expected to be
polymorphic in any suitable sample from this region of
the genome. Both indexes are used to assess polymorph-
isms at the DNA level and monitor diversity within or
* Correspondence:
1
Departamento de Ecología de Agentes Patogenos, Hospital General “Dr.
Manuel Gea Gonzalez”, Calzada de Tlalpan 4800, DF 14080, Mexico
Full list of author information is available at the end of the article
Martinez-Hernandez et al. Virology Journal 2010, 7:196
/>© 2010 Martinez-Hernandez et al; licensee BioMed Central Ltd. This is an Open Access article distributed under the terms of the
Creative Commons Attribution License ( enses/by/2.0), which permi ts unrestricted use, distribution, and
reproduction in any medium, provided the original work is properly cited.
between ecological populations, and examine the genetic
variation in related species or their evolutionary rela-
tionships [9]. F
ST
and G
ST
are two equivalent genetic
statistics used to measure differentiation between or
among pop ulations; F
ST
is used when there are only two
alleles at a locus, and G
ST
with multiple alleles; common
used values for genetic differentiation are: 0 to 0.5 small;
0.05 to 0.15 moderate; 0.15 to 0.25, great, and values
above 0.25 indicate huge genetic differentiation, while
negative values are due to small sample size [8] and
thus, when f ound, zero value was assigned [11,12]. The
gene flow or migration index (Nm) refers to movement
of organisms among subpopulations, those strongly dif-
ferentiated have a Nm < < 1, while Nm > 4 behave as a
single panmictic unit [9].
The previously described genetic diversity analyses
were performed with A H1N1 Influenza Database [13]
with sequences submitted between April and December
2009 (collection dates and sequ ence origin are found in
addition file 1), including three or more sequences per
country of 500 continuous base pairs (bp), recorded
during the initial four months of the pandemics and, for
the global analysis, those having at least 750 continuous
bp were used. Multiple alignments were performed by
CLUSTALWprogramv1.8[14]andadjustedusing
MEGA program v4 [15,16]. A median joining method
for constructing networks from reco mbination-free
population data, featuring K ruskal’ s algorithm for find-
ing minimum spanning trees [17] was used with the
program Network 4v.5.1.6 [18].
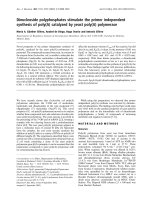
Up to 3462 sequences (1779 of HA and 1683 of NA)
with 2208 VV (1216 of HA and 992 of NA) from 31
countries were used, interestingly 80% were recorded
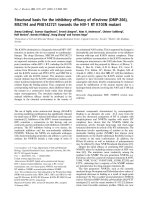
between April and July (Figure 1). Figure 2 shows the
number of sequences analyzed (first row), θ values (sec-
ond row) and π values (third row) for the analysis per-
formed of the sequences obtained in the initial four
months (left column) or of the global analysis (right col-
umn). As it can be seen few countries provided most
variants. Theta and Pi showed a similar high trend in
around 50% of the countries in the analysis of the initial
four months (average π = 0.0025 for HA and π = 0.0016
for NA)). In contrast, the overall analysis shows that
polymorphism increased in all the countries (π = 0.0125
for HA and π = 0.0153 for NA), with higher levels for
USA, Russia, Thailand, Philippines and Spain.
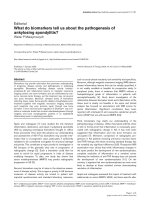
Genetic population indexes were compared in the
countries with m ost sequences re ported (USA, Spain,
Japan, Mexico and China). Figure 3 shows, in five plots,
the data of these countries paired against all those coun-
tries with HA and NA reported during the initial four
months of t he pandemic. For example in USA it can be
seen that genetic differentiation parameters (F
ST
and
G
ST
) were high when this country was paired with Mex-
ico, France, Greece or New Zealand (seen as full or
empty dots or triangles), while the values of genetic flow
(Nm) were higher when USA was compared to Chile,
Germany, Russia, China, Philippines or Australia (seen
as shadowed areas or star peaks). Following the same
explanation for the other four countries, it can be seen
that some showed high or low degree of differentiation
for F
ST
and G
ST
but opposed for Nm. Thus, the highest
flow is seen in USA followed by Japan, China and Spain,
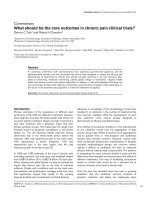
and the lowest was found in Mexico. Interestingly, i n
the image obtained when samples from April-December
were used, a different pattern can be seen: USA shows a
Figure 1 Number of sequen ces and influenza variants of HA and NA identified monthly along 2009. Full bars correspond to HA
sequences, empty bars to NA sequences; left dash bars to HA variants and right dash bars to NA variants.
Martinez-Hernandez et al. Virology Journal 2010, 7:196
/>Page 2 of 9
moderate flow with all countries used for comparison;
while Mexico is the country with the highest differentia-
tion. The in-between countries are Japan, China, Spain
and Singapore; the latter country appears in figure 4 but
not in 3 because there are no data reported for the early
months. Additional file 2 includes all data obtained for
F
ST
,G
ST
and Nm. Negative values for F
ST
and G
ST
indi-
cate no differentiation; in some cases NA showed lower
F
ST
values that those of HA with a similar trend. Taji-
ma’ s D provided negative values: -2.619 and -2.380 in
the initial four months and -1.802 and -2.358 in the
overall analys is, for HA and NA, respectively, indicati ng
arousal of new polymorphisms as a consequen ce of
population size expansion along 2009 [9].
Figure 5 shows the widespread distribution of the
mainHAandNAVVaroundtheworldandalongthe
time; f or example, VV57NA was identified in USA and
Mexico in April; one month later it was also present in
Brazil, France, Poland, Finland, China and Taiwan; in
June in Chile, Greece and Japan; and in July also in Italy
and Myanmar (see also additional file TS2).
Figures 6 and 7 show the networks obtained for HA
and NA during the first and the last four months (A
and B respectively), with the Median Joining method
that estimates genealogic relationships. Figure 6A shows
three major dispersion centers for HA: one that clus-
teredvariantsfromUSAandAsia,asecondonethat
grouped VV m ainly from USA, Mexico and China and
the third wit h several Spanish variants. Using NA
sequences (Figure 7A) two principal dispersion centers
were identified: one clustering mainly VV form USA
and another one that grouped VV form USA, Mexico
and China; simil arly to HA, several Spanish VV were
dis persed. Networks obtained between July and D ecem-
ber showed only one dispersion center, with several VV
from Mexico, Chin a and Singa pore in the HA tree, as
seen in figure 6B and numerous separa ted Spanish VV
in the NA tree (Figure 7B).
Figure 2 Number of influenza sequences of HA (full bars) and NA (empty bars) reported during the initial four mont hs (2A) and for
the global analysis (2B), θ values found for the same sequences and periods are seen in figures 2C and 2D, while π values are in
figures 2E and 2F.
Martinez-Hernandez et al. Virology Journal 2010, 7:196
/>Page 3 of 9
Figure 3 Radial plots of countries with HA and NA reported along the first four months (April-July, 2009) of the pandemic show
population genetic indexes from countries that reported the higher number of influenza sequences paired against all those countries
with A H1N1. Yellow and blue areas correspond to gene flow (Nm × 10
2
) for HA and NA respectively; triangles correspond to F
ST
values, full for
HA and empty for NA; circles correspond to G
ST
values, full for HA and empty for NA. In order to facilitate viewing all values above 3 they are
seen as 3.
Martinez-Hernandez et al. Virology Journal 2010, 7:196
/>Page 4 of 9
Figure 4 Radial plots of countries with HA and NA reported between April and December 2009 show population genetic indexes
from countries that reported the higher number of influenza sequences paired against all those with A H1N1. Yellow and blue areas
correspond to gene flow (Nm × 10
2
) for HA and NA respectively; triangles correspond to F
ST
values, full for HA and empty for NA; circles
correspond to G
ST
values, full for HA and empty for NA. In order to facilitate viewing all values 3 or above are seen as 3.
Martinez-Hernandez et al. Virology Journal 2010, 7:196
/>Page 5 of 9
Figure 5 World map showing HA and NA influenza variants found in more than three countries along the study. Full geometric figures
correspond to HA sequences; empty to NA.
Figure 6 Median joining network sho wing the HA variants identified during the first four months (A) or from July to December (B).
The sizes of circles represent the frequency of VV. In black variants from USA, blue Spain, white Japan, green Singapore, yellow Mexico, red
China and grey from other countries.
Martinez-Hernandez et al. Virology Journal 2010, 7:196
/>Page 6 of 9
Our study shows that a high viral diversity during the
2009 pan demic took place, as compared, for example, to
a study of HA performed in 1999-2000 with samples
from French infected patients with A/H3N2, which
showed an average of π = 0.0034 [19] which is 440
times lower that the one found in our study (π~0.012
for HA), suggesting that the variability of a pandemic
virus is higher than that of an epidemic virus. Negative
values of Tajima’ sDforHAandNAimplythatno
selection force is yet influencing the suc cess of the
pandemic virus. Some studies show different extent of
changes: a study with 423 com plete genomes of hum an
H3N2 influenza A virus collected between 1997 and
2005 in New York, USA, revealed that adaptive evolu-
tion occurred only sporadically, rather, a sto chastic pro-
cess of viral migration and clade reassortment played a
vital role in shaping short-term evolutionary dynamics
[20]. Another study analyzed 357 nucleotide sequences
for HA from A H1N1 and found some codons under
positive selection, suggesting that these changes may
Figure 7 Median joining network sho wing the NA variants identified during the first four months (A) or from July to December (B).
The sizes of circles represent the frequency of VV. In black variants from USA, blue Spain, white Japan, green Singapore, yellow Mexico, red
China and grey from other countries.
Martinez-Hernandez et al. Virology Journal 2010, 7:196
/>Page 7 of 9
have predictive value for future epidemic variants [21].
Ther efore, precaution should be taken because A H1N1
may peak again, since our data show that the variants
are still in e xpan sion . Network analys is showed that the
major dispersion center was shared by China, Mexico
and USA during the initial four months, and probably
reflect the fact that there was a greater interest in the
scientific community for submitting and reporting viral
sequences in GenBank. Also, HA was more variable
than NA, which is in accordance with the statement
that the HA gene exhibits a rapid mutation rate [22].
When integrating data of F
ST
,G
ST
and Nm of this
new A H1N1 it was observed that the virus had differ-
ent behaviors along 2009 when comparing paired coun-
tries; which was, in general, independent of their
geographical proximity. The extremes were found in
USA and Mexico; the former showed a high distribution
of virus variants to and from several countries in the
initial four months of the pandemic, becoming a world-
wide dispersion towards the end o f the year, while in
Mexico minimal influx of variants was seen in the initial
four months. This was probably due to the governmen-
tal actions taken in April to contain the influenza out-
break in the whole Mexican Republic [23] or to the
exclusion of small sequences for the analyses performed.
Also, some countries decided to close their borders or
send travel alerts recommending their citizens to avoid
nonessential travel to Mexico [stated in 2009 in 24]. At
the beginning of the pandemic, federal and local health
authorities in Mexico established several measures,
mainly focused in two lines 1) social spacing that
included closing temporally churches, schools, restau-
rants, cinemas, theaters and other sites of massive
human concentration, 2) intensive hygiene campaign
that publicized basic aspects of health such as continu-
ous hand washing, avoiding unprotected sneezin g, using
disposable surgical masks and surveillance of symptoms
associated to flu.
Additional material
Additional file 1: A H1N1 gen e sequences used for the genetic
diversity analysis. List of GenBank sequences of A H1N1, number of
accession and country of origin.
Additional file 2: Population genetic indexes among paired
sequences of A H1N1 obtained from different countries. List of
values (indexes) obtained for population genetic analysis among paired
sequences from different countries after DnaSP v4 analysis.
Abbreviations
F
ST
: coancestry coefficient statistics; G
ST
: genetic differentiation index; HA:
hemagglutinin; NA: neuraminidase; NN: migration index; VV: viral variants;
VV57NA: viral variant 57 of neuraminidase; WHO: World Health Organization;
π: nucleotide diversity; θ: haplotype polymorphism.
Acknowledgements
This work was supported by Grants PICDSI09-228 and PICDSI09
Author details
1
Departamento de Ecología de Agentes Patogenos, Hospital General “Dr.
Manuel Gea Gonzalez ” , Calzada de Tlalpan 4800, DF 14080, Mexico.
2
Departamanto de Parasitologia Escuela Nacional de Ciencias Biologicas,
Prolongación Carpio s/n, Instituto Politecnico Nacional, DF 11340, Mexico.
3
Departamento de Investigaciones Inmunologicas, Instituto de Diagnostico y
Referencia Epidemiologicos, Carpio 470 SSA, DF 11340, Mexico.
4
Departamento de Microbiologia y Parasitologia, Facultad de Medicina, Av.
Universidad 3000, Universidad Nacional Autonoma de Mexico, DF 04510,
Mexico.
Authors’ contributions
FMH, DEJG, AMF and GVC collected data and carried out the bioinformatics
analysis. GV, SKK and AF participated in biological interpretations of results
and in the discussion. PM and MRV formulated the idea. All authors
contributed in writing the manuscript.
Competing interests
The authors declare that they have no competing interests.
Received: 3 June 2010 Accepted: 20 August 2010
Published: 20 August 2010
References
1. Perez-Padilla R, de la Rosa-Zamboni D, Ponce de Leon S, Hernandez M,
Quiñones-Falconi F, Bautista E, Ramirez-Venegas A, Rojas-Serrano J,
Ormsby CE, Corrales A, Higuera A, Mondragon E, Cordova-Villalobos JA,
INER Working Group on Influenza: Pneumonia and respiratory failure from
swine-origin influenza A (H1N1) in Mexico. N Engl J Med 2009,
361:680-689.
2. WHO influenza update page. [ />en/index.html].
3. Bansal S, Pourbohloul B, Grenfell B, Meyers LA: The shifting demographic
landscape of influenza. PLoS Curr Influenza 2009, 1:RRN1047.
4. Lemey P, Suchard M, Rambaut A: Reconstructing the initial global spread
of a human influenza pandemic: a Bayesian spatial-temporal model for
the global spread of H1N1pdm. PLoS Curr Influenza 2009, 2:RRN1031.
5. Nelson M, Spiro D, Wentworth D, Beck E, Fan J, Ghedin E, Halpin R, Bera J,
Hine E, Proudfoot K, Stockwell T, Lin X, Griesemer S, Kumar S, Bose M,
Viboud C, Holmes E, Henrickson K: The early diversification of influenza
A/H1N1pdm. PLoS Curr Influenza 2009, 3:RRN1126.
6. Rambaut A, Holmes E: The early molecular epidemiology of the swine-
origin A/H1N1 human influenza pandemic. PLoS Curr Influenza 2009, 18:
RRN1003.
7. WHO Pandemic (H1N1) 2009 - update 81. [ />2009_12_30/en/index.html].
8. Rozas J, Sánchez-DelBarrio JC, Messeguer X, Rozas R: DnaSP, DNA
polymorphism analyses by the coalescent and other methods.
Bioinformatics 2003, 19:2496-21497.
9. Hartl DL, Clark AG: Principles of Population Genetics Sinauer Associates, Inc.
Publishers, Sunderland, Massachusetts, 3 1997.
10. Weir BS, Cockerham CC: Estimating F-statistics for the analysis of
population structure. Evolution 1984, 38:1358-1370.
11. Kullo IJ, Ding K: Patterns of population differentiation of candidate genes
for cardiovascular disease. BMC Genet 2007, 8:48.
12. Martinez-Hernandez F, Jimenez-Gonzalez DE, Chenillo P, Alonso-
Fernandez C, Maravilla P, Flisser A: Geographical widespread of two
lineages of Taenia solium due to human migrations: Can population
genetic analysis strengthen this hypothesis? Infect Genet Evol 2009,
9:1108-1114.
13. A H1N1 Influenza Database. [ />html].
14. Thompson JD, Higgins DG, Gibson TJ: CLUSTAL W: improving the
sensitivity of progressive multiple sequence alignment through
sequence weighting, position-specific gap penalties and weight matrix
choice. Nucleic Acids Res 1994, 22:4673-4680.
Martinez-Hernandez et al. Virology Journal 2010, 7:196
/>Page 8 of 9
15. Bandelt J, Forster P, Röhl A: Median-joining networks for inferring
intraspecific phylogenies. Mol Biol Evol 1999, 16:37-48.
16. Kimura M: A simple method for estimating evolutionary rates of base
substitutions through comparative studies of nucleotide sequences.
J Mol Evol 1980, 16:111-120.
17. Kumar S, Tamura K, Nei M: MEGA3: Integrated software for Molecular
Evolutionary Genetics Analysis and sequence alignment. Brief Bioinform
2004, 5:150-163.
18. Fluxus-engieneering, expertise in software for genetics and engineering.
[ />19. Lavenu A, Leruez-Ville M, Chaix ML, Boelle PY, Rogez S, Freymuth F, Hay A,
Rouzioux C, Carrat F: Detailed analysis of the genetic evolution of
influenza virus during the course of an epidemic. Epidemiol Infect 2006,
134:514-520.
20. Nelson MI, Simonsen L, Viboud C, Miller MA, Taylor J, George KS,
Griesemer SB, Ghedin E, Sengamalay NA, Spiro DJ, Volkov I, Grenfell BT,
Lipman DJ, Taubenberger JK, Holmes EC: Stochastic processes are key
determinants of short-term evolution in influenza a virus. PLoS Pathog
2006, 2:e125.
21. Bush RM, Fitch WM, Bender CA, Cox NJ: Positive selection on the H3
hemagglutinin gene of human influenza virus A. Mol Biol Evol 1999,
16:1457-1465.
22. Fitch WM, Leiter JM, Li XQ, Palese P: 1991. Positive Darwinian evolution in
human influenza A viruses. Proc Natl Acad Sci USA 1991, 88:4270-4274.
23. Mexico Health secretariat page. [ />noticias/influenza/lineamientos.html].
24. A service of the bureau of consular affairs U.S. Department of State.
[ />doi:10.1186/1743-422X-7-196
Cite this article as: Martinez-Hernandez et al.: What happened after the
initial global spread of pandemic human influenza virus A (H1N1)?
A population genetics approach. Virology Journal 2010 7:196.
Submit your next manuscript to BioMed Central
and take full advantage of:
• Convenient online submission
• Thorough peer review
• No space constraints or color figure charges
• Immediate publication on acceptance
• Inclusion in PubMed, CAS, Scopus and Google Scholar
• Research which is freely available for redistribution
Submit your manuscript at
www.biomedcentral.com/submit
Martinez-Hernandez et al. Virology Journal 2010, 7:196
/>Page 9 of 9