GIS and Evidence-Based Policy Making - Chapter 6 potx
Bạn đang xem bản rút gọn của tài liệu. Xem và tải ngay bản đầy đủ của tài liệu tại đây (2.34 MB, 20 trang )
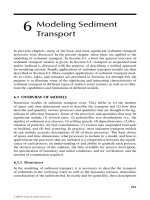
6
Crime Map Analyst: A GIS to Support
Local-Area Crime Reduction
Paul Brindley, Max Craglia, Robert P. Haining,
and Young-Hoon Kim
CONTENTS
6.1 Introduction 113
6.2 Current Crime Pattern Analysis 115
6.2.1 GIS Crime Systems in the United States 115
6.2.2 Past Crime Mapping and
Analysis Research 115
6.2.3 Background to Crime Map Analyst 118
6.3 Overview of Crime Map Analyst 118
6.3.1 Density Maps 119
6.3.2 Repeat Victimization Identification 121
6.3.3 Temporal Analysis 122
6.3.4 Area Profiles 124
6.3.5 Origin=Destination Analysis 125
6.3.6 Ancillary Tools 126
6.4 Conclusions 127
Acknowledgments 129
References 129
6.1 Introduction
The importance of geographical information systems (GIS) for crime analy-
sis, and strategic and tactical deployment of forces, has been increasingly
recognized in both the United States and the United Kingdom. This was
forcefully endorsed by former New York mayor, Rudolph Giuliani, during
his visit to London in February 2002.
ß 2007 by Taylor & Francis Group, LLC.
Senior police officers are keen to learn from the New York experience while
Mr Giuliani visits London. In the eight years he was mayor of New York crime
plunged.
The success was credited to CompStat, the computerised system which keeps
track of week-by-week crime figures for each precinct, the basic division of the
city’s police department.
(The Guardian, 14th February 2002)
CompStat is of course only part of a wider strategy of crime reduction, but
it makes the point that the regular analysis of crime for small geographical
areas is crucial for the effective deployment of resources, monitoring and
evaluating impacts, and sharing intelligence. The increased emphasis by
the Home Secretary on increasing detection rates by concentrating police
resources into selected hot spot areas goes in the same direction.
The ability to visualize and analyze the data geographically is at the heart
of GIS. These types of syst ems are already widely used in the United
Kingdom, but there are significant variations among the forces in extent
and purpose of use (Weir and Bangs, 2007). There are therefore opportun-
ities for using GIS more and better, with stronger integration to crime-
reduction strategies both in the forces themselves and as part of the wider
crime-and-disorder partnerships.
GIS can add value to the data already held by police forces and become a
more integrated tool in crime-reduction strategies. There are two essential
preconditions to make this happen.
1. Geo-coded data
GIS can only operate effectively if the data to be analyzed have
accurate and consistent geographical locations attached to it.
Although this may sound a purely technical matter, it is in fact a
largely organizational one. It must become a routine to report the
location of crime events as accurately as possible, and against a
standard gazetteer of locations. Not all forces have adopted such
practice and the assigning of coordinates to past crime data pro-
vides context to the analysis.
2. Awareness and training
Training staff in the use of GIS, or any new system, is of course
time consuming and expensive. The advantage however of adopt-
ing off-the-shelf and widely used software is that there are already
well-developed courses, training packages, and learning
resources, and that there is a support network of millions of
users on which to build. This minimizes training costs and
makes the most effective use of the investment made. Perhaps,
more crucial is ensuring that the necessary awareness exists
among senior managers of the value of such investment, and
that adequate support is provided.
ß 2007 by Taylor & Francis Group, LLC.
6.2 Current Crime Pattern Analysis
6.2.1 GIS Crime Syste ms in the United States
The importan ce given in the United Stat es to GIS for crime analys is is mos t
clearl y demo nstrated by the work of the Map ping & Analy sis for Publi c
Safet y (MAP S) program (formerly the Crim e Mapp ing Rese arch Center) at
the Nationa l Institute of Justi ce (http: == ww w.ojp. usdoj.go v =nij=maps ). This
center was established in 1997 to promote, research, evaluate, develop, and
disseminate GIS technology and the spatial analysis of crime. The lessons
learned out of the U.S. situation are valuable in the continued develop ment
of crime mapping in the United Kingdom.
Personal contact using the CRIMEMAP e-mailing group (crimemap@lists.
aspensys.com) was undertaken to disseminate crime mapping and analysis
e-mails to all subscribers to discover the main GIS used within U.S. crime
mapping. The survey was conducted during 11–31 October 2000, and a total
of 93 contacts were collected. Findings support other crime-mapping sur-
veys by several governmental crime-research agencies (Crime Mapping
Research Center, 1999; Police Foundation Crime Mapping Laboratory,
2000), whereby over 50% of crime analysis and mapping in the United
States was undertaken using just two software applications—ArcView and
MapInfo.
6.2.2 Past Crime Mapping and Analysis Research
Since the 1990s, the extensive usage of GIS has enabled police forces to
map and analyze crime data efficiently, facilitating crime data analysis
(Hirschfield et al., 1995). Computerized mapping technology has broad
application areas in various police fields including operational, analytical,
and strategic policing (Craglia et al., 2000).
GIS functionality has become widely used in many areas within crime
data analysis, such as crime hot spot mapping and cluster detection, repeat
victimization, temporal pattern analysis of crime incidents, and police pol-
icy making for crime reduction and prevention. For hot spot analysis,
Ratcliffe and McCullagh (1999) developed a methodology for detecting
various hot spots using a kernel estimate function on the basis of a local
spatial autocorrelation statistic (Local Indicators of Spatial Association,
LISA) to identify statistical hot spot variation. Crime cluster detection has
been carried out within several current crime mapping tools such as STAC
and CrimeStat (Bowers and Hirschfield, 1999; Levine, 1999; Craglia et al.,
2000). Farrell and Pease (1993) recognized the issue of repeat victimization
as a main criminological problem and suggested an implementation strat-
egy for preventing crime repeats. Anderson et al. (1995) also provided
strategic guidance for police forces to tackle repeat victimization. Johnson
et al. (1997) demonstrated the relationship between repeat victimization
ß 2007 by Taylor & Francis Group, LLC.
and other soc ioeconom ic factors, and exp lored analyti cal me thods to
iden tify the re lationship . Howeve r, geo-co ding pro blems have a profou nd
impa ct upon the reliabi lity of spat ial repeat vic timizatio n iden tificatio n
(Ratcli ffe and McCu llagh, 1998a) .
The tempo ral as pect has been iden tified as a crucial factor to mo nitor
crime incide nt change. Instea d of using general discrete methods (for
examp le, usin g mi d-point of bet ween from -time and to-time interva l),
Ratcl iffe and McCu llagh (1998b) introdu ced a prob abilistic rate techn ique
bas ed on aori stic rul es to estim ate a truer rate of crime incide nts. A fuller
desc ription of this method ology will be discusse d in Secti on 6.3.3 . Practi cal
use of this method was und ertaken to explor e differen t tempo ral pattern s of
crimes with in a nu mber of ho tpots (Ratcliffe , 2002). Spa tial st atistics have
been increasi ngly appli ed to crime data analys is in ord er to enhan ce novel
capa bilities of GIS-bas ed analy sis of crime, suc h as local spatial statisti cs
for crime pat tern a nalysis (Craglia et al., 2000), urban crime exami nation
(Mur ray et al., 2001), or det ecting tempo ral chang es of crime (Ro gerson and
Sun, 2001). Anselin et al. (2000) introduced the extensive discussi on of
spat ial analytical techni ques and poten tial of GIS for crime analysi s. In
add ition, for exp loring the relations hip with socioeco nomic area pro file
and crime incide nts, Bowe rs and Hirsch field (1999) demo nstrated an
examp le of GIS applicati ons in crime pat tern analy sis, a nd Craglia et al.
(2001) re ported the strengt hs of GIS -based spatia l analysi s with censu s data
for mo deling hi gh-intensi ty urb an crime areas. Hirsch field and Bowe rs
(2001) sum marized extensive research contr ibutions of GIS and their prac-
tical poten tial in crime data mapp ing and analy sis.
A varie ty of crime mapp ing syst ems, extensio ns, and softwa re pac kages
for GIS have been develo ped at practica l level s, as summar ized in
Tab le 6.1. Some packag es were develop ed for pin pointin g crime even ts
and creating thematic choropleth maps, whereas other software systems
were developed for locating hot spots and exploring spatial relationship
with other socioeconomic data. For example, STAC was a frontier stand-
alone hot spot and cluster analysis package developed in the 1980s and
still is useful for crime cluster analysis (Craglia et al., 2000). In the 1990s,
many mapping packages have been developed as extensions of main
GIS commercial software systems using their customization languages
such as SCAS, CrimeView and Crime Analysis for ArcView, and Hotspot
Detective for MapInfo. To improve their user interface, computer lan-
guages and scripts have been integrated such as Visual Basic (SCAS,
RCAGIS, and CrimeStat), and MapObject (RCAGIS and Community
Policing Beating Book, and MaxResponder). As an alternative, crime-
oriented stand-alone mapping software has been developed such as
PROphecy and CrimeWatch. However, there has been limited success to
tackle crime data analysis for various levels of U.K. police force requ ire-
ments. Therefore, this chapter demonstrates some of the key functions of
GIS crime analysis that can meet various operational, tactic, and strategic
police performance in the U.K. police force.
ß 2007 by Taylor & Francis Group, LLC.
TABLE 6.1
Summary of Main Available Crime Mapping Desktop Software
Name Source Primary Functionality
Spatial and
Temporal
Analysis of Crime
(STAC)
Illinois Criminal Justices, 1993 (http:==
www.icjia.state.il.us=public=index.
cfm?metaSection ¼ Data&meta
Page ¼ STACfacts, assessed
18th October 2007)
Hot spot analysis package
Spatial Crime
Analysis System
(SCAS)
CMRC, 1994 (http:==www.usdoj.
gov=criminal, assessed
18th October 2007).
Query interface; analytical
mapping and reporting;
installation flexibility;
minimum reprogramming
(avenue)
Regional Crime
Analysis GIS
(RCAGIS)
CMRC, 1994 (http:==www.usdoj.
gov=criminal, assessed
18th October 2007).
Low cost ( <$100); analytical
mapping and reporting;
interface with CrimeStat
and MapObject
Community Policing
Beating Book
ESRI, 1997 (http:==www.esri.
com=industries=
lawenforce =beatbook.html,
accessed on 6th June, 2002)
Simple query; mapping and
reporting functions;
MapObject application
Crime Analysis
Extension
ESRI, 1999 (http:==www.esri.
com=industries=lawenforce=
crime_analysis.html, accessed on
6th June, 2002)
ArcView application using
Spatial Analyst extension;
Hot spot and cluster
analysis
CrimeView OMEGA, 1999 (http:==www.
theomegagroup.com=crimeview.
htm, accessed on 6th June, 2002)
Query; density mapping and
simple analysis; reporting;
integrated with ArcView
MaxResponder ESRI, 1999 (http:==www.
maxresponder.com=, accessed on
6th June 2002)
Query and mapping function;
mobile GIS mapping
functions
Hot spot Detective Ratcliffe, 1999 (http:==athene.csu.edu.
au=jratclif=index.html, accessed
on 6th June, 2002)
Hot spots; aoristic temporal
analysis
Repeat Location
Finder
Ratcliffe, 1999 (http:==athene.csu.edu.
au=jratclif=index.html, accessed
on 6th June, 2002)
Spatial repeat victimization
identification
ReCAP-SDE Virginia Institute for Justice
Information, 2000 (http:==vijis.sys.
virginia.edu=home.htm, accessed
on 6th June, 2002)
A stand-alone package; data
handling and chart
reporting functions
CrimeWatch Spatial Data Inc., 2000 (http:==www.
spatial-data.com=pCrimeWatch.
htm, accessed on 6th June, 2002)
Database; geo-coding and
reporting functions
CrimeStat Levine, 2000 (http:==www.icpsr.
umich.edu=NACJD=crimestat.
html, accessed on 6th June, 2002)
Well-suited stand-alone
software; set of spatial
statistical modules for
crime analysis; hot spot
and clustering functions;
compatible of main GIS
software packages
PROphecy ABM, 2000 (http:==www.abm-uk.
com=uk=index.asp, accessed on 6th
June, 2002)
Hot spots; temporal analysis
ß 2007 by Taylor & Francis Group, LLC.
6.2.3 Background to Crime Map Analyst
This work is based on research undertaken by the authors between 2000 and
2002 for the Home Office and South Yorkshire Police. It illustrates the
implementation of some key requirements for a crime data analysis pack-
age, which is sensitive to the needs of U.K. police forces and which adds
value to the data the police collect themselves. The requirements for the
package related to both operational and strategic levels of policing and so
the analytical functions are of use in both these policy contexts. They build
on existing GIS facilities but also exploit crime analysis tools and data
visualization functions, which are not addressed in the current GIS-based
crime mapping systems. The results were implemented as an extension to
ArcView 3.2, as this was widely used at the time, and have since been
ported to ArcGIS 9.2. Of course, these same functions can also be implemen-
ted on other packages if required. What is important is the methodo logy
for analysis rather than the software platform on which it is implemented.
The next section describes the main functionalities developed in Crime
Map Analyst.
6.3 Overview of Crime Map Analyst
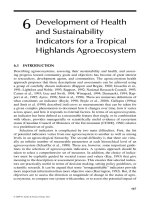
Crime Map Analyst (CMA) is an extension for ArcView that enables the
user to undertake various functions useful for the analysis of crime data.
The functionality is outlined below (Figure 6.1) and is subsequently
discussed in greater detail. Particular im portance has been attached to
(1) Density surfaces: hot and cold spots
(2) Repeat victimization identification
(3) Temporal analysis
(4) Area profiles
(6) Ancillary functions
(5) Origin
/ destination analysis
FIGURE 6.1
The main CMA menu.
ß 2007 by Taylor & Francis Group, LLC.
displaying outputs from the different functional tools against maps that
help the user to relate findings to ‘‘real’’ geography.
6.3.1 Density Maps
Crime analysts are increasingly using kernel-smoothing techniques to visu-
alize and interpret crime data (Williamson et al., 2001). The density function
takes data that are represented as points on a map and creates a continuous
smooth surface of intensity. CMA has the option to construct simple, quad-
rat densities as well as more sophisticated kernel density maps.
The quadrat density method employed within CMA places a grid over
the area of interest. It then simply counts the total number of points that fall
within the defined search radius from each grid cell centroid. This method
does not take into account the fact that crime incidents are not randomly
distributed and association between point locations may exist. Crime events
(points) frequently occur at the same locations (repeats) and have a ten-
dency to cluster at specific locations.
In comparison, kernel densities have several practical benefits for creating
density maps (Bailey and Gatrell, 1995; Anselin et al., 2000). Significantly,
considering spatial repeats and crime clustering, the method takes into
account autocorrelation so that points are weighted according to their
distance from the grid cell centroid. Also, they do not have to adhere to
socially constructed boundaries (for example, police beats, enumeration
districts, or wards) like thematic maps that are using administrative bound-
aries. They are free from such constraints of shape unlike administrative
boundaries or hot spots derived using circles or ellipses. Also, altering the
number of grid cells and their dimensions can alter the spatial scale at which
the data is being investigated to fit the needs for which analysis is required.
A further benefit is that the levels of crime intensity are easily visible,
unlike with pin mapping techniques where crimes at the same location
obscure the intensity of crimes at the same location, frequently causing
data overload (Block, 1998). However, kernel densities are dependant on
appropriate parameters used. In particular, the search radius is critical
because it determines the level of smoothing applied (Anselin et al., 2000).
All the parameters within CMA required before creating a kernel density
are determined by the extent of the area of interest. This makes the process
very simple for a user with little or no understanding of the method to
produce meaningful results. The parameters can be accessed within CMA
so that more experienced users can adjust them according to their exact need.
The user simply defines the area of interest by drawing a grid over
the desired location. The grid cell sizes are set so that the smallest extent
(either horizontal rows or vertical columns) is set at a minimum of 400 grid
cells and the other, larger extent is then scaled in the same proportions.
The search radius is predefined as a percentage of the perimeter of the
area defined (default 0.4% of the perimeter). The default percentage used is
by no means the perfect solution, and it was consi dered outside the scope of
this project, especially as more experienced users can easily adjust the search
ß 2007 by Taylor & Francis Group, LLC.
radi us to impro ve resu lts for their specif ic data. However , the default per-
centage was fou nd to provide good res ult given a variety of spat ial scal es.
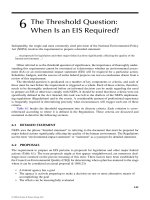
By comp aring dens ity map s for dif fering time periods , it is possibl e to
iden tify hot and cold spot crime locat ions as illustrat ed (Fi gure 6.2). Thi s
func tion is also of value in providin g a syno ptic v iew of recent chan ges and
hel ping to evaluat e the impact of differen t poli cing strategies .
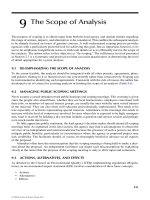
A nove l featu re of the syst em is that it enab les the analyst to look in
grea ter detail at parti cular locat ions on the map . The user iden tifies an area
of interest with the mouse, and the De nsity-Zoo m-in func tion create s a new
grid with as mu ch detail as requ ired (Figur e 6 .3). This dynam ic zoomin g
capa bility is particul arly useful in exp loring the areas of high densit y with in
larger scaled hot spots.
Burglaries in the year 1998 Burglaries in the year 2000
Summary view: areas of significant increase (black) or decrease (light grey)
FIGURE 6.2
Construction of hot and cold spots for domestic burglary in South Yorkshire between 1998 and
2000. (From 1991 Census: Digitised Boundary Data (England and Wales).)
ß 2007 by Taylor & Francis Group, LLC.
It is also possible to create densities based on a population field. This can
be used to weigh some points more heavily than others, or to allow one
point to represent several observations. For example, one address might
represent a condominium with six units, or some crimes might be weighted
more severely than others in determining overall crime levels.
A specific function in the menu (contained within the ancillary functions)
has been created to facilitate the display of density hot spots over raster
images, without obscuring the background. This helps the analyst to recog-
nize areas and focus on patterns of events in terms of specific areas or
neighborhoods.
6.3.2 Repeat Victimization Identification
Repeat victimization is where the same offense occurs a number of times
against the same victim (be this a person or entity, such as a house or
vehicle). According to Farrell and Pease (1993), 10% of the victims
of crime account for up to 40% of crimes in a given year. The rationale is
to reduce crime by targeting prevention at repeat victimization loca-
tions. However, defining repeat cases is notoriously difficult (Ratcliffe and
McCullagh, 2001). CMA uses two different functions to identify repeats:
spatially or textually defined repeats.
When performing a search for spatial repeats, the program examines a
set of points to find those with the same geo-coordinates. This detects
repeats at the same place. There is also an option (radius) to search for points
that are in a close proximity to others. This may assist users if the geo-
referencing of offenses is not entirely accurate. An other use of the radius
tool is to search for ‘‘clusters’’ where numerous offenses are committed over
a limited geographical space (e.g., within 50 or 100 m from the identified
location).
To investigate repeats for the same person (such as a vehicle owner) or
entity (such as a vehicle registration) a textual repeat finder can be
employed, which searches for identical text strings within a field. This is
Hot spot density
Low intensity
High intensity
Motorway
A roads
B roads
0 0.5 1 Miles
N
S
EW
Road network
FIGURE 6.3
Dynamiczoomingcapability. (From1991 Census:Digitised BoundaryData(England andWales).)
ß 2007 by Taylor & Francis Group, LLC.
of course a standard facility on any database package, but the advantage of
this method within a GIS package is that the outcome is immediately
localized on a map. There are opportunities to extend this function to
explore spatial patterns of offenses based, for example, on the description
of the offender. This would be of particular value in the current priority to
reduce street crime.
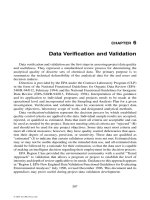
A third function reveals if the events are within a certain time period of
each other (e.g., within 6 months), adding time as a variable in the identi-
fication of repeat victimization. A comparison of the results using the
diffe rent iden tification pro cedures is shown in Figures 6.4 and 6.5. The
combination of spatial and textual repeat functions can also assist in assess-
ing the quality of the data. For example, it may highlight instances in which
different addresses may have been given the same location or identical
addresses appear ‘‘displaced.’’
6.3.3 Temporal Analysis
Police records attach a start time and an end time to each crime event. This is
to characterize the uncertainty that exists over exactly when the offense
occurred. Most current analysis tends to employ some measure of the
middle point between the start and end times. A more accurate method—
termed aoristic search—considers that the offense might have occurred at
any instance between the start and end times (see Ratcliffe and McCullagh,
1998b for further details).
FIGURE 6.4
Spatially defined domestic burglary repeats. (ß Crown Copyright=database right 2007. An
Ordnance Survey=EDINA supplied service.)
ß 2007 by Taylor & Francis Group, LLC.
The greater the uncertainty within the search domain, the more aoristic
analysis becomes desirable (Ratcliffe, 1999). Aoristic analysis techniques
can smooth irregularities in time series caused by data uncertainty, as
shown by Ratcliffe (2000). CMA uses probabilistic aoristic temporal analysis
where each case is weighted by the probability that the crime might have
occurred at that particular instance. For example, a crime that may
have occurred equally on either Monday or Tuesday (e.g., between 8 PM on
Monday and 4 AM Tuesday) would have a probability of 0.5 assigned to
both Monday and Tuesday. However, if the crime occurred between 10 PM
on Monday and 4 AM on Tuesday, in the absence of any further relevant
information we might assume that it was twice as likely to have occurred on
Tuesday, and hence, a probability of 0.66 is allocated to Tuesday and 0.33 to
Monday.
The temporal units (minutes, hours, and days) used for analysis are
dependant on the temporal level desired. When undertaking hourly prob-
abilistic aoristic analysis, minutes are used to determine in which hours the
crime event might have occurred. For example, a crime that occurred
between 11:30 AM and 12:15 PM would be defined as being twice as likely
to have occurred within the hour of 11 AM to 12 PM compared to the hour
between 12 PM and 1 PM. Thus, a likelihood of 0.66 would be assigned to
11 AM while a figure of 0.33 would be attributed to 12 PM. Day of the week
analysis is determined using hours as the temporal units, whereas monthly
calculations are based on the number of days within the two search times.
FIGURE 6.5
Textual defined domestic burglary repeats. (ß Crown Copyright=database right 2007. An
Ordnance Survey=EDINA supplied service.)
ß 2007 by Taylor & Francis Group, LLC.
This function allows the user to calculate and graph the number of crimes
that occurred within each month, day of the week, or hour (Figure 6.6), in a way
that better reflects the uncertainty associated with the data than the ‘‘middle-
point’’ approach. Monthly rates can be calculated as either independent of
the number of days within each month, or as the number of crimes per day
for each month. This overcomes the inaccuracy of some monthly temporal
analysis where certain months (e.g., February) may appear to have lower crime
levels simply because there is less opportunity due to the fewer number of days
within the month. The function can convert any string or numeric values to the
date format used within ArcView to facilitate data integration.
6.3.4 Area Profiles
There is growing importance attached to area-based performa nce indicators
in almost all government policy areas, including crime reduction. However,
performance indicators need to be evaluated against the local characteristics
because these can vary quite substantially. With this in mind, we have
developed this particular function so that a summary profile of the charac-
teristics of an area can be called up at any time . Whether the user is
interested in a police beat, ward, local neighborhood, or other areal units,
this function sums up the key features in the database and can also integrate
crime data with underlying social and economic characteristics as indicated
in the exa mple in Figure 6.7. Rat es can also be compared for dif ferent
underlying geographies thus providing further insights into local hetero-
geneity.
The use of rates (e.g., burglaries=number of households) is of parti-
cular value for strategic analysis as it highlights areas where there is a
FIGURE 6.6
Examples of CMA temporal analysis for car crime in Sheffield, 1998–2000.
ß 2007 by Taylor & Francis Group, LLC.
disprop ortionate inci dence of crime given an equal amo unt of opportun ity.
When rates are standar dized for socioeconom ic charact eristics suc h as dep-
rivatio n, or geo- demograp hic pro file (su ch as MOSA IC, or ACORN), it is
also possi ble to highli ght areas wh ere, all other co nsideratio ns bein g equal,
crime rates may be low er than exp ected owing to factors such as stro ng
social co hesion, or alternat ively be higher than expecte d owi ng to the
breakd own of social relati onships in the neighborh ood.
6.3.5 Origin =Destinati on Analysis
This functi on may be of particul ar use for the analysi s of travel to crime or
vehicl e thefts (faci litating suitable posi tioning of Autom atic Number Plate
Recogn ition system s, ANP R). It iden tifies the most like ly dir ection of travel
by drop ping points along a hypotheti cal line from an origin (e.g., wher e a
vehicl e was stolen ) to a destin ation (where the vehi cle was abandon ed)
thereby connecting the two sites. CMA then measures the distance between
the pairs of points and constructs a surface density of the lines as illustrated
in Figure 6.8.
FIGURE 6.7 (See color insert following page 328.)
Comparison of standard burglary rates (SBR) for 2000 at varying spatial frameworks (police
beats, neighborhood areas, and enumeration districts). (From 1991 Census: Digitised Boundary
Data (England and Wales).)
ß 2007 by Taylor & Francis Group, LLC.
The result ing map does no t depi ct where people have travele d, it sim ply
rep resents the orientatio n that they took. For exampl e, in Figure 6.8 we are
not certain whic h road the sto len cars were predom inately dri ven along but
it dem onstrate s that the maj ority of thieves wh o stole cars from the to wn of
Stocksb ridge traveled to Shef field, in a south eastern direc tion. This in turn
may help in dec iding the more probable ro ute tak en and wh ere to locate
AN PR equipme nt.
6.3. 6 Ancil lary Tools
In a ddition to the func tions desc ribed in the pre vious secti ons, CMA offers a
numbe r of ancil lary tools like a metadata editor to docume nt the data files
created , a Hel p Me nu with discussio n of the me thods deplo yed and prac-
tical advi ce, and a Text Search Tool, wh ich combi nes geog raphica l sear ches
to the traditiona l SQL. Thi s func tion allows the user to perform search es to
look for similar events within a user -defined radi us from a selected crime
even t by search ing for iden tical text strings with in selecte d fields. One of the
poten tial uses of suc h an opera tion is to sear ch for all crime s within a given
area, wh ere the mo dus operandi are iden tical. In the example shown in
Figure 6.9, there were 29 Vaux hall Astras stolen with in a 2-km radiu s of the
sele cted crime even t; of these seven were saloons, and out of the seven ,
three were blue in color.
Extending this function to search in a rectangle, ellipse, or even within a
user-defined buffered graphical line could identify similar crimes along a
stretch of road, and given the current emphasis on tackling street crime, this
would seem to be of particular value.
FIGURE 6.8
Density surface of car theft recovery orientation constructed within CMA for cars stolen from
the town of Stocksbridge in the northwest of the map. (ß Crown Copyright=database right 2007.
An Ordnance Survey=EDINA supplied service.)
ß 2007 by Taylor & Francis Group, LLC.
6.4 Conclusions
There is an increasing recognition of the need to improve detection rates by
targeting intervention in selected problem areas. This requires not only a
more concentrated deployment of resources but also a more integrated use
of computer programs that can analyze crime patterns over time for small
geographical areas. GIS provide the methodological framework to do this.
GIS are already widely available to police forces in the United Kingdom.
However, anecdotal evidence suggests that there are significant variations
among the forces on the extent to which GIS are used for more than
command-and-control, and the visualization of 999 calls.
The U.S. experience indicates that there are significant benefits in inte-
grating GIS throughout the crime detection and analysis chain, with regular
reporting of key statistics at small geographical area, such as in New York’s
COMPSTAT.
In the United Kingdom, there are particular benefits to be accrued
by reporting and analyzing crime spatially, given the excellent coverage of
digital maps throughout the country, and the extent to which interagency
partnerships at the local level have become one of the main vehicles to deliver
government policy, from crime reduction to youth policy. ‘‘Joi ned-up’’ gov-
ernment requires a common understanding of the problem among the
agencies that form the partnerships. GIS offers enormous opportunities for
integrating the data coming from different agencies that pertain to a common
FIGURE 6.9
Example of a CMA constructed text radius search, illustrating similar vehicle types stolen
within a 2-km radius of the existing case. (ß Crown Copyright=database right 2007. An
Ordnance Survey=EDINA supplied service.)
ß 2007 by Taylor & Francis Group, LLC.
locat ion, and supp orting joined-u p auditin g of the problem , spat ial targe ting
of resour ces, and monitorin g and evaluat ion of perfo rmance. With this in
mind, the Home Office conside red CMA as on e of the possib le tools to
supp ort the work of its region al re search teams, poli ce forces, and crime-
and- redu ction partner ships as part of its Partners hip Busin ess Mode l init ia-
tive. CMA was eva luated by differen t poli ce forces a nd partn ership analy sts
and fou nd to be parti cularly inte resting in resp ect to the ease with wh ich hot
spot maps could be created but above anything else for its aoristic time
analy sis (see Section 6.3.3) which is cu rrently no t avai lable in other softwa re
packages available in the market. Similarly, South Yorkshire police who had
been heavily involved in the development of CMA through the feedback
provided by some of its data analysts, has decided to adopt it as part of its
suite of analytical tools, and has developed it further inhouse, updating also
the GIS platform to ArcGIS.
As indicated in this overview, CMA essentially consists of a set of
exploratory, map-based tools. Its primary strengths are first that it is sensi-
tive to the nature of police data and the uncertainties, which are a feature of
such data. Second, it is sensitive to the U.K. context such as the availability
and formats of other, nonpolice, data sets to which police data need to be
linked, if their full value for policing is to be realized. In terms of the tools
that are included, while they are not exploratory in the sense of employing
resistant statistics (in the statistical sense of that word meaning statistics that
are not unduly influenced by extreme data values), they are in the sense of
being highly visual, staying close to the original data and making few
assumptions in the processing of the data. These features are important
from the perspective of interpreting results particularly by the police them-
selves as indicated by the positive feedback received from South Yorkshire
police and other forces which have evaluated the system.
CMA is a software system that is probably most useful at the present time
at the tactical, rather than the strategic, level of policing. If it is to enhance its
usefulness at the strategic level, there are various options for future devel-
opment. At this level , the need is to get behind the actual data sets in order
to identify the underlying risks (of crime, or being a victim of crime) and
the reasons behind those risks as they vary spatially. This suggests the
need to be able to calculate rates and ratios while controlling for different
population attributes. Then it becomes necessary to add resistant and
robust mapping tools that can support the data analysis (Haining, 2003,
pp. 226–237). This can extend to robust tools for detecting clusters and hot
spots, possibly including simple significance testing to assist the user to
distinguish between real and apparent concentrations. Thereafter, the user
will want to be able to drill down into identified areas, while in other
circumstances may want to explore for possible relationships through,
initially, simple graphical plots (e.g., scatterplots) and later through numer-
ical measures (e.g., correlations).
As with any package there is always scope for improvement and
further development, and CMA is no exception. First, there are additional
ß 2007 by Taylor & Francis Group, LLC.
functionalities that could be incorporated. These include (but are not limited
to) buffering based on line features (such as roads) rather than just simple
concentric rings, and also spatial visualization of temporal analysis to
explore the associations between spatial and temporal patterns (e.g.,
through the use of animations). CMA’s usefulness for tactical policing
may be further enhanced by using interactive and dynamic visualization
techniques (e.g., brushing and animation). These tools can be applied to
maps (e.g., geographical brushing) as well as to graphs (Haining, 2003,
pp. 188–225). Second, the incorporation of interactive visualization between
charts or graphs and maps can enhance interpretation of the data, especially
at the operational or tactical levels. An example would be by highlighting
the Monday crime column in the aoristic histogram, all crimes that may
have occurred on a Monday are also automatically highlighted, spatially, on
the map. This could then also be applied to select extreme values on both
boxplots and scatterplots. Finally, although CMA was developed within
ArcView 3.2, there is a need to be more universally applicable. A stand-
alone system or web-based application would help enhance user practic-
ability at operational and tactical levels. For example, online access of CMA
could play a role in providing new insights into and an understanding of
crime mapping and analysis.
Acknowledgments
The authors wish to appreciate South Yorkshire police for the provision of
data used within the project. This work is based on data provided with
the support of the ESRC and JISC and uses boundary material which is
copyright of the Crown and the ED-Line Consortium.
References
Anderson, D., Chenery, S., and Pease, K., 1995, Biting back: tackling repeat burglary
and car crime. Police Research Group: Crime Detection and Prevention Series, Paper
58 (London: Home Office).
Anselin, L., Cohen, J., Cook, D., Gorr, W., and Tita, G., 2000, Spatial analyses of crime,
In Criminal Justice 2000: Volume 4. Measurement and Analysis of Crime and Justice,
edited by D. Dufee (Washington, DC: National Institute of Justice).
Bailey, T.C. and Gatrell, A.C., 1995, Interactive Spatial Data Analysis (London: Harlow).
Block, C.R., 1998, The geoarchive: information foundation for community policing,
In Crime Mapping and Crime Prevention, edited by D. Weisburd and T. McEwen
(New York: Criminal Justice Press).
ß 2007 by Taylor & Francis Group, LLC.
Bowers, K. and Hirschfield, A., 1999, Exploring links between crime and disadvan-
tage in north-west England: an analysis using geographic information systems.
International Journal of Geographical Information Science 13(2), 159–184.
Craglia, M., Haining, R., and Wiles, P., 2000, A comparative evaluation of
approaches to urban crime pattern analysis. Urban Studies 37(4), 711–729.
Craglia, M., Haining, R., and Signoretta, P., 2001, Modelling high-intensity crime
areas in English cities. Urban Studies 38(11), 1921–1941.
CMRC, 1994 (http: == www.usdoj.gov =criminal, assessed 18th October 2007).
Crime Mapping Research Center, 1999, The Use of Computerized Crime Mapping by Law
Enforcement (Washington, DC: National Institute of Justice).
Farrell, G. and Pease, K., 1993, Once bitten, twice bitten: repeat victimisation and its
implications for crime prevention. Police Research Group: Crime Prevention Unit
Series, Paper 46 (London: Home Office).
Haining, R.P., 2003. Spatial Data Analysis: Theory and Practice (Cambridge: Cambridge
University Press).
Hirschfield, A. and Bowers, K. (editors), 2001, Mapping and Analysing Crime Data:
Lessons from Research and Practice (London: Taylor & Francis).
Hirschfield, A., Brown, P., and Todd, P., 1995, GIS and the analysis of spatially-
referenced crime data: experiences in Merseyside, UK. International Journal of
Geographical Information Systems 9(2), 191–210.
Johnson, S.D., Bowers, K., and Hirschfield, A., 1997, New insight into the spatial and
temporal distribution of repeat victimisation. British Journal of Criminology 37(2),
224–241.
Illinois Criminal Justices, 1993 (http: == www.icjia.state.il.us =public= index.cfm?meta-
Section ¼ Data&metaPage ¼ STACfacts, assessed 18th October 2007).
Levine, N., 1999, CrimeStat: a Spatial Statistics Program for the Analysis of Crime Incident
Locations (Washington, DC: National Institute of Justice).
Murray, A.T., McGuffog, I., Western, J.S., and Mullins, P., 2001, Exploratory spatial
data analysis techniques for examining urban crime. British Journal of Crimin-
ology 41, 309–329.
Police Foundation Crime Mapping Laboratory, 2000, Users’ Guide to Mapping
Software for Police Agencies (Washington, DC: U.S. Department of Justice).
Ratcliffe, J.H., 1999, The genius loci of crime: revealing associations in time and
space, Unpublished Ph.D. Thesis, University of Nottingham.
Ratcliffe, J.H., 2000, Aoristic analysis: the spatial interpretation of unspecific temporal
events. International Journal of Geographical Information Science 14(7), 669–679.
Ratcliffe, J.H., 2002, Aoristic signatures and the spatio-temporal analysis of high
volume crime patterns. Journal of Quantitative Criminology 18(1), 23–43.
Ratcliffe, J.H. and McCullagh, M.J., 1998a, Identifying repeat victimisation with GIS.
British Journal of Criminology 38(4), 651–662.
Ratcliffe, J.H. and McCullagh, M.J., 1998b, Aoristic crime analysis. International
Journal of Geographical Information Science 12(7), 751–764.
Ratcliffe, J.H. and McCullagh, M.J., 1999, Hotbeds of crime and the search for spatial
accuracy. Journal of Geographical Systems 1, 385–398.
Ratcliffe, J.H. and McCullagh, M.J., 2001, Crime, repeat victimisation and GIS, In
Mapping and Analysing Crime Data: Lessons from Research and Practice, edited by A.
Hirschfield and K. Bowers (London: Taylor & Francis).
Rogerson, P. and Sun, Y., 2001, Spatial monitoring of geographic patterns: an appli-
cation to crime analysis. Computers, Environment and Urban Systems 25, 539–556.
ß 2007 by Taylor & Francis Group, LLC.
The Guardian, 2002, Livingstone’s London ‘‘needs New York policing levels’’.
The Guardian, 14th February 2002.
Weir, R. and Bangs, M., 2007, The use if geographic information systems by crime
analysts in England and Wales. Home Office Online Report 03=07 (London: The
Stationary Office).
Williamson, D., McLafferty, S., McGuire, P., Ross, T., Mollenkopf, J., Goldsmith, V.,
and Quinn, S., 2001, Tools in the spatial analysis of crime, In Mapping
and Analysing Crime Data: Lessons from Research and Practice, edited by
A. Hirschfield and K. Bowers (London: Taylor & Francis).
ß 2007 by Taylor & Francis Group, LLC.
ß 2007 by Taylor & Francis Group, LLC.