GIS and Evidence-Based Policy Making - Chapter 4 potx
Bạn đang xem bản rút gọn của tài liệu. Xem và tải ngay bản đầy đủ của tài liệu tại đây (608.04 KB, 26 trang )
Section II Methodological Advances
4
Routing out the Hot Spots: Toward Using
GIS and Crime-Place Principles to Examine
Criminal Damage to Bus Shelters
Andrew Newton
CONTENTS
4.1 Introduction 70
4.2 Theories Relating Crime to Its Environment 71
4.2.1 Crime on Public Transport 72
4.2.2 Crime Events 73
4.3 Characteristics of the Study Area 74
4.4 Data 75
4.4.1 Bus Shelter Damage 75
4.4.2 Census Variables and Geodemographi cs 75
4.4.3 Index of Local Conditions 76
4.4.4 Recorded Crime Data 76
4.5 Methodology 76
4.6 Findings and Discussion 78
4.7 Conclusions 84
Acknowledgments 85
References 85
Appendices 88
Appendix 4.1 SuperProfile Lifestyle Pen Pictures 88
Appendix 4.2 Resource Target Table for All Shelter Types 90
Appendix 4.3 Bivariate Correlation Results 91
Appendix 4.4A Merseyside Shelter Damage Jan–Dec 2000
(Cost per Month) 93
Appendix 4.4B Merseyside Shelter Damage 2000
(Cost per District per Month) 93
ß 2007 by Taylor & Francis Group, LLC.
4.1 Introduction
This chapter describes initial efforts to utilize GIS technology to cross-
reference crime data on one aspect of the public transport journey, bus
shelter damage, with information on soc io-demographic conditions, lan d
use, and infrastructure, covering the county of Merseyside in the North
West of England. GIS are used in conjunction with spatial statistical analysis
to explore the nature, manifestation, and patterns of damage to bus shelters.
Evidence of clustering is found, and one-fifth of all damage for a year is
shown to occur at 2.5% of all bus shelters. The findings also suggest that
particular neighborhood types, as well as certain characteristics of socio-
demographic and physical environments, are more likely to experience
shelter damage than others. This implies that bus shelter damage is related
in a systematic and predictable way to known attributes of a shelter’s
location. This prompts a discussion of the use of a combination of GIS and
other crime-mapping techniques developing our knowledge of the nature
and extent of, and the theoretical reasons underlying, crime and disorder on
public transport.
Public transport crime: what is it, and why does it exist? The police in
the United Kingdom do not record incidents of crime and disorder on
public transport systems as a separate category. This might imply that it is
an area not worthy of research and further attention. However, recent
findings by the then Department of the Environment, Transport and
the Regions (DETR, 1998) suggest that patronage on public transport
could be increased by 3% at peak and 10% at off-peak times if fear of
crime and disorder on public transport journeys were to be reduced. These
findings also highlight the importance of public transport availability as a
means of gaining access to health, leis ure, and other facilities, and thus
in making a contribution to mi nimize social exclusion. Any attempt to
reduce fear of crime on public transport requires a fuller understanding
of both the nature and extent of crime and disorder on public transport,
and environmental characteristics that may help to explain this crime. These
environmental features are likely to include land use, socio-demographic
influences, and features of the physical infrastructure, such as the layout of
buildings and the spaces bet ween them. The techniques used in this chapter
have been applied to other areas of crime research (Johnson et al., 1997;
Bowers and Hirschfield, 1999). Here, GIS are used in conjunction with
spatial statistical analysis to explore the nature, manifestation, and patterns
of crime and disorder on public transport, and, in particular, criminal
damage to bus shelters. In an attempt to offer some explanation for the
spatial patterns identified, it is necessary to draw upon theoretical perspec-
tives that relate crime in general to its environment. Some relevant theories
are now highlighted, before the methodology and findings of this research
are discussed in more detail.
ß 2007 by Taylor & Francis Group, LLC.
4.2 Theories Relating Crime to Its Environment
Environmental criminology is concerned with describing and explaining the
place and space of crime. Place of crime refers to the location of crimes, and
space of crime refers to spatial factors that may help to explain the location of
crime. The two core concerns of environmental criminology are to describe
and explain the distribution of criminal offences, and to describe and explain
the distribution of crime offenders (Bowers, 1999). This research concentrates
on the former concern, where crimes happen. The spatial distribution of
many offences (crime events) has been shown to be nonrandom (Eck and
Weisburd, 1995), and attention has focused on analyzing when and where
these crime events occur and the environmental factors that may help to
explain the occurrence of these incidents.
The three major theories of environmental criminology concerned with
the distribution of crime events are routine activities theory (Cohen and
Felson, 1979), the rational choice perspective (Cornish and Clarke, 1986),
and crime pattern theory (Bran tingham and Brantingham, 1993). Routine
activities theory states that, for a criminal event to occur there must be a
convergence in time and space of three factors: (a) the presence of a motiv-
ated offender, (b) the absence of a capable guardian, and (c) the presence of
a suitable target. Whether or not these elements converge or coincide is a
product of the routine activities (day-to-day movements) of potential vic-
tims and offenders.
A rational choice perspective suggests that offenders will choose their
targets and achieve their goals in a manner that can be explained. This has
its roots in economic theory and seeks to explain the way in which crimes
are distributed spatially by weighing up the potential cost of a crime (chance
of apprehension and cost of journey) against its possible benefits (potential
reward and ease to commit). The offender rationally chooses the situation
with the highest net outcome. The development of these two theories led to
a growing recognition that they were not necessarily mutually exclusive,
and a combination of both theories may help to explain crime events.
A significant development in this was the development of crime pattern
theory. This argues that ‘‘crime is an event that occurs when an individual
with some criminal readiness level encounters a suitable target in a situation
sufficient to activate that readiness potential’’ (Brantingham and Brantingham,
1993, p. 266).
This multidisciplinary approach to understanding crime contends that
crimes are patterned, but these patterns are only discernible when crimes
are viewed as etiologically complex, occurring within, and as a result of a
complex environment. Places are linked with desirable targets and the
situation or environment within which they are found, by focusing on
how places come to the attention of particular offenders.
Eck and Weisburd (1995) further emphasize the importance of place as
essential to crime pattern theory. They discuss how theories of place and
ß 2007 by Taylor & Francis Group, LLC.
crime have merged, in order to develop a crime event theory. Here, crime is
examined at the microscale (individual or the smallest levels of aggrega-
tion). Crime and its environment can be analyzed at different levels of
aggregation, from the individual (micro) to subpopulation (meso) to popu-
lation (macro) analysis. Given a set of high crime locations, a crime pattern
theorist may focus upon why and how offenders converge at these loca-
tions, whereas a routine activity theorist would be concerned with explain-
ing the movement of targets and the absence of possible guardians. Both
theorists may produce valid explanations, yet these may be supportive or
differ substantially, and even a combination of both may be useful in
explaining the crime.
One final important concept is that of crime attractors and crime generators
(Brantingham and Brantingham, 1995). A crime generator is an area that
attracts large numbers of people for reasons other than to commit a crime.
At particular times and places, the concentration of victims and offenders in
these locations produces an ‘‘unexpected’’ opportunity for the offender to
commit a crime. Shopping centers, sports stadiums, and public transport
interchanges are examples of this. Crime attractors are places that offenders
visit owing to knowledge of the area’s criminal opportunities, such as bars
and prostitution areas.
4.2.1 Crime on Public Transport
Applications resulting from the above theories include situational crime
prevention (Clarke, 1992), hot spot analysis (Buerger et al., 1995), opportunity
theory (Barlow, 1993), and targeted policing (McEwen and Taxman, 1995).
Although these have been applied to analyze crime and disorder in a number
of areas, including domestic and commercial burglary, assault, theft, and
robbery (Brown et al., 1998; Ratcliffe and McCullagh, 1998; Jupp et al., 2000),
there has been only a limited amount of research into crime and disorder on
public transport. Pearlstein and Wachs (1982) provide evidence that crime on
public buses is concentrated both in time and space. Levine et al. (1986) use
results from survey and observational data to demonstrate that bus crime
incidents tend to be high on routes passing through high crime areas. Block
and Davis (1996) examined street robbery data in Chicago and found that, in
low crime rate areas, crime was concentrated near rapid transi t rail stations.
LaVigne (1997) demonstrates how unusually low crime rates on the Metro,
subway system of Washington, D.C., can be explained by reference to some
aspect of its environment. A recent paper by Loukaitou-Sideris (1999) uses
empirical observations, mapping, and survey research to examine the con-
nection between criminal activity at bus stops and environmental factors . Ten
high crime bus stops were analyzed along with four low crime ‘‘control’’
stops. This empirical research indicates that environm ental attributes and
site conditions at bus stops do have an impact on crime levels, and further
research is required to better understand and measure this effect. It has been
demonstrated that the environm ent plays an important role in the location of
ß 2007 by Taylor & Francis Group, LLC.
crime events on public transport systems. There does not seem to have been
any attempts to produce a systematic evaluation of the nature, extent, and
causes of crime and disorder on public transport.
4.2.2 Crime Events
Central to the understanding of environmental criminological theories and
their appl ications is the concept of a crime event. An event is something that
occurs (Barlow, 1993) and the theories discussed above all depict this event
as a nonmoving event at a particular time and location (a static event). When
considering the public transport system, a ‘‘whole journey approach’ ’ is
needed (DETR, 1999). This incorporates all parts of the bus journey, including
walking from destination point to a bus stop, waiting at a bus stop, traveling
on a bus, transferring between stops, and traveling from bus stop to arrival
point. In terms of the bus journey, there are three possible scenarios in which
a crime event can occur:
.
Waiting at a bus, train, or tram stop (the waiting environment)
.
On board a mode of public transport (bus, train, and tram)
.
Transferring between stops on foot (departure point to stop,
between stops, stop to destination point)
The first and third situation s both describe a static crime event. The middle
possible scenario, however, implies the crime to be moving (nonstatic). Here
the fundamental question arises: Can the existing theories of environmental
criminology be applied or adapted to explain crime and disorder on public
transport? The growth of new technologies has allowed increased sophisti-
cation in the mapping and analysis of crime data, particul arly with the
evolution of GIS. The challenge is to map the location of a crime event
that occurs on a moving public transport vehicle. Ideally, a global position-
ing system would be used, but, at present, this is likely to prove expensive.
If a crime were reported along a section of a route, this would demarcate
where the crime event occurred (although not necessarily the movement of
the crime offender). This could then be captured in a GIS as a static event, at
a unique time period, together with information about crime events at stops
and stations, alongside information about the physical infrastructure, land
use, socio-demographic and other associated environmental features. This
would allow existing theories of crime and place to be tested and either
applied or adapted. The location of crime events could be represented as
points (at stops) and lines (sections of a route).
One major advantage of a GIS is its ability to combine data from different
sources, and for the spatial relations between these to be investigated. The use
of a GIS as a framework for analysis opens up the possi bility of carrying out
a systematic evaluation of the nature and extent of crime and disorder
on public transport and its juxtaposition with associated environmental
ß 2007 by Taylor & Francis Group, LLC.
characteristics. It is believed that this could lead to the development of an
evidence base that would enable management to make informed decisions
about resource targeting and policy formulation, and to monitor and evaluate
strategies that have been implemented. This research represents an initial
attempt to develop a systematic approach capable of evaluating the nature,
extent, and causes of crime on public transport. It was noted earlier that the
police in the United Kingdom do not record incidents of crime and disorder
on public transport as a separate category. Indeed, the lack of available data
that exists on the location of crime on buses restricts the spatial analysis that
can be performed, since crime is reported specific to an entire route and not
pinpointed to a precise location. Bus shelter damage is recorded to individual
stops with X–Y coordinates, and hence this research examines data on bus
shelter damage to pilot whether further research in this area is deemed
appropriate or not.
This study uses data obtained by Merseytravel, the Public Transport
Executive Group (PTEG) for Merseyside. It relates to bus shelter damage
on Merseyside for the year 2000. There were 3116 incidents of shelter
damage recorded, costing approximately £400,000 in repairing the damage.
In comparison, police records of shelter damage for this period consist of
only eight incidents. This highlights both the problem of underreporting
and the lack of available data on crime and disorder on public transport.
This study will address the following questions:
.
Is bus shelter damage concentrated at particular stops and areas?
.
Do particular neighborhoods suffer from raised levels of shelter
damage?
.
Do bus stops act as crime generators?
4.3 Characteristic s of the Study Area
Merseyside is a metropolitan county in the North West of England and is an
area where public transport is particularly important as it is estimated that
over 40% of the population do not have access to a car (1991 Census of
Population). Merseytravel is responsible for coordinating public transport
services on Merseyside and acts in partnership with bus and rail operators
to provide local services. The deregulation of bus services in 1986 resulted in
bus services being operated by a number of commercial companies. This
adds difficulties in acquiring reliable and consistent data concerning crime
and disorder on buses, since operators report information in a nonstandar-
dized fashio n. Maritime and Aviation Security Services (MASS) also opera te
on a private contract as a rapid response service dedicated to buses in
Merseyside. There are also two rail operators (First North West and Arriva)
who are responsible for local rail services, with security provided by the
British Transport Police (BTP) who police the rail network nationally.
ß 2007 by Taylor & Francis Group, LLC.
4.4 Da ta
The follow ing secti on desc ribes the da ta utili zed in this research , hig hlight-
ing its advant ages and limita tions.
4.4.1 Bus Shelter Damage
Data on the number of incidents and cost of damage to bus shelters, for a
12-month period (January–December 2000) were obtained from Merseytravel.
Data fields indicated the date of an incident, the cost of an incident, and the
type of incident. Incident types have been assigned to classification groups to
include smashed panels, graffiti, and other incidents of vandalism. Each bus
stop is uniquely referenced with an X and Y coordinate with an accuracy of
1 m. Bus stop type is also categorized to distinguish between bus posts
(concrete posts), conventional displays (CDs which are two metal posts hold-
ing a single glass or plastic panels displaying timetable information), and bus
shelters.
The maj or disadva ntage of this da ta set is that it on ly indic ates wh en an
incide nt is rep orted, not when it occurr ed. It is as sumed that events are
reporte d up to 24 h duri ng weekd ays and up to 62 h at weekends after the
event occurr ed. No indica tion of the time of day is given .
4.4.2 Census Variable s and Geodem ograph ics
From the 1991 Ce nsus of Popul ation, 3 5 selected variabl es were extra cted at
enume ration district (ED) level. The ED is the smal lest un it of the census for
England and Wales for wh ich data are availab le. Geodem ogr aphics is a
term used to describ e the constr uction of res identia l uni ts or neig hborho ods
from the Popul ation Census. Geodem ographi c class ificatio ns are based on
the use of cl uster analysis to assign each ED to a distr ict clust er or area type
based on variable s reflecting their demograp hy, soc ial and econo mic com-
positio n, and ho using typ e (Brow n, 1991). Thi s research uses the SuperP rofile
lifestyle cl assificati on, ba sed on data from the 1991 census and other descrip -
tive inform ation from other sources suc h as the elector al roll and consume r
surveys (for further information, refer to the work by Brown and Batey, 1994).
Britain’s 146,000 EDs were broken down into 160 SuperProfile neighborhood
types, a broader 40 target markets, and the most general classification
of 10 Sup erProfil e lifestyles (see App endix 4.1 for selected pen picture s of
lifestyles). Caution should be exercised in the interpretation of these des-
criptions which seek to highlight distinctive features of the lifestyles ba sed
on an index table comparing the cluster means of selected indicators with the
corresponding national mean value. Further, caution is required in compar-
ing data from 1999 with 2000 shelter damage data although no comparable
contemporary imformation on social, demographic, economic and housing
types existed at the time of writing. It is important to offset the limitations of
ß 2007 by Taylor & Francis Group, LLC.
suc h a clas sificatio n with the insigh ts they may prov ide for the analy sis of
crime and its relationshi p with the envi ronmen t.
4.4. 3 Index of Local Condi tions
This area-ba sed ind ex of depriva tion was produc ed at ED level usin g six
indicators of deprivation from the 1991 Population Census (Department of the
Environment, 1995). For the purposes of this research, the 2925 Merseyside
EDs were ranked by their index of local conditions (ILC) score and then
grouped into 10 groups (deciles), each containing 10% of the EDs. Other
indexes that could be utilized are the 1998 Index of Local Deprivation (ILD)
and the 2000 Index of Multiple Deprivation (IMD). The former of these at ED
level is also based on 1991 census variables, and the latter is only available at
ward level (http:== www.ndad.nationalarchives.gov.uk=CRDA=24=DS=1998=
1=4=quickref.html).
4.4.4 Recorded Crime Data
Data on a number of crime types for the period January–December 2000
were obtained from the Merseyside Police’s Integrated Criminal Justice
System (ICJS). This data is known to be subject to a degree of underreport-
ing (British Crime Survey, 2000). The categories obtained include criminal
damage, drugs-related, robbery, other violence, and all recorded crime.
Data were also acquired for the same period for calls to the police from
command-and-control records. These are service calls to the police, not
recorded levels of crime, and are subject to overreporting. They have been
used as an indication of demand from the public for police intervention or
‘‘formal social control’’ (Bowers and Hirschfield, 1999). The categories of
incident for which call records were provided are ‘‘disor der’’ and ‘‘juvenile
disturbance.’’ All these data sets were supplied aggregated to ward level, of
which there were 118 covering Merseyside in 1991.
4.5 Methodology
All the data were compiled in a GIS. Stop references were captured using
their X and Y coordinates, while all other data were transferred using the
point centroids of their respective census ED or ward level coverage. The GIS
intersect co mmand was used to join bus stops to the ED in which they were
situated. This method enables a profile to be constructed of damage at each
shelter with environmental variables (SuperProfile lifestyles, selected census
variables, % open space and % built areas, the ILC decile, and selected
recorded crime and command-and-control data). The GIS program used
was ArcView v3.1. This data was then exported into a statistical package
(SPSSv10.0) to enable the further statistical analysis of the spatial data.
ß 2007 by Taylor & Francis Group, LLC.
Anal ysis was undertake n to establish whether the point da ta rela ting to
damage to bus shelt ers displaye d evidenc e of clusteri ng. Crim eStat v1.1 was
the package used for this (http: == www.oj p.usdoj.g ov=nij =maps =). Both the
nearest neighbor index (NNI) and Ripley’s K-statistic were calculated. The
first of these measures tests if the distance to the average nearest neighbor is
significantly different from what would be expected by chance. If the NNI is
1, then the data is randomly distributed. If the NNI is less than 1, the data
shows evidence of clustering. An NNI result greater than 1 reveals evidence
of a uniform pattern in the data. A test statistic (the Z-score) was also
produced; the more negative the Z-score, the more confidence that can be
placed in the NNI result. It is not a test for complete spatial randomness and
only examines first-order or global distributions. The Ripley’s K-statistic
compares the number of points within any distance to an expected number
for a spatially random distribution. It provides deriv ative indices for spatial
autocorrelation and enables the morphology of points and their relationship
with neighboring points to be examined at the second, third, fourth, and nth
orders, thus enabling the identification of subregional patterns. In Crime-
Stat, these values are transformed into a square-root function, L(t), at 100
different distance bins. To reduce possible error, rectangular border correc -
tion for 10 simulation runs was applied.
ArcView was used for visual analysis, producing proportional circles of
hot spot damage and comparing these with choropleth maps displaying
related environmental characteristics aggregated to ED and ward levels.
The ‘‘hot spot’’ function in CrimeStat produced statistical ellipses of hot
spot clusters that were also displayed using ArcView. An important con-
sideration is that the production of these visualizations is subject to user
input, and modification of the classification ranges and inputs used pro-
duces different visualizations. In CrimeStat, three parameters, the probabi-
lity a cluster was obtained by chance, the minimum number of points per
cluster, and the number of standard deviations for the ellipse, can all be
altered, resulting in different visualizations. The benefit of this type of
analysis is that possible relationships can be visualized and demonstrated
without, or prior to, employing statistical analysis.
Resource target tables (RTTs) compare the number of stops damaged with
the total number of stops. Bus stop incidents are ranked in desc ending order
of incident frequency at each stop. Cumulative counts of incidents as a
percentage of all incidents are constructed, and cumulative percentages
are calculated. These are compared with the corresponding cumulative
counts and percentages of bus stops. This gives an indication of the extent
to which the incidents are concentrated at particular bus stops or groups of
bus stops. An initial assumption in undertaking this analysis was that only
certain types of stop (shelters and conventional displays) would be dam-
aged. Thus, a separate RTT was constructed from which other stop types
were excluded (notably, concrete poles).
All bus stops were assigned to a particular ED using a GIS-based oper-
ation, and from this, the number and cost of incidents of shelter damage
ß 2007 by Taylor & Francis Group, LLC.
could be cross-referenced with Su perProfile lifestyle, ILC decile, and
selected 1991 census variables. In addition to this, the bus stops were also
cross-referenced with a number of police-recorded crime, and police
command-and-control variables aggregated to ward level. This data was
exported from ArcView into a statistical package (SPSSv10.0), which
enabled statistical analysis of the relationships between bus shelter damage
and selected environmental factors. Two possible errors arise here. Using
aggregated data (at ED and, especially, at ward level) increases the possi-
bility of error related to the ecological fallacy (Martin and Longley, 1995).
The ability of a GIS to adjust the levels of aggregation of data can result in
further error attributed to the modifiable areal unit problem, whereby
different aggregations can yield differing interp retations of the same data
(Openshaw and Taylor, 1981). The Spearman’s rank correlation was chosen
as an appropriate nonparametric method for two-tailed bivariate correlation
of non-normally distributed data. In addition to this, the number of bus
stops that suffered shelter damage in each SuperProfile lifestyle were cal-
culated and compared with the frequencies of what damage would be
expected on the basis of the number of stops in each lifestyle using Chi-
square (x
2
) analysis. This technique has previously been applied to burglary
data (Bowers and Hirschfield, 1999).
To examine the temporal patterns of shelter damage, variations in cost
were produced on a monthly basis for the whole of Merseyside. At present
no information exists on hourly variations, and daily variation would be
biased as incidents reported on the weekend (Friday p.m. through Monday
a.m.) are reported as Monday. The data was split into the five districts of
Merseyside, but to account for the disproportionate number of shelters in
each district the rate of shelter damage per 100 shelters per month for each
district was calculated. This was also compared with the rate for shelter
damage per month per 100 shelters for Merseyside.
4.6 Findings and Discussion
Nearest neighbor analysis (NNA) and Ripley’s K-statistics were produced
using CrimeStat to derive for evidence of clustering in the data. The NNI
calculated was 0.1346 and the test statistic (Z) value was
]
102.2862. This
implies a very strong likelihood that the average nearest neighbor is signifi-
cantly nearer than would be expected by chance, and the global distribution
of damaged bus shelters displays evidence of clust ering. An important
consideration is whether the distribution of shelters themselves is clustered.
The NNI of all the shelters is 0.2278 implying that the location of shelte rs
themselves is clustered. However, the large r NNI value of all shelters
compared to the damaged shelters implies the clustering of damaged shel-
ters is over and above the clustered distribution of all shelters themselves.
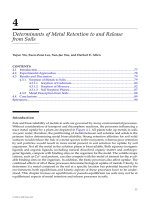
The L(t) values produced for the Ripley’s K-statistic using the CrimeStat
ß 2007 by Taylor & Francis Group, LLC.
software are plotted against the distance bins between points (Figure 4.1).
This demonstrates that the L(t) in creases up to a distance of about 13 km
before starting to decrease again. This also pro vides evidence for clustering
at some higher orders than first-order clustering.
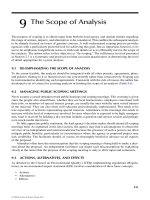
A GIS was used to visualize the outcome of the hot spot analysis of the
shelte r damage . Figure 4. 2 shows pro portion al ci rcles of hot spots, and
compares them with first- and second-order nearest neighbor hierarchical
(NNH) ellipses produced in CrimeStat. The advantage of NNH clusters is
that they can be applied to an entire data set, but may still indicate small
areas of clusters. Only those points closer than expected by chance are
clustered at the first level, before these clusters are reclustered. Linkages
between several small clusters and higher ordered clusters can be readily
observed. The resulting images provide a method of portraying hot spots,
depicting patterns that can be combined with other data within the frame -
work provided by the GIS. The clustered distribution of shelter damage on
Merseyside can be readily observed from this image.
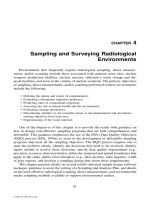
Figure 4.3 sho ws a chor opleth map of the Sup erProfil e lifestyle s in wh ich
the shading is restrict ed to the built-up areas with proportional circles of hot
spot damage overlaid. This provides a visual representation of the possible
relationship between bus shelter damage and lifestyle, and suggests a very
strong correlation between bus shelter damage and the areas of highest
deprivation (the least affluent lifestyle Have-nots). It also demonstrates the
ability of GIS to cross-reference multiple data sets.
A number of methods of hot spot analysis exist (e.g., Crime Mapping
Research Centre, 1998; Chainey and Reid, 2002). These include different
methods of visual interpretation, chor opleth mapping, grid cell analysis,
point pattern analysis, and spatial autocorrelation. Techniques that could be
applied to this data in the future include kernel density interpolation and
0
0
2
4
6
8
10
12
14
16
L(t )
510
Distance (km)
15 20
FIGURE 4.1
L(t) values using Ripley’s K-statistic compared with the distance between points.
ß 2007 by Taylor & Francis Group, LLC.
methods utilizing local indicators of spatial association (LISA). An example
of this is provided by Ratcliffe and McCullagh (1998). These allow for local
influences such as passenger flow numbers to be incorporated into the hot
spot analysis.
Thus far the clustered distribution of bus shelter damage has been dem-
onstrated, but the techniques applied provide no indication as to the extent
to which incidents are concentrated at particular stops or in particular areas.
RTTs were produced to address this issue. An RTT was produced for all the
sto ps on Me rseyside (Appen dix 4.2). Over the year, 20% of all shelte r
damage incidents occurred at 1% of all stops, 50% of all incidents at 5% of
all stops, and 100% of incidents at 25% of all stops. In terms of targeting
resources, this implies that all of the damage occurred at one-quar ter of all
the stops. However, this includes all sto p types including concrete poles, a
type where it is assumed that little or no damage can take place.
To allow for this, a further RTT was constructed for shelters and con-
ventional displays only, with the stop type ‘‘concrete posts’’ excluded
0 4 8 12 16 Kilometers
First-order ellipse
S
N
E
W
Number of incidents of shelter damage
1–5
6–15
16–20
21–29
Second-order ellipse
Merse
y
side districts
FIGURE 4.2
Proportional circles depicting incidents of bus shelter damage during Jan–Dec 2000, with first-
and second-order nearest neighbor hierarchical ellipses overlaid. (From 1991 Census: Digitised
Boundary Data (England and Wales).)
ß 2007 by Taylor & Francis Group, LLC.
(Table 4.1). A co ncentrat ion of damage is evident , with 20% of the damage
occurr ing at 2.5% of all she lters, 50% of damage at 10% of all shelte rs, a nd
100% of the damage at 58% of all she lters. Therefor e, one -fifth of all damage
occurr ed at 2.5% of all bus shelte rs, wh ich in terms of volume equat es to only
63 out of the 2556 bus shelte rs and CDs in Merseys ide. The RTTs demo nstrate
that a co ncentrat ion of shelt er damage ex ists at particu lar stops and in certain
areas and, when co mbined with a GIS, RTTs are a powerful tool in the
iden tification and targetin g of highly victimize d stops.
The visual analy sis suggests appar ent rela tionship s betwe en crimin al
damage to bus shelt ers and its local environm ent, a nd furth er st atistical
analysi s using biva riate correlatio ns was deemed appropri ate. This was to
ascertain whether particular neighborhoods or environmental factors dis-
play a degr ee of correlation with bus shelte r da mage. App endix 4.3 shows a
detailed table of some selected results. It is evident from this that a positive
correlation with the number of incidents of shelter damage is found for the
Merseyside 1991 districts
“Have-nots”
Hard-pressed families
Producers
Senior citizens
Country life
Urban venturers
Nest builders
Settled suburbans
Thriving grays
Affluent achievers
Built areas SuperProfile lifestyle
21–29
16–20
6–15
1–5
Number of incidents of shelter damage
0 2 4 6 Kilometers
N
S
EW
FIGURE 4.3
Bus shelter damage during Jan–Dec 2000 and SuperProfile lifestyles for a section of Merseyside.
(From 1991 Census: Digitised Boundary Data (England and Wales).)
ß 2007 by Taylor & Francis Group, LLC.
percentage household lone parents, the percentage of an area open space,
the percentage of youth unemployment, and the percentage of youths (age
15–25 years) in the area. All are significant at the 99% confidence level.
These are possible indictors of a lack of capable guardianship and the
presence of youths, and suggest they are important contributory factors to
bus shelter damage. Interestingly, the percentage of male unemployment
showed a negative correlation with incidents of bus shelter damage. This is
possibly associated with high unemployment as an indicator of low mobi-
lity. Clearly further analysis of these patterns is appropriate when attempt-
ing to implement crime-reduction measures that design out crime.
Examples of these include crime prevention through environmental design
(CPTED) techniques (Pease, 1997).
Variables that provide information on passenger flows suggest there is a
positive relationship between passenger numbers and bus shelter damage .
Such a relationship is evident at the 99% confidence level for the following
variables: the volume of passengers, percentage of households without a car,
number of persons who travel to work on foot, and those who travel to work
by car. Negative correlations are found between shelter damage and the
TABLE 4.1
Resource Target Table for the Bus Shelter Damage on Merseyside, Jan–Dec 2000
Incidents
per Bus
Shelter
Number of
Affected
Bus Shelters
Cumulative
Number of
Bus Shelters
Cumulative
Number of
Incidents
Cumulative
Percentage of
Bus Shelters
Cumulative
Percentage
of Incidents
29 1 1 29 0.04 0.76
27 1 2 56 0.08 1.47
25 1 3 81 0.12 2.12
24 1 4 105 0.16 2.75
23 1 5 128 0.20 3.35
20 1 6 148 0.23 3.88
17 1 7 165 0.27 4.32
16 3 10 213 0.39 5.58
15 4 14 273 0.55 7.15
14 5 19 343 0.74 8.99
13 2 21 369 0.82 9.67
12 5 26 429 1.02 11.24
11 13 39 572 1.53 14.99
10 14 53 712 2.07 18.66
9 10 63 802 2.46 21.02
8 22 85 978 3.33 25.63
7 29 114 1181 4.46 30.95
6 33 147 1379 5.75 36.14
5 60 207 1679 8.10 44.00
4 89 296 2035 11.58 53.33
3 151 447 2488 17.49 65.20
2 290 737 3068 28.83 80.40
1 748 1485 3816 58.10 100.00
0 1071 2556 n=a 100.00 n=a
ß 2007 by Taylor & Francis Group, LLC.
following: the percentage households with one car, percentage home work-
ers, percentage travel to work by car, and interestingly percentage travel to
work by train, all significant at the 0.001 level. This adds weight to the claim
that bus stops are crime generators. However, it is difficult to infer any causal
relationships because data on other crime levels in the area would be
required. The negative relationship with passengers using trains raises a
number of questions. Does public transport facilitate, or disp lace crimes,
for example? It is evident that information on damage to bus routes, train
stations, train journeys, and other mode of transport needs to be assembled
and built into this system so that such issues can be explored completely.
The police crime data aggregated to ward level shows positive correlation
with shelter damage, although this is a very generalized measure. Youths
causing annoyance and recorded criminal damage displayed the most sig-
nificant correlations with shelter damage. To understand this relationship
further, crime would need to be analyzed at finer levels of aggregation (at
ED or usin g disaggregate data, for example). This could be coupled with
information about land use in the vicinity of individual bus stops, and local
population levels as this may also vary by time of day. This could then
provide further insight into whether bus stops act as crime generators, and,
if so, for what types of crime and at what times of day?
The SuperProfile lifestyle classification and the ILC both exhibit a positive
relationship between levels of deprivation and levels of shelter damage
(significant at the 99% confidence level). To examine this fu rther, the number
of damaged shelters located within each lifestyle area were compared with
the amount of damage that would be expected based on the number of
shelters in each lifestyle. Chi-square analysis was used for this and the results
are shown in Table 4.2. The high positive relationship with ‘‘have-not’’
areas is evident. ‘‘Hard-pressed’’ and ‘‘producers’’ also experience greater
than expected levels of shelter damage. In most affluent areas there is an
underrepresentation of bus shelter damage. This suggests that there is a clear
TABLE 4.2
Correlation Coefficients for the Four Domains
Lifestyle Number of Damaged Stops x
2
-Value Significance Level
Affluent achievers 518 50.74 (
]
) 0.001
Thriving greys 617 34.71 (
]
) 0.001
Settled suburban 825 31.03 (
]
) 0.001
Nest builders 683 0.8 (
]
) n.s.
a
Urban venturers 185 0 n.s.
Country life 28 1.57 (
]
) n.s.
Senior citizens 445 0.02 n.s.
Producers 769 9.09 0.001
Hard-pressed 546 5.93 0.005
Have-nots 1366 92.66 0.001
a
n.s., not significant.
ß 2007 by Taylor & Francis Group, LLC.
soc ial gradi ent in the degre e to which neig hborho ods are prone to shelt er
damag e.
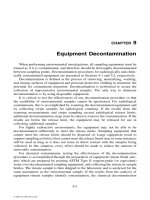
Figure 4.4 shows the co st of shelt er damage per 1 00 shelte rs by mo nth for
the year 2000 in fi ve Mersey side districts. Alth ough the distr ict Liverpool ,
wh ich contain s the ci ty center , experi ences a highe r volume of in cidents of
shelt er da mage (Appen dix 4.4). The rate of damage per shelte r is highest in
Kno wsley . A distin ct peak in the damage occu rs in Oct ober and Nove mber.
This is probably attributable to Halloween, Mischief Night, and Bonfire
Night. In March and in the summer months a trough exists. One possibility
is during school holiday’s youths use buses and hence shelters less fre-
quently, adding weight to the idea of shelters as crime generators. This
data is only for 1 year, and hourly or daily variation plus comparisons
with other years is desirable for future analysis.
4.7 Conclusi ons
This research has demonstrated the importance of the use of GIS, in com-
bination with other techniques, to increase the knowledge of the nature and
extent of criminal damage to bus shelters. It represents an initial attempt to
develop a framewor k that should enable the identification of the levels and
causes of crime and diso rder on public transport. Such a framework should
allow the testing of general theories of crime and disorder to see whether
they can be applied or adapted to explain crime on public transport.
This task could be improved by extending the range of data sets utilized
in this research. For example information on crime on individual bus routes,
distinguished by category and with information about time of day could
Jan Feb Mar Apr May Jun
Month
Cost of damage (£)
0
500
1000
1500
2000
2500
3000
3500
4000
Jul Aug Sep Oct Nov Dec
Knowsley
Liverpool
Merseyside
St Helens
Wirral
Sefton
FIGURE 4.4
Merseyside shelter damage 2000: costs per 100 shelters by district.
ß 2007 by Taylor & Francis Group, LLC.
usefully be added in the future. It is contended that this could then be
combined with data relating to crime on other modes of transport. Data
on land use at the individual stop level should also be associated. The
understanding of crime on public transport systems could be further
enhanced by adding more disaggregate contextual data on other crimes
in the surrounding areas and of local socio-demographic characteristics.
Aspects of the physical infrastructure could be incorporated using OS
landline data or aerial photographs.
This paper has presented preliminary evidence that damage at bus shel-
ters is concentrated at particular stops and areas. Hot spot analysis, RTTs,
and GIS have been used to identify and target these ‘‘high risk’’ stops and
areas. There is evidence to suggest that particular neighborhoods, socio-
demographic influences, and physical characteristics are more susceptible
to shelter damage than others. Such areas include those in which high levels
of deprivation are recorded, areas with large amounts of open space, and
those with concentrations of youth populations. It is argued that this has
implications for route planning and in tackli ng crime and disorder on public
transport, which warrants further research.
There is some evidence in support of the notion of bus stops as crime
generators. It is possible that bus stops act as generators of crime at certain
times of the day and as crime attractors at other times. This may also vary
for different types of crime, for example, criminal damage and robbery.
Evidently further information on this is required. In summary, this paper
has demonstrated the importance of further research into crime and dis-
order on public transport. It suggests that bus shelter damage is related to its
environment, and discusses how GIS and other crime-mapping techniques
can be combined to develop the knowledge of the extent of, and the theor-
etical reasons underlying, crime and disorder on public transport.
Acknowledgments
This work is based on data provided with the support of the ESRC and JISC
and uses boundary material which is copyright of the Crown and the
ED-LINE consortium. Datasets used: Bus stops—Merseytravel; Crime
data—Mersey Police; Superprofile—Liverpool University.
References
Barlow, H., 1993, Introduction to Criminology (New York: Harper Collins).
Block, R. and Davis, S., 1996, The environs of rapid transit stations: a focus for street
crime or just a risky place? In Preventing Mass Transit Crime. Crime Prevention
Studies, Volume 6, edited by R.V. Clarke (Monsey, NY: Criminal Justice Press).
ß 2007 by Taylor & Francis Group, LLC.
Bowers, K., 1999, Crimes against non-residential properties: pattern of victimization,
impact upon urban areas and crime prevention strategies. Ph.D. Thesis, Univer-
sity of Liverpool.
Bowers, K. and Hirschfield, A., 1999, Exploring links between crime and disad-
vantage in north-west England: an analysis using geographical informa-
tion systems. International Journal of Geographical Information Science 13(2), 159–184.
Brantingham, P. and Brantingham, P., 1993, Environment, routine and situation:
toward a pattern theory of crime, In Routine Activity and Rational Choice. Advances
in Criminological Theory, Volume 5, edited by R. Clarke and M. Felson, pp. 259–294
(New Brunswick, NJ: Transaction Publishers).
Brantingham, P. and Brantingham, P., 1995, Criminality of place: crime generators
and crime attractors. European Journal on Criminal Policy and Research: Crime
Environment and Situational Prevention 3(3), 5–26.
British Crime Survey, 2000, The 2000 British Crime Survey (England and Wales) . Home
Office Statistical Bulletin 18=00 (London: Home Office).
Brown, P., 1991, Exploring geodemographics, In Handling Geographic Information:
Methodology and Potential Applications , edited by I. Masser and M. Blakemore,
pp. 221–258 (London: Longman).
Brown, P. and Batey, P., 1994, Characteristics of Super Profile Lifestyle and Target
Markets: Index Tables, Pen Pictures and Geographical Distribution. Super Profile
Technical Notes 2 (Liverpool: URPERRL, Department of Civic Design, University
of Liverpool).
Brown, S., Colo, A., Lawless, D., Lu, X., and Rogers, D., 1998, Interdicting a burglary
pattern: GIS and crime analysis in the Aurora police department, In
Crime Mapping: Case Studies , edited by N. LaVigne and J. Wartell, pp. 99–108
(Washington, DC: Police Executive Research Forum).
Buerger, M., Cohn, E., and Petrosino, A., 1995, Defining the ‘‘hot spots of crime’’:
operationalising theoretical concepts for field research, In Crime and Place: Crime
Prevention Studies, Volume 4, edited by J. Eck and D. Weisburd, pp. 237–258
(New York: Willow Tree Press).
Chainey, S., Reid, S., and Stuart, N., 2002, When is a hotspot a hotspot? A procedure
for creating statistically robust hotspot maps of crime, In Innovations in GIS 9:
Socio-Economic Applications in Geographical Information Science, edited by
D.B. Kidner, G. Higgs, and S.D. White, pp. 21–36 (London: Taylor & Francis).
Clarke, R. (editor), 1992, Situational Crime Prevention: Successful Case Studies
(New York: Harrow and Heston).
Cohen, L. and Felson, M., 1979, Social change and crime rate trends: a routine activity
approach. American Sociological Review 44, 588–608.
Cornish, D. and Clarke, R., 1986, The Reasoning Criminal: Rational Choice Perspectives
on Offending (New York: Springer).
Crime Mapping Research Centre, 1998, Hot Spots: An Exploration of Methods (http: ==
www.ojp.usdoj.gov =nij=maps= ).
Department of the Environment, 1995, 1991 Deprivation Index. A Review of Approaches
and a Matrix of Results (London: HMSO).
Department of the Environment, Transport and the Regions, 1998, White Paper on the
Future of Transport (London: HMSO).
Department of the Environment, Transport and the Regions, 1999, Young People and
Crime on Public Transport (London: HMSO).
ß 2007 by Taylor & Francis Group, LLC.
Eck, J. and Weisburd, D., 1995, Crime places in crime theory, In Crime and Place:
Crime Prevention Studies, Volume 4, edited by J. Eck, and D. Weisburd, pp. 1–34
(New York: Willow Tree Press).
Johnson, S., Bowers, K., and Hirschfield, A., 1997, New insights into the spatial and
temporal distribution of repeat victimization. British Journal of Criminology 37(2),
224–241.
Jupp, V., Davies, P., and Francis, P. (editors), 2000, Doing Criminological Research
(London: Sage).
LaVigne, N., 1997, Visibility and Vigilance: Metro’s Situational Approach to Preventing
Subway Crime (Washington, DC: National Institute of Justice).
Levine, N., Wachs, W., and Shirazi, E., 1986, Crime at bus stops. A study of envir-
onmental factors. Journal of Architectural and Planning Research 3(4), 339–361.
Loukaitou-Sideris, A., 1999, Hot spots of bus stop crime. The importance of
environmental attributes. Journal of the American Planning Association 65(4),
395–411.
Martin, D. and Longley, P., 1995, Data sources and their geographic integration,
In GIS for Business Service Planning, edited by P. Longley and G. Clarke, pp. 15–32
(New York: Wiley).
McEwen, T. and Taxman, S., 1995, Applications of computerised mapping to police
operations, In Crime and Place: Crime Prevention Studies, Volume 4 , edited by J. Eck
and D. Weisburd, pp. 259–284 (New York: Willow Tree Press).
Openshaw, S. and Taylor, P., 1981, The modifiable unit areal problem, In Quantitative
Geography: A British View, edited by N. Wrigley and R. Bennett, pp. 60–69
(London: Routledge and Kegan).
Pearlstein, A. and Wachs, M., 1982, Crime in public transit systems. An environmen-
tal design perspective. Transportation 11, 277–297.
Pease, P., 1997, Crime prevention, In The Oxford Handbook of Criminology, edited by
M. Maguire, R. Morgan, and R. Reiner (Oxford: Clarenden Press).
Ratcliffe, J. and McCullagh M.J., 1998, Identifying repeat victimization with GIS.
British Journal of Criminology 38(4), 651–662.
ß 2007 by Taylor & Francis Group, LLC.
Appendices
Appendix 4.1 SuperProfile Lifestyle Pen Pictures
A short description of each lifestyle provides some idea of the distinguish-
ing characteristics of these geodemographic groups based on the interpret -
ation of an index table comparing the mean value of a selection of variables
for each cluster with the corresponding mean value for the country as a
whole, which is taken from Brown and Batey (1994). Lifestyles are alterna-
tively numbered from 1 to 10.
Lifestyle A: Affluent Achievers
High-income famil ies, living predominantly in detached houses. The afflu-
ent achiever typically lives in the stockbroker belts of the major cities and is
likely to own two or more cars, which are top of the range, recent purchase
and relied on for pursuit of an active social and family life. This type of
person has sophisticated tastes. They eat out regularly, go to the theater and
opera, and take an active interest in sports (e.g., cricket, rugby union, and
golf). In ad dition they can afford several expensive holidays every year.
Financially aware, with a high disposable income, affluent achievers often
invest in company shares and specialized accounts. They use credit and
charge cards frequently, and are likely to opt for private health insurance.
Investments are followed closely in broadsheets such as the Financial Times,
the Times, and the Telegraph. Other magazines bought may include Hello,
Harpers & Queen, and Vogue.
Lifestyle B: Thriving Greys
Generally older than affluent achievers, possibly taking early retirement,
the thriving greys are also prosperous. Their detached or semidetached
homes have been completely paid for, and children have grown up and
left home. Therefore, the greys have money to spare for investments or
spending, on items such as a superior car. They eat out regularly, take one
or two holidays a year, and are likely to play and enjoy going to the theater .
This group is also financially aware and may invest in the stock exchange
and opt for health insurance. The thriving greys read the broadsheets as
well as more traditional magazines, such as Women’s Realm, and Woman
and Home.
ß 2007 by Taylor & Francis Group, LLC.
Lifestyle C: Settled Suburbans
Well-established families in generally semidetached suburban homes. Set-
tled suburbans are employed in white-collar and middle management
positions, while in addition many wives work part-time. The lifestyle is
fairly affluent, in that one or two package holidays a year may be taken, and
the family can afford to purchase newer cars. They have taken advantage of
government share offers in the past and often use credit cards. Many are
mail-order agents. Typical publications read include the Daily Mail, the
Express, Ideal Home, and Family Circle.
Lifestyle H: Producers
These more affluent blue-collar workers live in terraced or semidetached
housing. Many are middle aged or older, and their children have left home.
They work in traditional occupations and manufacturing industries, where
unemployment has risen to a significant level. Most are well settled in their
homes, which are either purchased or rented from the council. Leisure
pursuits include going to the pub and betting on horse races. On TV,
football and rugby league are the preferred sports. They do not spend
money on cars and there is little planning for the future by way of financial
investments. The Sun, the Mirror, and the News of the World are the most
popular newspapers.
Lifestyle I: Hard-Pressed Families
Living in council estates, in reasonably good accommodation, unemploy-
ment is a key issue for these families. Most work is found in unskilled
manufacturing jobs, if available, or on government schemes. The parochial
nature of this group is emphasized by an unwillingness or inability to either
move home or go on holiday. The most popular leisure activities are betting
and going to pubs and clubs. On TV, sports such as football and rugby
league are watched. Tabloids, particularly the Sun, the Mirror, and the Daily
Record are the chosen daily papers.
Lifestyle J: Have-Nots
Single parent families composed of young adults and large numbers of
young children, living in cramped flats. These are the underprivileged
group who move frequently in search of a break. However, with 2.5 times
the national rate of unemployment and with low qualifications, there seems
little hope for the future. Most are on income support, and those who can
find work are in low-paid, unskilled jobs. There are very few cars and little
chance of getting away on holidays. Recreation comes mainly from the
ß 2007 by Taylor & Francis Group, LLC.
television and the take up of satellite and cable TV is high. Betting is also
popular, particularly greyhound racing. The Sun and the Mirror are the
most popular newspapers.
Appendix 4.2 Resource Target Table for All Shelter Types
Incidents
per Bus
Stop
Number of
Affected Bus
Stops
Cumulative
Number of
Bus Stops
Cumulative
Number of
Incidents
Cumulative
Percentage of
Bus Stops
Cumulative
Percentage of
Incidents
29 1 1 29 0.02 0.76
27 1 2 56 0.03 1.47
25 1 3 81 0.05 2.12
24 1 4 105 0.07 2.75
23 1 5 128 0.08 3.35
20 1 6 148 0.10 3.88
17 1 7 165 0.12 4.32
16 3 8 181 0.13 4.74
15 4 11 228 0.18 5.97
14 5 15 287 0.25 7.52
13 2 21 369 0.35 9.67
12 5 26 429 0.43 11.24
11 13 39 572 0.64 14.99
10 14 53 712 0.88 18.66
9 10 63 802 1.04 21.02
8 22 85 978 1.41 25.63
7 29 114 1181 1.88 30.95
6 33 147 1379 2.43 36.14
5 60 207 1679 3.42 44.00
4 89 296 2035 4.89 53.33
3 151 447 2488 7.39 65.20
2 290 737 3068 12.19 80.40
1 748 1485 3816 24.55 100.00
0 4563 6048 n=a 100.00 n=a
ß 2007 by Taylor & Francis Group, LLC.
Appendix 4.3 Bivariate Correlat ion Res ults
Potential Indicators of Deprivation and Lack of Guardianship
SuperProfile
Lifestyles
ILC
Decile
Male
Unemployment
Youth
(16–19 yr)
Unemployed
% Open
Space
% Lone
Parents
% Youths
(15–24 yr)
% Young
Adults
(25–44 yr)
Number of
incidents
of bus
shelter
damage
Spearman’s r
Significance
(two-tailed)
0.228* 0.219*
]
0.07* 0.145* 0.242* 0.165* 0.077*
]
0.044
**
0.000 0.000 0.001 0.000 0.000 0.000 0.000 0.038
N 2925 2925 2925 2925 2925 2925 2925 2925
ß 2007 by Taylor & Francis Group, LLC.
Indicators of Passenger Volumes
% Household with
% Home
Workers
% Travel to Work
Passengers No Car 1 Car On Foot By Car By Bus By Train
Number of
incidents of
bus shelter
damage
Spearman’s r
Significance
(two-tailed)
0.342* 0.231*
]
0.207*
]
0.075* 0.071*
]
1.54* 0.177*
]
0.083*
0.000 0.000 0.000 0.000 001 0.000 0.000 0.000
N 2925 2925 2925 2925 2925 2925 2925 2925
Indicators of Other Crime Levels
Command-and-Control Recorded Crime
Youths Causing
Annoyance Disorder
Criminal
Damage Drugs
Other
Violence Robbery All Crime
Number of
incidents of
bus shelter
damage
Spearman’s r
Significance
(two-tailed)
0.542* 0.526* 0.505* 0.428* 0.499* 0.485* 0.468*
0.000 0.000 0.000 0.000 0.000 0.000 0.000
N 118 118 118 118 118 118 118
* Correlation is significant at the 0.01 level (two-tailed).
** n.s., not significant (p > 0.05)
ß 2007 by Taylor & Francis Group, LLC.
Appendix 4.4A Merseyside Shelter D amage Jan–Dec 2000
(Cost per Month)
Jan
0
10,000
20,000
30,000
40,000
50,000
60,000
70,000
Feb Mar Apr May Jun
Month
Cost (£)
Jul Aug Sep Oct Nov Dec
Appendix 4.4B Merseyside Shelter Damage 2000 (Cost per
District per Month)
Jan
0
10,000
15,000
5,000
20,000
30,000
25,000
Feb Mar Apr May Jun
Month
Cost (£)
Jul Aug Sep Oct Nov Dec
ß 2007 by Taylor & Francis Group, LLC.