WILDLIFE SCIENCE: LINKING ECOLOGICAL THEORY AND MANAGEMENT APPLICATIONS - CHAPTER 12 pot
Bạn đang xem bản rút gọn của tài liệu. Xem và tải ngay bản đầy đủ của tài liệu tại đây (635.38 KB, 20 trang )
12
Density Dependence in
Deer Populations:
Relevance for
Management in Variable
Environments
Charles A. DeYoung, D. Lynn Drawe,
Timothy Edward Fulbright, David Glenn Hewitt,
Stuart W. Stedman, David R. Synatzske, and James G. Teer
CONTENTS
Testing South Texas Deer Counts for Density Dependence 206
Foundation Theory and Management Relevance 215
Acknowledgments 220
References 220
New-world deer of the genus Odocoileus are commonly assumed to respond to food shortage
due to intraspecific competition by reduced recruitment, body mass, and other manifestations.
McCullough’s (1979) book on the George Reserve deer herd is commonly cited as the definit-
ive work on density dependence in white-tailed deer (O. virginianus), and by extension, mule deer
(O. hemionus). The George Reserve is a 464-ha, high-fenced property in Michigan, United States.
Two males and four females were introduced in 1928, and by 1933, the population was estimated
to be 160. The population fluctuated until 1952, when a series of experiments with deer density
began. The population was reduced during this time in a series of steps and data collected to form a
population model (McCullough 1979). Strong density dependence was evident in this model.
Reductions in the George Reserve population continued into 1975, when an estimated 10 deer
remained (McCullough 1982). No deer were subsequently harvested for 5 years to allow the popu-
lation to increase. McCullough (1982, 1983) concluded that the population response after 1975 was
similar to the original increase from 1928 to 1933.
Downing and Guynn (1985) presented a generalized sustained yield table using McCullough
(1979) as a starting point. Downing and Guynn (1985) used their experience and literature values to
present a table scaled to percent K carrying capacity. McCullough (1979, 1982, 1983) and Downing
and Guynn (1985) showed density-dependent responses across the population growth range from
low density to K. We define K as the maximum sustainable population level where the deer are in
approximate equilibrium with their food supply (Macnab 1985).
Downing and Guynn (1985) recognized that their generalized model might not apply to all deer
populations. They wondered if their model would be applicable to low-density populations and areas
203
© 2008 by Taylor & Francis Group, LLC
204 Wildlife Science: Linking Ecological Theory and Management Applications
with poor habitat, which precluded high rates of recruitment. They suggested ways their generalized
model could be modified for populations that did not fit the mold of those where recruitment was
consistently high and relatively stable across time.
McCullough (1984) also recognized that if environmental variation is great, density-dependent
effects, while present in the mix of factors impinging on a population, may be masked. He suggested
that these situations were rare and occurred at extreme fringes of whitetail range.
Mackie et al. (1990) questioned whether density-dependent models have utility for management.
They presented data from three mule deer and two white-tailed deer populations in Montana, United
States, and concluded that there was evidence of density-dependent behavior in one mule deer
and one white-tailed deer population. They stated that western North America has a high degree
of environmental variation resulting in fluctuating carrying capacity. They suggested that some
Montana populations had declined, because expected density-dependent responses to harvest did not
happen. Finally, they suggested that in variable environments, managers should employ techniques
providing regular tracking of population size and performance and not depend on predictions from
density-dependent models.
McCullough (1990) issued a strong caution to the conclusions of Mackie et al. (1990). He
stressed that density-dependent behavior may be missed because it is obscured by environmental
factors and sampling error. Also, experimental and statistical design frequently places the burden of
proof on density dependence, that is, the null model is a lack of density dependence. Finally, time
lags, study area scale, environmental homogeneity, life history, behavior, and predation may make
density dependence difficult to detect when in fact it is present. Importantly, McCullough (1990)
hypothesized that several of these factors, singularly or in combination, can result in a population of
deer expressing no density-dependent response until very near K.
Fryxell et al. (1991) reported on a white-tailed deer population in southeastern Ontario, Canada,
that fluctuated widely over 34 years. They concluded that variation in hunting effort strongly affected
the fluctuation and that the population showed time-lagged density dependence.
McCullough (1992) again emphasized that environmental variation can obscure density-
dependent responses in deer populations. He stated that this may require study of a population
over a large range of densities to detect a density-dependent response. McCullough (1999) also
reviewed and extended his concept of some populations of ungulates having a “plateau” of constant
growth and then a “ramp” of declining growth in the graph of r on N (Figure 12.1B, b, C, and c).
No density-dependent response would be observed in the plateau phase. He hypothesized that this
model could fit more K-selected species with low reproductive rates. However, he speculated that a
plateau and ramp model may fit Odocoileus deer in desert environments.
Bartmann et al. (1992) could not detect differences in fawn survival in response to experimental
removal of 22 and 16% in consecutive years in a migratory Colorado, United States, mule deer
population. They subsequently simulated density-dependent fawn mortality in enclosures with a
wide range of density. Natural mortality of adult does was low in the free-ranging population but
fawn mortality was relatively high and varied with winter severity. Relation of this population to K
was unknown, but the authors assumed it to be near or at K.
Keyser et al. (2005) studied long-term data sets for nine white-tailed deer populations in the
southeastern United States. They concluded that eight out of nine populations showed density-
dependent responses, but that these responses frequently lagged 1 or 2 years. They stated that the
population that did not show density-dependent responses occurred on exceptionally poor habitat.
Shea et al. (1992) collected data from a white-tailed deer population in Florida, United States, that
declined 75% in density during a 10-year period. They found little difference in deer physiological
indices during this period and concluded that the habitat, which was characterized by low-fertility
soils, produced low amounts of high-quality forage and an abundance of poor-quality forage. Lack
of nutritious forage, coupled with abundant poor-quality forage precluded a density-dependent
response, because there was little opportunity for intraspecific competition, even whendensitieswere
high. Shea and Osborne (1995) discussed poor-quality habitat across North America. They surveyed
© 2008 by Taylor & Francis Group, LLC
Density Dependence in Deer Populations 205
r
N
A
K
Time
Time
cc
N
Number
cc
N
Number
cc
N
Number
Time
r
N
B
K
r
N
C
(a)
(b)
(c)
K
Density
dependence
expressed
Density
dependence
expressed
Density
dependence
expressed
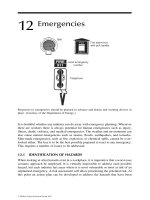
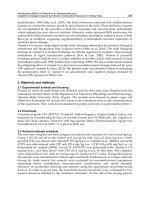
FIGURE 12.1 Plateau and ramp graphs (A, B, C) showing a range of deer population density-dependent
responses and corresponding graphs (a, b, c) of carrying capacity variation in comparison to population level
variation. (Adapted from D. R. McCullough. J. Mammal. 80:1132 and 1133:1999. With permission.)
state gamedepartmentsandproduced a map withinwhitetailrange wheredensity-dependentresponse
would be lacking or masked.
Dumont et al. (2000) worked on white-tailed deer on the northern limit of their range in south-
eastern Quebec, Canada. They stated that severe winters were among the major factors limiting deer
populations, but found density-dependent responses during mild winters.
Gilbert and Raedeke (2004) worked on Columbian black-tailed deer (Odocoileus hemionus
columbianus) and found that minimum temperatures in May and the amount of precipitation in June
affected fawn recruitment. However, they also reported that plant production was correlated with
deer density in the same year. Also, their best models of fawn production included time-lagged dens-
ity or forage terms. They concluded that the population was expressing density-dependent behavior
during the study period.
McCullough (1999) cited the intrinsic rate of increase of the population, scale of area occupied
by the population, heterogeneity of environment, and general quality of the habitat as factors that
might explain why ungulates respond differently to a range of densities. Scale of the area occupied
by the population refers to confined areas such as enclosures or islands where limitations on dispersal
may change population growth rate. A heterogeneous environment allows ungulates more types of
high-quality food, leading to competition among different classes of individuals as density increases.
© 2008 by Taylor & Francis Group, LLC
206 Wildlife Science: Linking Ecological Theory and Management Applications
Finally, high-quality habitats, including moderate temperatures and precipitation, lead to high plant
production. On the contrary, habitats with strong limitations on plant growth may result in most
forage being of low quality, except perhaps in occasional good years.
White-tailed deer have the potential to have a high rate of increase in rich habitats with
stable environments, where female fawns commonly breed. Such populations may have a density-
dependent function(r onN)that is all ramp, with noplateau (Figure 12.1A). Suchpopulations express
density dependence virtually all the time (Figure 12.1a), even though N may be well below K.
McCullough (1999) listed mule deer among the species that may exhibit a plateau-ramp density-
dependent function (Figure12.1B and b). He stated that thesepopulationsmay not reach K veryoften,
because they tend to live in variable environments, and have lower rates of increase as compared
to white-tailed deer. Populations that fit the plateau-ramp hypothesis (Figure 12.1B and b) have a
plateau of the density-dependent function where no density-dependent responses would occur. Only
when these populations approach K are density-dependent effects observed. When these populations
are significantly below K, density-dependent effects are not observed (Figure 12.1B and b).
McCullough (1999) felt that desert mule deer (O. H. crooki) may exhibit the density-dependent
function shown in Figure 12.1C, based on the work of Short (1979). This hypothesis fits populations
with lowintrinsic rates ofincrease, homogenoushabitats with mostlylow-quality forage, and variable
environments. Figure 12.1c shows that these populations only exhibit density-dependent responses
during occasional favorable periods.
This review of literature shows that Odocoileus population dynamics are complex and frequently
site specific. The complex nature of population dynamics in this genus makes formulating a general
population model challenging. Almost without exception, researchers cite McCullough’s (1979)
George Reserve work as the conventional model for density dependence. However, as this review
has shown, there are many situations where density-dependent behavior in Odocoileus populations
cannot be detected. How widespread are habitats where the assumption of density-dependent beha-
vior is not useful to management? Our objectives in this chapter are to (1) analyze three long-term
sets of white-tailed deer counts in South Texas for density-dependent behavior, (2) suggest some uni-
fying concepts for considering density-dependent and density-independent behavior of Odocoileus
populations, and (3) suggest regions of deer range where population behavior cannot regularly be
predicted with density-dependent models.
TESTING SOUTH TEXAS DEER COUNTS FOR
DENSITY DEPENDENCE
Early European explorers in SouthTexas, United States, found a landscapethatwas mostly grassland,
commonly interspersed with shrub communities (Inglis 1964; Fulbright 2001). White-tailed deer
were present in wooded stream bottoms, shrub communities on upland areas, and on the open prairie.
Little is known about deer populations from this period, except they were commonly mentioned in
traveler’s journals (Doughty 1983, 29; Fulbright 2001).
Cattle and horses were at least locally numerous by the mid-1700s (Lehmann 1969). Shrubs
probably began to increase at this time, and this trend continued into the twentieth century (Jones
1975). Although famous for cattle ranching, the region harbored millions of domestic sheep in the
latter part of the nineteenth century (Lehman 1969). Climatic change may have been a background
condition influencing changes in plant ecology in the region, with grazing by domestic livestock
being the driving force (Van Auken 2000).Acool, wet period lasted from about 1350 to 1850 (Foster
1998, 9). After 1850, the climate became warmer and dryer, which may also have influenced the
increase in shrub density and distribution. Removal of fuel by livestock grazing and suppression
by humans reduced or eliminated natural fires that inhibited the increase in woody plants during
pre-Columbian times (Van Auken 2000). In the twentieth and early twenty-first centuries, the region
has been covered by a canopy of shrubs, frequently in complex taxonomic mixes (Inglis 1964;
© 2008 by Taylor & Francis Group, LLC
Density Dependence in Deer Populations 207
Jones 1975). Exclusive of the coastal sand plain and coastal prairie, over 90% of the region has
been subjected to ≥1 attempts to reduce shrub density to increase cattle-carrying capacity (Davis
and Spicer 1965).
Increased shrub density during at least the past two centuries may have facilitated increased deer
populations. Deer did not become locally extinct in South Texas after European settlement as they
did in much of NorthAmerica. This was the result of low human density in the region, and large land
ownerships. Roads and highways were scarce until the 1920s when oil exploration began in earnest.
South Texas, particularly the King Ranch and the Aransas National Wildlife Refuge, provided deer
for reestablishing populations elsewhere in the state.
Historically, medium- and large-sized predators of deer have included jaguar (Panthera onca),
mountain lion (Puma concolor), bobcat (Lynx rufus), black bear (Ursus americanus), gray wolf
(Canis lupus), red wolf (Canis niger), and coyote (Canis latrans). Of these, wolves and jaguar are
extirpated. Black bears are limited to occasional dispersers from northern Mexico. Mountain lions
are present in generally low, but apparently increasing density with high densities in localized areas
(Harveson 1997). Coyotes and bobcats are present throughout the region, often at high population
densities.
Mountain lions prey on deer in South Texas, but do not appear to exert a region-wide influence
on populations. Bobcats kill deer but do not appear to be an important factor to deer populations
(Blankenship 2000; Ballard et al. 2001). Studies in the 1960s and 1970s in eastern South Texas
showed significant coyote predation on deer fawns (Cook et al. 1971; Beasom 1974; Carroll and
Brown 1977; Kie and White 1985). Meyer et al. (1984) suggested that in addition to coyote predation,
poor summer nutrition may be a strong factor in low South Texas fawn survival.
Even before there was any formal management of deer populations, South Texas was well known
for producing large-antlered bucks (Brothers and Ray 1975; Helmer 2002). Large antlers are con-
sistent with populations well below K carrying capacity (McCullough 1979). Examples of irruptive
behavior in deer populations in the region are lacking, although an irruption was experimentally
induced by Kie and White (1985). Fawn survival from birth to fall is erratic (Ginnett and Young
2000) and low compared to white-tailed deer populations in general (Downing and Guynn 1985).
Unhunted and otherwise unmanaged deer populations persist in a generally healthy state on some
large, remote ranches.
The region is virtually all private land, much of which is leased for hunting. Intense interest
in deer management has developed among landowners and hunters during the past three decades.
Wildlife biologists in the region commonly prescribe management practices for deer populations
based on the assumption of density-dependent population behavior (Brothers and Ray 1975: 62).
This is particularly true of prescriptions to harvest does, as there is a common belief that without
significant doe harvest, deer populations will increase to undesirable levels.
In variable environments, K carrying capacity (Macnab 1985) varies from year to year. The
same number of animals may be above K in dry years and below K in wet years (McCullough 1979:
156). The negative feedback of animals on food plants is less important as a population influence
compared to the annual swings in K. For South Texas, the CV for annual rainfall varies from 29 to
41% (Norwine and Bingham 1985). Rainfall occurs throughout the year with statistical peaks in May
and September. The average growing season is about 300 days; however, plant growth can occur
any month when moisture and temperature permit (Box 1960; Ansotegui and Lesperance 1973).
We analyzed for density dependence in long-term time-series of deer counts on three study areas.
The Faith Ranch (28
◦
15
N, 100
◦
00
W) was 16,115 ha in the western portion of South Texas, the
Chaparral Wildlife Management Area (28
◦
20
N, 99
◦
25
W) consisted of 5,930 ha approximately in
the center, and the Rob and Bessie Welder Wildlife Foundation Refuge (28
◦
6
N, 97
◦
75
W) was
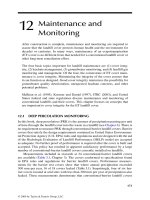
3,158 ha in the eastern portion of the region (Figure 12.2).
For the Faith Ranch, a single helicopter survey of deer was conducted annually during 1975–1977
and 1981–1997. This consisted of flying adjacent belt transects about 200 m wide, at a height of about
20 m andspeed of about 55km/h(DeYoung 1985; Beasom et al. 1986). Surveysencompassedvarious
© 2008 by Taylor & Francis Group, LLC
208 Wildlife Science: Linking Ecological Theory and Management Applications
Faith
Chaparral
Welder
*
*
*
FIGURE 12.2 Location of Faith Ranch, Chaparral Wildlife Management Area, and Rob and Bessie Welder
Wildlife Refuge, South Texas, USA.
portions of the Faith Ranch over time (Table 12.1). The time series consisted of raw, unadjusted
numbers of deer counted each year and classified as does, bucks, and fawns. Because of the variation
in area flown and counted over the time series, deer numbers were transformed into deer density
(deer/405 ha).
On the Chaparral Area, population estimates from 1969 to 1975 were made by spotlight counts
following methods described by Fafarman and DeYoung (1986). A density estimate was calculated
for the spotlight route on the Chaparral Area. The density estimate was subsequently projected to a
population estimate for the entire area each year. During 1975–1997, a single, complete-coverage
helicopter survey (DeYoung 1985; Beasom et al. 1986) was conducted on the entire area. The time
series consisted of estimates of deer population size derived from spotlight surveys, or the raw,
unadjusted number of deer counted by helicopter each year (Table 12.2). The change in census
methods undoubtedly introduced additional variability into the time series. Fafarman and DeYoung
(1986), working on the Welder Wildlife Refuge, reported that population estimates from spotlight
counts were about 10% higher than raw winter helicopter surveys. Deer were classified as does,
bucks, and fawns during counts by spotlight and helicopter. A few unidentified deer were also
tallied, but excluded from analysis. Because the same area was counted throughout the time series,
number of deer estimated or counted was used to form variables for analysis.
Census data were available on the Welder Wildlife Refuge from 1963 to 1997, except for 1964
and 1969. During 1963–1976, population estimates were made by spotlight counts (Fafarman and
© 2008 by Taylor & Francis Group, LLC
Density Dependence in Deer Populations 209
TABLE 12.1
March–May Rainfall and Number of Deer by Class Coun-
ted during Fall Surveys by Helicopter on the Faith Ranch,
South Texas, USA, 1974–97
March–May Hectares
Year rain (cm)
a
surveyed Does Bucks Fawns
1974 — 5,805 253 101 44
1975 — 5,805 261 118 141
1976 — 5,805 334 139 150
1977 — 5,805 298 147 98
1978 — — — — —
1979 — — — — —
1980 — — — — —
1981 — 6,049 184 110 104
1982 10.41 7,942 169 137 76
1983 3.53 9,670 196 136 27
1984 5.06 10,630 293 161 3
1985 16.51 10,630 277 113 113
1986 17.86 11,060 286 131 90
1987 24.71 11,320 323 217 150
1988 5.79 11,320 440 237 62
1989 4.88 11,320 356 276 9
1990 17.60 11,320 331 286 110
1991 16.59 11,320 265 217 78
1992 18.16 11,320 536 339 175
1993 11.63 11,320 453 260 81
1994 14.66 11,320 531 308 80
1995 17.63 11,320 444 378 184
1996 2.11 11,320 372 281 70
1997 22.10 11,320 436 300 296
a
Mean March–May rain = 13.08; CV = 53.7.
DeYoung 1986). During 1977–1998, estimates were made by a single helicopter survey (DeYoung
1985; Beasom et al. 1986) conductedin January each year. The change in census method undoubtedly
introduced additional variability into the time series, as noted for the Chaparral Area. Helicopter
surveys were made using procedures similar to those described for the Faith Ranch and Chaparral
Area, except belt transects were spaced to result in about 50%coverageof the Refuge. The unadjusted
number of deer counted was used for all years (Table 12.3). Breakdowns by class of deer were not
available for all years. However, because an estimate of recruitment was needed for some of the time
series analysis, mean number of embryos per mature doe collected each year for scientific purposes
were substituted for fawns counted during census (Table 12.3).
The first method used to test for density dependence was that suggested by White and Bartmann
(1997, 128). This involved regressing the variable tested for density dependence (V) against the
estimate of number of deer (N
t
) and N
2
t
without an intercept as follows:
V
t
= B
1
N
t
+B
2
N
2
t
and then testing the null hypothesis of B
2
= 0. If the test rejects the null hypotheses and B
2
is less
than 0, then V has been shown to be density dependent.
© 2008 by Taylor & Francis Group, LLC
210 Wildlife Science: Linking Ecological Theory and Management Applications
TABLE 12.2
March–May Rainfall and Number of Deer by
Class, Counted during Fall Spotlight Counts
(1969–75) or Survey by Helicopter (1976–97)
on the Chaparral Wildlife Management Area,
South Texas, USA
March–May
Year rain (cm)
a
Does Bucks Fawns
1969 — 366 108 40
1970 17.55 302 155 158
1971 6.30 257 257 28
1972 22.33 323 245 81
1973 5.94 252 93 76
1974 19.53 250 157 43
1975 18.90 242 106 162
1976 19.99 470 151 84
1977 14.63 476 208 254
1978 15.42 357 198 140
1979 28.17 693 256 146
1980 20.20 262 197 10
1981 35.79 296 115 160
1982 16.92 627 369 113
1983 3.76 337 205 42
1984 5.98 237 177 20
1985 17.76 114 78 59
1986 13.98 195 100 131
1987 16.79 155 128 115
1988 6.22 220 153 81
1989 12.92 176 170 22
1990 20.58 139 118 83
1991 10.50 139 121 83
1992 18.38 191 127 67
1993 16.57 138 131 36
1994 26.38 153 103 35
1995 30.88 137 84 92
1996 5.36 208 116 62
1997 28.65 183 117 160
a
Mean March–May rain = 17.01; CV = 48.4.
For the Faith Ranch time series, all years (21) available were used and V
t
= fawns/405 ha,
whereas N
t
= does/405 ha. The Chaparral Area data consisted of 29 years of time series with V
t
=
number of fawns and N
t
= number of does. For the Welder Refuge, we used 33 years of data (no
counts were available for 1964 and 1969) and V
t
= mean embryos/adult doe, whereas N
t
= number
of deer.
The second method used to test for density dependence was described by Dennis and Otten
(2000). Because Ginnett and Young (2000) showed rainfall influencing fawn: doe ratios in South
Texas, a rainfall term was included in the model. The model used was written as
N
t
= N
t−1
exp(a +bN
t−1
+cW
t−1
+σ Z
t
),
© 2008 by Taylor & Francis Group, LLC
Density Dependence in Deer Populations 211
TABLE 12.3
March–May Rainfall, Deer Density Determined by
Spotlight Counts (1963–76) or January Survey by
Helicopter (1977–98), and Mean Number of Embryos
in Adult Does Collected for Scientific Purposes on the
Welder Wildlife Refuge, South Texas, USA
March–May Embryos/adult
Year rain (cm)
a
Deer/km
2
does (n doe)
1963 1.25 36.27 1.42 (33)
1964 1.96 — 1.54 (13)
1965 18.24 41.37 1.94 (17)
1966 25.40 51.04 1.62 (13)
1967 16.03 34.63 1.52 (25)
1968 25.25 43.37 1.74 (23)
1969 28.58 — 1.89 (18)
1970 20.14 59.62 1.55 (20)
1971 20.65 47.87 1.72 (18)
1972 17.88 32.25 1.50 (14)
1973 38.25 30.25 1.20 (27)
1974 6.53 37.57 1.74 (19)
1975 15.01 39.38 1.60 (20)
1976 25.88 44.10 1.43 (30)
1977 32.00 41.37 1.22 (27)
1978 19.51 32.85 1.38 (13)
1979 24.99 34.69 1.44 (25)
1980 28.32 25.15 1.67 (24)
1981 21.44 28.26 1.47 (19)
1982 28.32 25.15 1.67 (3)
1983 25.17 33.07 1.37 (27)
1984 4.47 25.72 1.62 (29)
1985 29.36 21.29 1.58 (26)
1986 18.52 27.50 1.68 (19)
1987 13.08 33.07 1.64 (33)
1988 22.23 25.60 1.68 (19)
1989 16.33 16.35 1.70 (20)
1990 15.70 18.56 1.53 (19)
1991 14.78 21.35 1.75 (20)
1992 39.70 21.54 1.73 (11)
1993 48.79 31.11 1.72 (18)
1994 43.74 20.59 1.54 (13)
1995 15.60 21.04 1.78 (18)
1996 10.41 28.20 1.79 (14)
1997 27.38 30.29 1.75 (20)
1998 17.83 — —
a
Mean March–May rain = 21.63; CV = 49.7.
where N
t
is deer abundance (density in the case of the Faith Ranch) at time t (year: t = 0, 1, 2, …,
number of years in time series), W
t
is spring (March, April, and May) rainfall total (cm) for time t,
and Z
t
is standard noise (with Z
1
, Z
2
, uncorrelated). Unknown parameters to be estimated from the
data were a, b, c, and σ . The random variables Z
t
represent unpredictable fluctuations in growth rate
© 2008 by Taylor & Francis Group, LLC
212 Wildlife Science: Linking Ecological Theory and Management Applications
(logarithmic) over and above fluctuations accounted for by density dependence and precipitation.
Under this model, the population abundances N
t
(t = 1, 2, …) are random variables correlated
through time, and N
o
is fixed. See Dennis and Otten (2000) for details on methodology.
Four casesof themodel werefittedto thedata foreach studyareaas separatestatistical hypotheses:
H
0
: b = 0 and c = 0 (no density dependence, no rainfall effect); H
1
: b = 0 and c = 0 (density
dependence, no rainfall effect); H
2
: b = 0 and c = 0 (no density dependence, rainfall effect); and
H
3
: b = 0 and c = 0 (density dependence, rainfall effect).
We calculated maximum-likelihood estimates of unknown parameters in the model for all four
hypotheses using time series data from each study area in conjunction with rainfall data (Dennis and
Otten 2000). Because of missing years in the time series, for the Faith Ranch we used data from
1982 to 1997 (16 years) and for the Welder Refuge data from 1970 to 1997 (28 years) were used.
We tested for density dependence and rainfall effects on density (deer/405 ha) of total deer, adult
deer, does, bucks, and fawns using the four hypotheses on the Faith Ranch. We tested for density
dependence and rainfall effects on total number of deer, adult deer, does, bucks, and fawns for the
Chaparral Wildlife Management Area. For the Welder Refuge, we tested for density dependence and
rainfall effects on total number of deer and mean number of embryos per adult doe (although fall
rather than spring rainfall may have more influence on embryos/doe).
Statistical hypotheses were tested using parametric bootstrapping (Dennis and Taper 1994). Four
statistical hypothesis tests were conducted for the density dependence–rainfall model, as follows:
H
0
versus H
1
,H
0
versus H
2
,H
1
versus H
3
, and H
2
versus H
3
. For these tests, the null model is
contained within the alternative model as a special case, and is obtained by setting one parameter
equal to 0. Details of this approach are in Dennis and Taper (1994) and Dennis and Otten (2000).
Analysis of the time series by the method suggested by White and Bartmann (1997) showed no
density dependence on the Faith Ranch, but did indicate that density dependence was operating at
Chaparral and Welder (Table 12.4). The model for Chaparral was heavily influenced by very high
census counts in 1979 and 1982 (Table 12.2). If these data points are omitted, density dependence is
not indicated (P = .247).
Covariance analysis by the method of Dennis and Otten (2000) showed a similar trend to the
White andBartmann (1997) model (Tables 12.5–12.8). For theFaith Ranch, hypothesis tests provided
no support for density dependence either with a rainfall covariate (H
2
versus H
3
, P ≥ .26) or without
the rainfall covariate (H
0
versus H
1
, P ≥ .15) for any response variable. For the Chaparral Area,
TABLE 12.4
Tests for Density Dependence in Time Series of Deer Abundance and
Reproduction Using the Method Suggested by White and Bartmann
(1987) for the Faith Ranch, Chaparral Wildlife Management Area, and
Welder Wildlife Refuge, South Texas, USA
Study area
Number of years
in series Variables NN
2
Faith Ranch 21 V
1
= fawn density 0.2063 0.0071
N
t
= doe density t = 0.76
P > 0.05
Chaparral Area 29 V
t
= fawns 0.4438 −0.0004
N
t
= does t =−1.99
P = 0.028
Welder Refuge 33 V
t
= embryos/ad. doe 0.0925 −0.0012
N
t
= deer t =−9.85
P < 0.0001
© 2008 by Taylor & Francis Group, LLC
Density Dependence in Deer Populations 213
TABLE 12.5
Maximum-Likelihood Estimates (a, b, c, o
2
) of Parameters in
a Density Dependence–Spring Rainfall Model, Generalized
R
2
, and Schwartz Information Criterion (SIC) for Four Model
Hypotheses (H) Fitted to White-Tailed Deer Density Data
Obtained by Helicopter Survey for 1982–97, Faith Ranch,
South Texas, USA
Variable H
a
ˆ
a
ˆ
b
ˆ
c
ˆ
o
2
R
2
SIC
Total deer H
0
.02039 .0701 .000 8.4
H
1
.49285 −.01905 .0554 .206 7.4
H
2
−.28192 .05198 .0454 .368 4.3
H
3
.12259 −.01491 .05198 .0367 .485 3.6
Adult deer H
0
.01819 .0500 .000 3.0
H
1
.37703 −.01682 .0415 .352 2.8
H
2
−.22287 .02546 .0453 .285 4.2
H
3
.23395 −.01576 .022354 .0380 .418 4.2
Does H
0
.01476 .0668 .000 7.6
H
1
.48876 −.03679 .0520 .187 6.4
H
2
−.0723 .01691 .0647 −.011 9.9
H
3
.40280 −.03657 .016140 .0502 .219 8.6
Bucks H
0
.02355 .0597 .000 5.9
H
1
.33479 −.03680 .0510 .461 6.1
H
2
−.17941 .039428 .0485 .466 5.3
H
3
.10217 −.03008 .034140 .0430 .560 6.1
Fawns H
0
.02621 2.2772 .000 64.1
H
1
1.34218 −.38023 1.6934 −.153 62.2
H
2
−1.98586 .339087 1.1841 −2.028 56.4
H
3
−.88778 −.22992 .332133 .9954 −.641 56.4
a
H
0
= No density dependence, no rainfall effect; H
1
= density dependence, no
rainfall effect; H
2
= no density dependence, rainfall effect; and H
3
= density
dependence, rainfall effect.
Note: See Dennis and Otten (2000) for details on methodology. Table 12.1 contains
rainfall and census data.
hypothesis tests provided support for density dependence both with the rainfall covariate (H
2
versus
H
3
, P ≤ .06) and without the rainfall covariate (H
0
versus H
1
, P ≤ .06) for all response variables
(Table 12.8). Hypothesis tests also supported density dependence with and without the rainfall
covariate on the Welder Refuge for total deer (P = .05) and for embryos/adult doe (P ≤ .002).
Both methods of time series analysis suggested the same trend for data from the three study areas:
no density dependence detected for the Faith Ranch, modest indications of density dependence on the
ChaparralArea, and a stronger density-dependence indication for Welder Refuge. Shenk et al. (1998)
criticized the methods of Dennis and Otten (2000) for detecting density dependence in time series
data. They concluded that sampling error would result in a high probability of Type II error. There
is without doubt much sampling error in the deer census data we collected. We did (unpublished)
simulations of the regression approach of White and Bartmann (1997), which also showed a high
propensity for Type II error. This is why we used two methods to analyze the time series and the fact
that they yielded similar results was encouraging.
These resultsare correlated with arainfall gradient withlower rainfall on theFaith Ranch (54.6cm
average annual) and higher rainfall as the coast is neared on the east (Welder Refuge = 88.9 cm
annually). Ginnett and Young (2000) demonstrated correlations between spring–summer rainfall and
© 2008 by Taylor & Francis Group, LLC
214 Wildlife Science: Linking Ecological Theory and Management Applications
TABLE 12.6
Maximum-Likelihood Estimates (a, b, c, o
2
) of Parameters in a
Density Dependence–Spring Rainfall Model, Generalized R
2
,and
Schwartz Information Criterion (SIC) for Four Model Hypotheses
(H) Fitted to White-Tailed Deer Abundance Data Obtained by
Spotlight Counts (1969–75) or Surveys by Helicopter (1976–97),
Chaparral Wildlife Management Area, South Texas, USA
Variable H
a
ˆ
a
ˆ
b
ˆ
c
ˆ
o
2
R
2
SIC
Total deer H
0
.00396 .1168 .000 26.0
H
1
.41524 −.0081 .857 .296 20.7
H
2
−.22044 .03199 .1061 .070 26.6
H
3
.24189 −.00074 .02019 .0817 .348 22.7
Adult deer H
0
−.01634 .1403 .000 31.1
H
1
.38517 −.00093 .1069 .262 26.9
H
2
−.07342 .00843 .1395 −.053 34.3
H
3
.40137 −.00094 .00200 .1069 .258 30.2
Does H
0
−.02476 .1672 .000 36.1
H
1
.36788 −.00143 .1263 .286 31.5
H
2
−.15460 .01919 .1634 −.008 38.7
H
3
.29833 −.00139 .00889 .1255 .304 34.7
Bucks H
0
.00286 .1897 .000 39.6
H
1
.57366 −.00368 .1306 .076 32.5
H
2
.05956 −.00838 .1889 −.445 42.8
H
3
.75981 −.00388 −.02285 .1254 .085 34.6
Fawns H
0
.04951 1.2285 .000 90.9
H
1
1.15667 −.01279 .7302 −.260 80.7
H
2
−1.14187 .17609 .9051 −1.126 86.7
H
3
.15371 −.01064 .12072 .5923 −.107 78.1
a
H
0
= No density dependence, no rainfall effect; H
1
= density dependence, no rainfall
effect; H
2
= no density dependence, rainfall effect; and H
3
= density dependence, rainfall
effect.
Note: See Dennis and Otten (2000) for details on methodology. Table 12.2 contains rainfall
and census data.
fawn:doe ratios followed a west–east gradient across Texas, and this may be a driving factor in the
gradient of density dependence found in the time series analysis. They presented graphs showing
the rainfall-fawn production correlation was strong in the west and declined in strength to become
essentially nonexistent in east Texas. Thus, if it does not rain in the spring–summer in western
South Texas (Faith Ranch), fawn survival declines. Perhaps this happens frequently enough to
prevent populations with a plateau phase from building close to K and exhibiting density-dependent
behavior. Following Ginnett and Young (2000), the rainfall–fawn survival relationship becomes
weaker in eastern South Texas (Welder Refuge), but remains evident.
Mean March–May rainfall over a period of years on the Faith Ranch, Chaparral Area, and
Welder Refuge was 13.08, 17.01, and 21.63 cm, respectively (Tables 12.1–12.3). We chose to
work with March–May for a finer breakdown of the annual cycle versus the March–July period
used by Ginnett and Young (2000). Interestingly, although the mean amount of rain declined from
east to west, the variation in spring rainfall was nearly identical across the three areas. The CV
for March–May rainfall was 53.7, 48.4, and 49.7% for Faith Ranch, Chaparral Area, and Welder
Refuge, respectively (Tables 12.1–12.3). McCullough (1992) reviewed the impact of environmental
© 2008 by Taylor & Francis Group, LLC
Density Dependence in Deer Populations 215
TABLE 12.7
Maximum-Likelihood Estimates (a , b, c, o
2
) of Parameters in a
Density Dependence–Spring Rainfall Model, Generalized R
2
,and
Schwartz Information Criterion (SIC) for Four Model Hypotheses
(H) Fitted to White-Tailed Deer Density Data Obtained by Spotlight
Counts (1963–1976) or January Surveys by Helicopter (1977–1998)
or Embryos/Adult Doe, Welder Wildlife Refuge, South Texas, USA
Variable H
a
ˆ
a
ˆ
b
ˆ
c
ˆ
o
2
R
2
SIC
Total Deer H
0
−.03851 .0611 .000 7.9
H
1
.34037 −.01247 .0468 .419 3.8
H
2
−.06762 .003319 .0609 .241 11.1
H
3
.31865 −.01244 .002356 .4680 .442 7.0
Embryos/adult doe H
0
−.00490 .0186 .000 −33.1
H
1
.81994 −.51258 .0112 .032 −47.2
H
2
.07818 −.00942 .0170 −.556 −32.0
H
3
.81265 −.48286 −.00482 .0108 .053 −44.9
a
H
0
= No density dependence, no rainfall effect; H
1
= density dependence, no rainfall effect;
H
2
= no density dependence, rainfall effect; and H
3
= density dependence, rainfall effect.
Note: See Dennis and Otten (2000) for details on methodology. Table 12.3 contains rainfall,
density, and embryo data.
stochasticity on densitydependence in ungulate populations.Additionally, McCullough(2001)found
density-dependent behavior in black-tailed deer occupying a variable environment but with a high
average annual rainfall (95 cm).
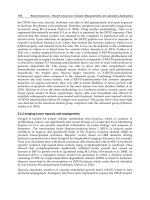
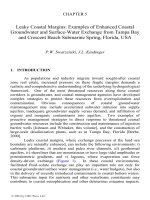
As a hypothesis for future research, we attempted to fit our three South Texas study areas to
McCullough’s (1999) models (Figure 12.1). Fetal rates (Table 12.3) for the Welder Wildlife Refuge
provided a means to scale this population relative to K over a long period. We used the generalized
sustained yield table in Downing and Guynn (1985), which scales fawns/adult doe to various per-
centages of K. Plugging the fetal rates (Table 12.3) into Downing and Guynn’s (1985) table indicated
that the Welder Refuge deer population has exceeded 50% K over most of the time series, except
during the late 1960s and most of the 1990s (Figure 12.3). We used 50% of K as an arbitrary cut-off,
above which the population would express density-dependent responses and below which it would
not. In other words, in the context of McCullough’s (1999) models (Figure 12.1), we assumed a
plateau below 50% K and a ramp above this level. Given these assumptions, and strong indica-
tions of density dependence in the time series analyses, we hypothesize that the Welder Refuge deer
population approximates Figure 12.1B and b.
Although our time series analysis failed to detect densitydependenceatthe Faith Ranch, the west-
ernmost population we analyzed, we hypothesize that this population occasionally builds up enough
to exhibit density-dependent behavior. Thus, we posit that the Faith Ranch population approximates
the models in Figure 12.1C and c. This would leave the Chaparral Area population somewhere in
the middle as far as density-dependent behavior is concerned.
FOUNDATION THEORY AND MANAGEMENT
RELEVANCE
Researchers commonly debate whether deer populations are density dependent or density independ-
ent as if they are competing population models. McCullough (1992) observed that all populations
© 2008 by Taylor & Francis Group, LLC
216 Wildlife Science: Linking Ecological Theory and Management Applications
TABLE 12.8
Results of Statistical Hypothesis Tests of Influence of Density Dependence and
March–May Rainfall on Time Series of Abundance in South Texas White-Tailed
Deer Populations
Study area
a
Test
b,c
Stat. Total deer Adults Does Bucks Fawns Embryos/doe
F1t −1.93 .412 .287 .481 .154
P .310 −1.69 −1.99 −1.54 −2.20
2 t 2.76 1.20 .67 1.79 3.60
P .015 .251 .517 .095 .003
3 t 2.57 1.10 .695 1.56 3.02
P .047 .448 .599 .293 .012
4 t −1.76 −1.59 −1.94 −1.30 −1.57
P .286 .406 .265 .515 .261
C1t −3.07 −2.85 −2.90 −3.43 −4.24
P .034 .057 .049 .016 .002
2 t 1.62 .37 .78 −.32 3.05
P .118 .713 .441 .754 .005
3 t 1.11 −.10 .40 -1.02 2.41
P .368 .934 .747 .376 .024
4 T −2.73 2.76 −2.75 −3.56 −3.63
P .064 .064 .061 .011 .006
W1t −2.81 −4.66
P .050 .001
2 t .29 −1.77
P .776 .086
3 t .23 −1.09
P .854 .307
4 t −2.75 −4.27
P .052 .002
a
F = Faith Ranch; C = Chaparral Wildlife Management Area; and W = Welder Refuge.
b
1 = H
0
versus H
1
;2= H
0
versus H
2
;3= H
1
versus H
3
; and H
2
versus H
3
.
c
H
0
= No density dependence, no rainfall effect; H
1
= density dependence, no rainfall effect; H
2
= no density
dependence, rainfall effect; and H
3
= density dependence, rainfall effect.
Note: Tables 12.1–12.3 contain time series and rainfall data. Tables 12.4–12.6 contain maximum-likelihood
estimates of parameters, alongwith generalized R
2
and Schwartz information criterion fora density dependence–
rainfall model. See Dennis and Otten (2000) for details.
experience periods of density dependence and density independence. This is better than considering
the two as competing models, but still leads to some confusion as to the underlying theoretical infra-
structure. Because food-limited intraspecific competitionhas commonly beendemonstrated, weposit
that a food-limited, density-dependent model is the best theoretical underpinning for all Odocoileus
populations. However, just because a population’s behavior is being understood through a food-
limited, density-dependent model does not mean that the population is always expressing density-
dependent responses. In other words, a population does not have to be expressing density dependence
to be understood within a density-dependent model context. This is a subtle but important point.
McCullough (1999) proposed hypotheses for populations that have a plateau and a ramp in
the density-dependent function. He proposed that mule deer and desert mule deer are among the
ungulates that may have populations with this type of curve. He stated that such populations may
not reach K very often because of low intrinsic rate of increase, high environmental variability,
© 2008 by Taylor & Francis Group, LLC
Density Dependence in Deer Populations 217
100
80
60
40
20
0
67 72 77 82 87 92 97
Year
Welder Refuge
Percent K
FIGURE 12.3 Five-year running average of percent K carrying capacity estimated for a white-tailed deer
population on the Rob and Bessie Welder Wildlife Refuge, South Texas, USA, 1967–97. Percent K was
estimated from fawns in utero of adult does collected annually on the refuge, using the percent K scaling table
of Downing and Guynn (1985).
large home ranges in homogenous habitat, or habitats with low-quality forage. Such populations
would not show density-dependent response at densities where they are on the plateau phase of the
density-dependent function. We have proposed, based on analysis of the South Texas time series, that
white-tailed deer populations in some environments will also exhibit a plateau and ramp function.
However, during favorable times, such as a string of wet years, plateau and ramp populations can
build close enough to K where they function as density dependent (Figure 12.1b and c).
We argue that it is better conceptually to consider plateau and ramp populations within a food-
based, density-dependent model, recognizing that, for many reasons, deer may spend much of
their time in the plateau phase. The frequency with which such populations occupy the ramp phase
determines whether predictions based on a density-dependent model will be useful to managers.
We believe that populations such as the white-tailed deer on the Welder Refuge could be managed
with the expectation of density-dependent behavior. However, for populations such as the Chaparral
Area, and certainly the Faith Ranch, a manager would seldom expect a density-dependent model to
be predictive.
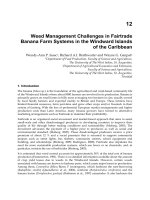
A smoothed plot of the three South Texas populations over the time series of population counts
is shown in Figure 12.4. Deer density is always considerably higher on the more productive habitat
of the Welder Refuge. Densities of all populations peaked in the late 1970s, which was the wettest
string of years in the twentieth century for the South Texas region (DeYoung 2001). During this
time of relatively high population density, all three populations may have been in the ramp phase.
However, this rainy period was followed by more typical rainfall patterns in the 1980s and 1990s,
when densities of all populations declined. Likely, the Faith Ranch and Chaparral Area were in the
plateau phase during this time, and the Welder Refuge may also have been at times (Figure 12.4).
Afrequently repeated statement in theliteratureis that density-dependent behavior, while present,
is difficult for researchers to detect (McCullough 1999). Researchers can allocate more resources to
population work than managers in most cases can. If researchers cannot detect density dependence,
© 2008 by Taylor & Francis Group, LLC
218 Wildlife Science: Linking Ecological Theory and Management Applications
50
40
30
20
10
0
1970 1975 1980 1985
Welder Wildlife Refuge
Chaparral Wildlife Management Area
Faith Ranch
Missing years
Years
Deer per square kilometer
1990 1995 2000
???
?
?
??
FIGURE 12.4 Three-year running average of counts of deer/km
2
on three South Texas, USA, study areas.
even though it is present, then a density-dependent model would be inadequate for managers to rely
upon forsuch populations. Therefore, in additionto no density-dependentresponses from populations
in a plateau phase, there are presumably frequent circumstances where density dependence is present
but masked. A density-dependent model is not useful to a manager in either situation except as an
underpinning theory or a component of a more complex model.
This led us to wonder what a map of Odocoileus range would look like with regions for “density-
dependent model likely predictive” and “density-dependent model likely not predictive.” Shea and
Osborne (1995) surveyed state and provincial wildlife departments within white-tailed deer range
in the United States and Canada and asked them to identify “sub-optimal habitats.” With these data,
they produced a map of such habitats, where density-dependent population responses may not occur.
We extended this map by also including habitats with high precipitation variability and habitats
where occasional severe winters limit deer populations.
To construct the map, we first obtained ranges for white-tailed deer and mule deer from Hef-
felfinger (2006) (Figure 12.5). For simplicity, only the ranges in the lower 48 states of the United
States were used. We superimposed on the range map the suboptimal habitats from Shea and Osborne
(1995). To approximate areas with variable environments, we mapped two variables. First, we con-
structed a grid with 100 squares across the United States. Then we selected the U.S. Weather Station
nearest the center of each grid and obtained 30 years of annual precipitation records. We calculated
the coefficient of variation (CV) from these data and superimposed on the deer range map areas with
aCV≥ 30% (Figure 12.5). This level of variation in annual precipitation was selected based on the
approximate CV for the Faith Ranch, where we detected no density dependence in the time series.
The second variable we selected was a measure of winter severity. For simplicity, we used mean
minimum air temperature for January, averaged over 30 years. We used temperature data from the
U.S. Weather Stations of “cold grid squares” identified previously for precipitation variation. We
arbitrarily selected mean minimum January air temperature of ≤−12
◦
C as the cut-off for the “cold
winter” variable and superimposed these areas on the deer range map (Figure 12.5).
© 2008 by Taylor & Francis Group, LLC
Density Dependence in Deer Populations 219
0 500 1000 2000 KM
White-tailed and mule deer distribution
Precipitation coefficient of variation (≥30%)
Poor habitat
Mean minimum January temperature ≤−12°C
N
FIGURE 12.5 Map of lower 48 states of the United States showing areas where simple density-dependent
population models may not be useful to managers. (White-tailed Deer and Mule Deer Distribution: From
Heffelfinger, J. 2006. Deer of the Southwest. Texas A&M University Press. With permission; Poor Habitat:
From Shea, S. M., and J. S. Osborne. 1995. Poor-quality habitats. In Quality Whitetails: The Why and How of
Quality Deer Management, K. V. Miller, and R. L. Marchinton (eds). Mechanicsburg: Stackpole Books. With
permission.)
The completed map (Figure 12.5) indicates that approximately 59% of Odocoileus deer range
in 48 states of the United States may not be suitable for density-dependent management models.
Obviously, this map is a crude first approximation. It is a hypothesis thatneedsrefining with empirical
data. There are certainly deer populations inthevariable environments that exhibit density-dependent
responses on a regular basis. However, the map also shows that there are substantial areas where
density-dependent management models will not be predictive.
So, what is a deer manager in a variable environment to do? McCullough (1984) proposed an
ad hoc strategy for such situations. He stated that management decisions would need to be more
on a yearly basis in response to the immediate environmental conditions when lacking a predictive
longer-term model to follow. Mackie et al. (1990) similarly advocated annually surveying population
size and performance to guide management decisions. Hopefully, our technology for predicting the
behavior of deer populations in variable environments can improve beyond an ad hoc strategy.
A principle value of predictive density-dependent models is their simplicity. Future models should
be developed by researchers for managers that apply to variable environments. A density-dependent
variable that switches on in the model when a fluctuating population builds close to K should be
basic. However, future models will almost assuredly need to be more complex, and they will likely
need to include at least one other term such as a weather variable or a plant variable. There are
empirical studies that have shown strong correlation between broad vegetation variables such as
forb biomass and deer population performance or carrying capacity (Strickland 1998). Patterson and
Power (2002) developed a model that explained 80% of population variation for white-tailed deer
© 2008 by Taylor & Francis Group, LLC
220 Wildlife Science: Linking Ecological Theory and Management Applications
in Nova Scotia, Canada. Their model included a density-dependent term, harvest term, and a term
for winter weather.
In summary, density-dependence effects in Odocoileus deer are complex. Some populations
show effects most of the time, others very seldom. The pattern for a particular population may
change over long time horizons. Arguing whether deer populations are density dependent or density
independent is overly simplistic. Food-limited, density-dependent models are the simplest and most
useful theoretical construct until modeling technology advances. However, because populations may
be held in the plateau phase of the density-dependent function by density-independent factors, there
may be no negative feedback from food competition. Such models, while theoretically useful, are
not always predictive and thus useful to managers. Also, density dependence may be acting in the
mix of factors impinging on a population, but be obscured. The result for managers is the same.
Regions where simple density-dependent models are not useful to managers because of environ-
mental variation may be more extensive than most have realized. More research is needed to support
or refute this hypothesis. In the meantime, researchers should develop for managers more complex
predictive models with a density-dependent factor and a least one factor that integrates as much of
the environmental variation as feasible.
ACKNOWLEDGMENTS
Large-scale ecological research, such as that presented in this paper, cannot be done without the
support of many individuals, including landowners, colleagues, and students. The authors thank all
individuals who made this research possible and D. Guynn, who reviewed a draft of the paper.
REFERENCES
Ansotegui, R. P., and A. L. Lesperance. 1973. Effect of precipitation patterns on forage quality. Proc. W. Sec.
Am. Soc. Ani. Sci. 24:229.
Ballard, W. B., et al. 2001. Deer–predator relationships: A review of recent North American studies with
emphasis on mule and black-tailed deer. Wildl. Soc. Bull. 29:99.
Bartmann, R. M., G. C. White, and L. H. Carpenter. 1992. Compensatory mortality in a Colorado mule deer
population. Wildl. Monogr. 121.
Beasom, S. L. 1974. Relationships between predator removal and white-tailed deer net productivity. J. Wildl.
Manage. 38:854.
Beasom, S. L., F. G. Leon, III, and D. R. Synatzske. 1986. Accuracy and precision of counting white-tailed deer
with helicopters at different sampling intensities. Wildl. Soc. Bull. 14:364.
Blankenship, T. L. 2000. Ecological response of bobcats to fluctuating prey populations on the Welder Wildlife
Foundation Refuge. PhD Thesis, Texas A&M University, College Station and Texas A&M University -
Kingsville, Kingsville, TX.
Box, T. W. 1960. Herbage production in forage range plant communities in South Texas. J. Range Manage.
13:72.
Brothers, A., and M. E. Ray, Jr. 1975. Producing Quality Whitetails, 1st edn. Laredo: Wildlife Services.
Carroll, B. K., and D. L. Brown. 1977. Factors affecting neonatal fawn survival in southern-central Texas.
J. Wildl. Manage. 41:63.
Cook, R. S., et al. 1971. Mortality of young white-tailed deer fawns in South Texas. J. Wildl. Manage. 35:47.
Davis, R. B., and R. L. Spicer. 1965. Status of the practice of brush control in the Rio Grande Plain. Final Rep.
Fed. Aid Proj. W-84-R, Texas Parks & Wildlife Department, Austin.
Dennis, B., and M. R. Otten. 2000. Joint effects of density dependence and rainfall on abundance of San Joaquin
kit fox. J. Wildl. Manage. 64:388.
Dennis, B., and M. L. Taper. 1994. Density dependence in time series observations of natural populations:
estimation and testing. Ecol. Monogr. 64:205.
DeYoung, C. A. 1985. Accuracy of helicopter surveys of deer in South Texas. Wildl. Soc. Bull. 13:146.
© 2008 by Taylor & Francis Group, LLC
Density Dependence in Deer Populations 221
DeYoung, C. A. 2001. Predator control in deer management: South Texas. In Proceedings of the Symposium
on the Role of Predator Control as a Tool in Game Management. College Station, TX: Tex. Ag. Exten.
Serv.
Doughty, R. W. 1983. Wildlife and Man in Texas, 1st edn. College Station, TX: Texas A&M University
Press.
Downing, R. L., and D. C. Guynn, Jr. 1985. A generalized sustained yield table for white-tailed deer. In Game
harvest management. S. L. Beasom, and S. F. Robrson (eds). Kingsville: Caesar Kleberg Wildlife
Research Institute, Texas A&M University - Kingsville, p. 95.
Dumont, A., et al. 2000. Population dynamics of northern white-tailed deer during mild winters: evidence of
regulation by food competition. Can. J. Zool. 78:764.
Fafarman, K. R., and C. A. DeYoung. 1986. Evaluation of spotlight counts of deer in South Texas. Wildl. Soc.
Bull. 14:180.
Foster, W. C. 1998. The La Salle Expedition to Texas: The Journal of Henri Joutel 1684–1687, 1st edn. Austin:
Tex. State Hist. Assoc., Center for Studies in Tex. Hist., University of Texas at Austin.
Fryxell, J. M., et al. 1991. Time lags and population fluctuations in white-tailed deer. J. Wildl. Manage. 55:377.
Fulbright, T. E. 2001. Human induced vegetation changes in the Tamaulipan semiarid scrub. In Changing Plant
Life in La Frontera, G. L. Webster, and C. J. Bahre (eds). Albuquerque: University of New Mexico
Press, p. 166.
Gilbert, B. A., and K. J. Raedeke. 2004. Recruitment dynamics of black-tailed deer in the western Cascades. J.
Wildl. Manage. 68:120.
Ginnett, T. F., and E. L. B. Young. 2000. Stochastic recruitment in white-tailed deer along an environmental
gradient. J. Wildl. Manage. 64:713.
Harveson, L. A. 1997. Ecology of a mountain lion population in southern Texas. PhD Thesis, Texas A&M
University - Kingsville, College Station.
Heffelfinger, J. 2006. Deer of the Southwest. College Station: Texas A&M University Press.
Helmer, J. A. 2002. Boone and Crockett whitetails: a geographic analysis. Fair Chase. 17:34.
Inglis, J. M. 1964. A history of vegetation on the Rio Grande Plain. Bulletin 45, Texas Parks and Wildlife
Department, Austin.
Jones, F. B. 1975. Flora of the Texas Coastal Bend, 1st edn. Sinton: Rob and Bessie Welder Wildlife Foundation.
Keyser, P. D., D. C. Guynn, Jr., and H. S. Hill, Jr. 2005. Density-dependent recruitment patterns in white-tailed
deer. Wildl. Soc. Bull. 33:222.
Kie, J. G., and M. White. 1985. Population dynamics of white-tailed deer (Odocoileus virginianus)onthe
Welder Wildlife Refuge, Texas. Southwest. Nat. 30:105.
Lehmann, V. W. 1969. Forgotten Legions: Sheep in the Rio Grande Plains of Texas. El Paso: Western Press.
Mackie, R. J., et al. 1990. Compensation in free-ranging deer populations. Trans. N. Am. Wildl. Nat. Res. Conf.
55:518.
Macnab, J. 1985. Carrying capacity and related slippery shibboleths. Wildl. Soc. Bull. 13:403.
McCullough, D. L. 1979. The George Reserve Deer Herd. Ann Arbor, MI: The University Michigan Press.
McCullough, D. L. 1982. Population growth rate of the George Reserve deer herd. J. Wildl. Manage. 46:1079.
McCullough, D. L. 1983. Rate of increase of white-tailed deer on the George Reserve: a response. J. Wildl.
Manage. 47:1248.
McCullough, D. L. 1984. Lessons from the George Reserve, Michigan. In White-tailed deer: Ecology and
Management, L. K. Halls (ed.). Mechanicsburg: Stackpole Books, p. 211.
McCullough, D. L. 1990. Detecting density dependence: filtering the baby from the bathwater. Trans. N. Am.
Wildl. Nat. Res. Conf. 55:534.
McCullough, D. L. 1992. Concepts of large herbivore population dynamics. In Wildlife 2001: Populations,D.
L. McCullough, and R. H. Barrett (eds). New York: Elsevier Applied Science, p. 967.
McCullough, D. L. 1999. Density dependence and life-history strategies of ungulates. J. Mammal. 80:1130.
McCullough, D. L. 2001. Male harvest in relation to female removals in a black-tailed deer population. J. Wildl.
Manage. 65:46.
Meyer, M. W., R. D. Brown, and M. W. Graham. 1984. Protein and energy content of white-tailed deer diets in
the Texas Coastal Bend. J. Wildl. Manage. 48:527.
Norwine, J., and R. Bingham. 1985. Frequency and severity of droughts in South Texas: 1900–1983. In
Proceedings of a Workshop on Livestock and Wildlife Management during Drought, R. D. Brown (ed.).
Kingsville: Caesar Kleberg Wildlife Research Institute, Texas A&M University - Kingsville, p. 1.
© 2008 by Taylor & Francis Group, LLC
222 Wildlife Science: Linking Ecological Theory and Management Applications
Patterson, B. R. and V. A. Power. 2002. Contributions of forage competition, harvest, and climate fluctuation
to changes in population growth of northern white-tailed deer. Oecologia 130:62.
Shea, S. M., and J. S. Osborne. 1995. Poor-quality habitats. In Quality Whitetails: The Why and How of Quality
Deer Management, K. V. Miller, and R. L. Marchinton (eds). Mechanicsburg: Stackpole Books, p. 193.
Shea, S. M., T. A. Breault, and M. L. Richardson. 1992. Herd density and physical condition of white-tailed
deer in Florida flatwoods. J. Wildl. Manage. 56:262.
Shenk, T. M., G. C. White, and K. P. Burnham. 1998. Sampling-variance effects ondetecting density dependence
from temporal trends in natural populations. Ecol. Monogr. 68:445.
Short, H. L. 1979. Deer in Arizona and New Mexico: Their ecology and a theory explaining recent population
decrease. Gen. Tech. Rep. RM-70, Department of Agriculture, Rocky Mountain Forest and Range
Experiment Station, Washington, DC.
Strickland, B. K. 1998. Using tame white-tailed deer to index carrying capacity in South Texas. MS Thesis,
Texas A&M University - Kingsville, Kingsville.
Van Auken, O. W. 2000. Shrub invasions of NorthAmerican semiarid grasslands. Annu. Rev. Ecol. Syst. 31:197.
White, G. C., and R. M. Bartmann. 1997. Density dependence in deer populations. In The Science of Over-
abundance, W. J. McShea, H. B. Underwood, and J. H. Rappole (eds). Washington, DC: Smithsonian
Institution Press, p. 120.
© 2008 by Taylor & Francis Group, LLC