Product Design for the Environment: A Life Cycle Approach - Chapter 12 pot
Bạn đang xem bản rút gọn của tài liệu. Xem và tải ngay bản đầy đủ của tài liệu tại đây (438.68 KB, 22 trang )
325
Chapter 12
Environmental Characterization of Materials
and Optimal Choice
A product’s environmental impact is directly infl uenced by the environmental
properties of the materials used, such as energy costs, emissions involved in
production and manufacturing phases, and recyclability. The choice of materi-
als, therefore, assumes strategic importance and requires an extension of the
characterization of materials, integrating conventional characterization (aimed
at defi ning physical–mechanical properties) with a complete characterization
of environmental behavior. To enable the designer to make an optimal choice
of materials that harmonizes performance characteristics and properties of
eco-compatibility, the selection process must take account of a wide range of
factors: constraints of shape and dimension, required performance, techno-
logical and economic constraints associated with the manufacturability of
materials, and environmental impacts of all the phases of the life cycle.
In accordance with the Life Cycle Design approach, this chapter proposes
a defi nition of the environmental characterization of materials and processes,
and a systematic method that introduces environmental considerations in
the selection of the materials used in components. This defi nition and method
are directed at meeting functional and performance requirements while
minimizing the environmental impact associated with the product’s entire
life cycle. The proposed selection procedure elaborates data on the conven-
tional and environmental properties of materials and processes, relates this
data to the required performance of product components, and calculates the
values assumed by functions that quantify the environmental impact over
the whole life cycle and the cost resulting from the choice of materials. As
shown in the case study presented, the results can then be evaluated using
multiobjective analysis techniques.
12.1 Materials Selection and Environmental Properties
“New materials inspire designers; but even more, design drives material
development” (Ashby, 2001). This statement highlights the close connection
2722_C012_r02.indd 3252722_C012_r02.indd 325 11/30/2005 1:51:56 PM11/30/2005 1:51:56 PM
© 2006 by Taylor & Francis Group, LLC
between materials and the design activity, confi rmed by the signifi cance of
the issues related to the effi cient integration of materials selection in the
product development process (Edwards, 2003; Lu and Deng, 2004).
The enormous variety of materials available for engineering applications and
the complexity of the requirements conditioning the choice of the most appro-
priate materials and processes lead to a taxing problem of multiple-criterion
optimization (Brechet et al., 2001). In recent years, several systematic methods
have been proposed to help the designer in the selection of materials and
processes (Charles et al., 1997; Farag, 1997; Asbhy et al., 2004). Of the more com-
monly used quantitative selection methods, that developed by Ashby is based
on the defi nition of material indices consisting of sets of physical–mechanical
properties which, when optimized, maximize certain performance aspects of
the component under examination (Ashby and Cebon, 1995). Defi ning these
indices makes it possible to compile selection charts summarizing the relations
between properties of materials and engineering requirements (Ashby, 1999).
Usually taking into consideration the physical-mechanical properties of
materials, these selection charts can be extended to introduce some environ-
mental properties (Navin-Chandra, 1991). From this standpoint, several impor-
tant studies have been based on the development of indices able to express the
environmental performance of materials by introducing the energy consump-
tion and emissions (into the atmosphere or water) associated with the materi-
als (Holloway, 1998), or eco-indicators developed on the basis of Life Cycle
Assessment methods (Wegst and Ashby, 1998). An alternative approach is that
of translating environmental impact in terms of economic cost of production,
introducing functions of environmental cost such as energy consumption and
toxicity that depend on the properties of the materials (Chen et al., 1994).
All the methods proposed are limited to quantifying the environmental
impact of the choice of materials on the basis of their environmental properties
associated with the production phase. Only a few studies have considered the
infl uence of the choice of materials on the impact associated with the working
life of the component (Kampe, 2001). To date, the problem of choice of materials
from the viewpoint of Life Cycle Design (taking into account the environmental
impacts involved in all phases of the life cycle, from production to retirement)
has been considered only in general terms, with the aim of defi ning guidelines
for choices that integrate properties of materials, manufacturing demands, and
end-of-life impacts, and suggesting a distinction of selection criteria between
component design and assembled product design (Stuart, 1998).
12.2 Environmental Characterization of Materials and Processes
The infl uence that the materials used to manufacture a product have on its envi-
ronmental impact is manifested in the energy costs and emissions associated
326 Product Design for the Environment
2722_C012_r02.indd 3262722_C012_r02.indd 326 11/30/2005 1:51:56 PM11/30/2005 1:51:56 PM
© 2006 by Taylor & Francis Group, LLC
Environmental Characterization of Materials and Optimal Choice 327
with the production and end-of-life processes of the material, and in the intrinsic
properties of the material and production process that constrain its level of recy-
clability. Complete environmental characterization of a material should, there-
fore, consist of defi ning the environmental impact linked to its production and
disposal, and of evaluating the margins of recyclability in terms of decline in
performance of the recycled material and recovery costs. Therefore, the optimal
choice of materials, in relation to environmental demands, requires this complete
environmental characterization, with particular regard to the following aspects:
• Environmental impact associated with production processes (energy
costs and overall impact)
• Environmental impact associated with phases of end-of-life (recy-
cling or disposal)
• Suitability for recycling (expressed by the recyclable fraction)
Information on the energy costs and recyclable fractions of more common
materials can be obtained from commercially available databases, such as that
of the CES
®
(Cambridge Engineering Selector, Granta Design Ltd., Cambridge,
UK) materials selection software. Overall environmental impact can be evalu-
ated using the techniques of Life Cycle Assessment (LCA), the analysis method
used to quantify the environmental effects associated with a process or prod-
uct through the identifi cation and quantifi cation of the resources used and the
using these resources and of the emissions produced. Quantifi cation of the
impacts is based on inventory data that is subsequently translated into eco-
indicators such as those used here. These are evaluated according to the Eco-
SimaPro 5.0
®
software (Pré Consultants BV, Amersfoort, The Netherlands).
Environmental characterization is also extended to common primary
(forming) and secondary (machining) manufacturing processes, evaluating
the indicators that quantify the impacts of standard processes per unit of
process parameter or of the volume or weight of material processed.
12.2.1 Data on Materials and Processes
For each material it is necessary to integrate the information used in conven-
tional design with that regarding environmental properties to obtain:
• General properties (density, cost)
• Mechanical properties (e.g., modulus of elasticity, hardness, fatigue
limit)
• Thermal and electrical properties (e.g., conductivity and thermal
expansion, operating temperature, electrical resistance)
2722_C012_r02.indd 3272722_C012_r02.indd 327 11/30/2005 1:51:57 PM11/30/2005 1:51:57 PM
© 2006 by Taylor & Francis Group, LLC
waste generated. As was discussed in Chapter 4, LCA evaluates the impact of
indicator 99 method (Chapter 4, Section 4.2 and Table 4.3) and calculated using
328 Product Design for the Environment
• Environmental properties (energy cost, environmental impact,
recyclability)
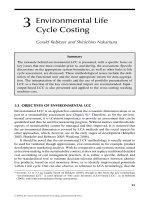
As an example, the datasheet in Figure 12.1 relates to a widely used plastic
material (polypropylene) and shows the data on its environmental proper-
ties. Eco-indicators were evaluated with SimaPro 5.0 software, using the Eco-
indicator 99 method and expressing impacts in mPt (milliPoint). With this
software it is possible to select the inventory data to be used for impact eval-
uation, in this specifi c case Buwal 250 data (Pré, 2003).
Likewise, the following information must be obtained for the primary and
secondary manufacturing processes:
• Physical attributes of the fi nal product
• Economic cost of standard process (fi xed and variable costs)
• Environmental properties (energy consumption, environmental
impact of standard process)
12.3 Summary of Selection Method
that quantify and interrelate the various performances required of the material
FIGURE 12.1 Material datasheet: Polypropylene.
2722_C012_r02.indd 3282722_C012_r02.indd 328 11/30/2005 1:51:57 PM11/30/2005 1:51:57 PM
© 2006 by Taylor & Francis Group, LLC
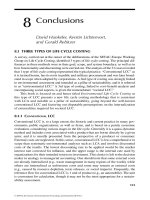
The reference method depicted in Figure 12.2 is based on calculation models
Environmental Characterization of Materials and Optimal Choice 329
in order to identify potential solutions, and a successive, multiobjective analysis
aimed at harmonizing the conventional performance, costs, and environmen-
tal performance of the product.
The fi rst phase consists of defi ning the set of design requirements and
parameters:
• Primary performance (Pf1), in relation to the specifi c functionality of
the component
• Secondary performance (Pf2), which can impose further restrictions
to guide the selection
• Geometric parameters, distinguishing between fi xed (Gf) and vari-
able (Gv) geometric parameters
• Typology of shape and relative level of complexity (Sh), which
greatly affects the choice of forming processes
• Use of component (Us), which can infl uence an initial selection of
materials
The set of design requirements constitutes the input for the procedure of
selecting potential solutions. This procedure is based on two different types
of each hypothetical solution is evaluated by analyzing some of the informa-
tion given in the set of design requirements (in particular, the typology of
FIGURE 12.2 Summary of method.
2722_C012_r02.indd 3292722_C012_r02.indd 329 11/30/2005 1:51:57 PM11/30/2005 1:51:57 PM
© 2006 by Taylor & Francis Group, LLC
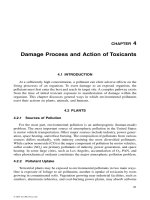
of analysis, shown in Figure 12.3. In the fi rst stage, the production feasibility
330 Product Design for the Environment
shape required and the intended use). The solutions identifi ed in the analysis
of production feasibility must then be evaluated in terms of the required
performances (Pf1, Pf2). The potential solutions obtained are then analyzed
in subsequent phases of the selection method.
Each potential solution S is defi ned by pairs of material–primary forming
process (M, FPr), and by the performance volume (PfV), representing the
minimum volume needed to meet the requirements of primary performance.
If appropriate, the defi nition of the generic solution S can also include any
processes of secondary machining required after the initial forming.
In the following phase, the calculation models are applied to each potential
solution in order to evaluate the indicators of environmental impact and cost
over the entire life cycle. The fi nal phase of the method involves analyzing
the results and identifying the optimal choice.
12.4 Analysis of Production Feasibility
The fi rst stage of the selection procedure must correlate material, process,
shape, and function. The problem of the interaction between these factors is
considered central to the selection of materials and has been thoroughly
investigated (Ashby, 1999).
In the method proposed here, this problem is addressed by considering
shape (Sh) and use (Us) to be design requirements, expressed using binary
FIGURE 12.3 Procedure for selection of potential solutions.
2722_C012_r02.indd 3302722_C012_r02.indd 330 11/30/2005 1:51:57 PM11/30/2005 1:51:57 PM
© 2006 by Taylor & Francis Group, LLC
Environmental Characterization of Materials and Optimal Choice 331
vectors V
Sh
and V
Us
, and introducing binary matrices correlating shape–
process, material–use, and material–process:
⌽⌽ ⌽ ⌽
SP
sp
SP
s,,ns
p1, ,np
UM
um
UM
u1, ,nu
m1,
−
ϭϭ
Ϫ
ϭ
ϭ
ϪϪ
ϭ
ϭ
⎡
⎣
⎤
⎦
⎡
⎣
⎤
⎦
1 …
…
…
……
…
…
,nm
PM
pm
PM
p1, ,np
m1, ,nm
⌽⌽
ϪϪ
ϭ
ϭ
ϭ
⎡
⎣
⎤
⎦
(12.1)
where nm, np, ns, and nu are the numbers of, respectively, possible materi-
als, processes, shape typologies, and uses. Considering processes of
primary manufacture only, on the basis of the correlation matrices (12.1)
and vectors V
Sh
and V
Us
, and following the calculation scheme summa-
Pr
and V
Mt
, indicat-
ing, respectively, the primary processes able to produce the required
typology of shape, and the materials suitable for the intended use. The
subsequent application of the material–process correlation matrix gives a
matrix of producible solutions:
⍀⌽⌽⌽ϭϭ
ϭ
ϭ
ϪϪ Ϫ
pm
pnp
m1, ,nm
pm pm
Sh Us S P U M P
where V V
⎡
⎣
⎤
⎦
1, ,
,, , ,
…
…
MM
(
)
(12.2)
This matrix indicates all the pairs of material–primary process that constitute
the set of producible solutions.
The material–use correlation matrix constitutes a fi lter in the preselection
of possible solutions in that it limits the choice to those materials convention-
ally employed for the intended use. For a broader preselection, it is possible
to bypass this fi lter. In this case, the terms of matrix (12.2) would depend
solely on V
Sh
, ⌽
S-P
, and ⌽
P-M
.
Using the above approach in the analysis of production feasibility, it is
possible to:
• Produce an analytical and exhaustive selection of all the possible
solutions that can satisfy the intended form and use.
FIGURE 12.4 Summary of production feasibility analysis.
2722_C012_r02.indd 3312722_C012_r02.indd 331 11/30/2005 1:51:58 PM11/30/2005 1:51:58 PM
© 2006 by Taylor & Francis Group, LLC
rized in Figure 12.4, it is possible to obtain the vectors V
332 Product Design for the Environment
• Separate the selection conditioned by production feasibility from
that conditioned by performance requirements, thereby evidencing
the relationships between choice of material and effect on life cycle
impacts; such relationships, as shown below, depend on the different
performance capacities of the materials.
This approach requires the prior compilation of the correlation matrices (12.1).
Given the ever-greater variety of engineering materials and related manufac-
turing processes, it is reasonable to consider compiling these matrices by typol-
ogy of material. Alternatively, for a fi rst selection of material–process pairs, it
is possible to use existing software tools such as CES, which implements
Ashby’s methodology. It must be remembered, however, that tools of this type
allow a selection that already takes account of the performances required.
12.5 Analysis of Performance
The second stage of the selection procedure identifi es producible solutions
that respect the required performance characteristics. In this way a set of
potential solutions is obtained, which are then analyzed by applying the
calculation models to evaluate their environmental and economic impacts
over the entire life cycle.
In general, the analysis of performance can be simplifi ed by considering
three different typologies of mathematical relations:
• Function of performance volume (PfV)—Expresses the minimum
volume necessary to meet the primary performance requirements.
Generally, it is a function of the primary performance (Pf1), the geomet-
ric parameters (Gf, Gv), and the properties of the material (MtPp):
PfV PfV(Pf1, Gf, Gv, MtPp)ϭ (12.3)
• Geometric conditions of performance—If the variable geometric
parameters Gv are directly correlated with primary performance
Pf1, the geometric conditions of performance can be expressed by
functions constrained by a range of values (defi ned by the design
requirements):
Gv Gv (Pf1, Gf, MtPp) Gv (Gv , Gv )
12
ϭ ∈
(12.4)
• Secondary conditions of performance—Conditions of this type can
be generally expressed using functions dependent on the properties
2722_C012_r02.indd 3322722_C012_r02.indd 332 11/30/2005 1:51:58 PM11/30/2005 1:51:58 PM
© 2006 by Taylor & Francis Group, LLC
Environmental Characterization of Materials and Optimal Choice 333
of the materials and the performance volume, to be compared with
assumable limit values:
Pf2 Pf2 PfV , MtPp Pf2 Pf2
LI
M
ϭՅՆ
(
)
(12.5)
In conclusion, if a producible solution meets all the performance constraints
and requirements, it then becomes a performing solution and can be selected
consists of all the performing material–primary process pairs, integrated by
the corresponding performance volume
. The latter parameter acquires
particular relevance in the proposed method because it directly conditions
the values assumed by the life cycle indicators which, defi ned below, guide
the optimal choice. Using this approach, it is possible to correlate the search
for environmentally and economically convenient solutions with the perfor-
mance characteristics of the materials.
Only in the case of particularly simple design problems can the functions
of type (12.3) be defi ned in analytical form (Giudice et al., 2001). More
generally, the performance volume cannot be explicitly ascribed to the
factors affecting it; it is the result of design procedures employing modern
methods of engineering design, implemented in commonly used tools
based on parametric CAD and FEM software for structural performance
analyses.
12.6 Life Cycle Indicators
The fi nal phases of the selection method consist of applying the calculation
models to the set of potential solutions, evaluating the indicators of environ-
mental impact and cost relative to the entire life cycle (Life Cycle Indicators),
and then analyzing the results and identifying the optimal choice. The indi-
cators are functions of the quantities of material necessary to produce the
component, expressed by the performance volume.
12.6.1 Environmental Impact Functions
The Environmental Impact of the Life Cycle (EI
LC
) is expressed by:
EI EI EI EI EI
LCMatMfctUseEoL
ϭϩ ϩϩ
(12.6)
where EI
Mat
is the environmental impact of the material needed to produce
the component; EI
Mfct
is the impact associated with its manufacture; EI
Use
is
2722_C012_r02.indd 3332722_C012_r02.indd 333 11/30/2005 1:51:58 PM11/30/2005 1:51:58 PM
© 2006 by Taylor & Francis Group, LLC
for fi nal evaluation. As shown in Figure 12.3, the set of potential solutions
334 Product Design for the Environment
the impact related to the entire phase of use (which can depend on the choice
of material); and EI
EoL
is the impact of the end-of-life (recycling, disposal).
The fi rst two terms of Equation (12.6) constitute the Environmental Impact
of Production (EI
Prod
), which can be expressed by:
EI EI EI ei W ei ei
Prod Mat Mfct Mat Prss Mchg
ϭϩ ϭ ϩ ϩ ⋅⋅ ⋅
()
(12.7)
where ei
Mat
is the eco-indicator per unit weight of material (expressed by W);
ei
Pcss
is the eco-indicator of the primary forming process per unit of µ, which
can represent the characteristic parameter of the process or the quantity of
material processed; and ei
Mchg
is the eco-indicator of the secondary machining
process per unit of characteristic parameter of process . As mentioned above,
these eco-indicators can be evaluated using the Eco-indicator 99 method.
The Environmental Impact of End-of-Life (EI
EoL
) can be expressed by:
EI ei 1 W ei W
EoL Dsp Rcl
ϭϪϩ·· ··
(
)
(12.8)
where ei
Dsp
and ei
Rcl
are, respectively, the environmental impact of disposal
and of recycling processes per unit of weight of material (ei
Rcl
generally
includes a quota of environmental impact recovered), and is the recyclable
fraction. So defi ned, Equation (12.8) refers to the optimal condition where, at
the end-of-life, all of the recyclable fraction of material is recovered. Consider-
ing a more realistic scenario, it is possible to introduce an appropriate coeffi -
cient of reduced recyclability to obtain the fraction actually recycled.
Finally, the Environmental Impact of Use (EI
Use
) cannot be expressed in
general terms and must be defi ned each time, according to the specifi c case
under examination. In this chapter, it will be defi ned in relation to the partic-
ular case study discussed below.
12.6.2 Cost Functions
Similar to the fi rst life cycle indicator, which quantifi es the environmental
impact, the second life cycle indicator quantifi es the economic cost related to
the entire life cycle. Hypothesizing that both production and disposal costs
are paid by a single entity (the manufacturer), the Cost of the Life Cycle (C
LC
)
can be expressed as:
CC C
LC Prod EoL
ϭϩ
(12.9)
The Cost of Production (C
Prod
) can be expressed in a form analogous to
Equation (12.7), as a function of the quantity of material to be employed and
2722_C012_r02.indd 3342722_C012_r02.indd 334 11/30/2005 1:51:58 PM11/30/2005 1:51:58 PM
© 2006 by Taylor & Francis Group, LLC
Environmental Characterization of Materials and Optimal Choice 335
of the more signifi cant process parameters. Alternatively, it is possible to use
a conventional evaluation of the production costs of a component, distin-
guishing between variable and fi xed costs and dividing the latter by the size
of the production batch (Ulrich and Eppinger, 2000).
The Cost of End-of-Life (C
EoL
) can be expressed as:
Cc1 Wcr W
EoL Dsp Rcl Rcl
ϭϪϩϪ·· ··
(
)
(
)
(12.10)
where c
Dsp
, c
Rcl
, and r
Rcl
are, respectively, the cost of disposal, the cost of recy-
cling processes, and the proceeds from the sale of recycled material per unit
weight of the material; is the recyclable fraction.
12.7 Analysis of Results and Optimal Choice
By applying these models, the life cycle indicators (EI
LC
, C
LC
) are calculated
for each potential solution
. Various tools can be used to evaluate the fi tness
of each solution in order to identify the optimal choice. Two tools that are
particularly simple but signifi cant in terms of the proposed method are
described below. More sophisticated tools are discussed in references to
multiobjective optimization in general (Sawaragi et al., 1985), and in relation
to the specifi c case of materials selection (Ashby, 2000).
12.7.1 Graphic Tools
Graphs of C
LC
–EI
LC
can clearly visualize the different fi tness of the potential
solutions. Graphic tools are particularly useful when a large number of solu-
12.7.2 Multiobjective Analysis
In its simple form, multiobjective analysis is the analysis of a multiobjective
function ␥, which includes the more signifi cant product properties, suitably
normalized and weighted:
␥ϭ ␣
q1
nq
B·
=
∑
(12.11)
As already suggested for the comparison of alternative solutions in the prob-
lem of choice of materials (Farag, 2002), the following expression can be used
2722_C012_r02.indd 3352722_C012_r02.indd 335 11/30/2005 1:51:59 PM11/30/2005 1:51:59 PM
© 2006 by Taylor & Francis Group, LLC
tions must be compared; an example is shown in Figure 12.5.
336 Product Design for the Environment
to calculate the normalized values B
q
of the properties (in cases where the
multiobjective function and all properties are to be minimized):
B
V
V
q
q
q
ϭ
max
(12.12)
where V
q
is the value assumed by the q-th property for the solution under
examination and Vmax
q
is the maximum value assumed by the q-th property
among all the solutions to be compared. A set of B
q
coeffi cients is obtained for
each of the potential solutions to be evaluated. The optimal solution is that
with the minimum value of the function ␥.
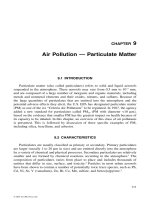
12.8 Case Study: Selection of Material for an Automobile
Brake Disk
The following case study illustrates the application of this method of selec-
tion and choice of materials and of the supporting calculation models. The
design problem consists of the optimum choice for the material of an auto-
A preliminary meaningful case study was conducted on a simpler design
problem, the optimal polymeric material selection for a piping component
(Giudice et al., 2001).
FIGURE 12.5 Evaluation of solution fi tness: C
LC
–EI
LC
graph.
2722_C012_r02.indd 3362722_C012_r02.indd 336 11/30/2005 1:51:59 PM11/30/2005 1:51:59 PM
© 2006 by Taylor & Francis Group, LLC
mobile brake disk, depicted in Figure 12.6.
Environmental Characterization of Materials and Optimal Choice 337
12.8.1 Defi nition of Design Requirements
The fi rst phase of this method is the defi nition of the set of design
requirements:
• Primary performance required (Pf1) is that of ensuring, in relation to
a reference condition of vehicle movement, effi cient braking within
a given distance. In physical–mechanical terms, this translates into
the dissipation of energy through friction and structural performance
correlated with the mechanical and thermal loading conditions
(stress–strain analysis).
• Secondary performance required (Pf2) is that of limiting the
weight W.
• Fixed geometric constraint (Gf) is the external radius of the disk R
e
.
• Variable geometric parameters (Gv) are the thickness s and internal
radius of the disk R
i
.
• Shape required (Sh) is a three-dimensional rotation solid.
FIGURE 12.6 Case study: Automobile brake disk.
2722_C012_r02.indd 3372722_C012_r02.indd 337 11/30/2005 1:51:59 PM11/30/2005 1:51:59 PM
© 2006 by Taylor & Francis Group, LLC
338 Product Design for the Environment
12.8.2 Analysis of Production Feasibility
On the basis of the form required (Sh) and of the expected use (Us), the anal-
ysis of production feasibility suggests some hypothetical solutions, two of
which were considered (one conventional and one of recent introduction):
• Solution S
1
consists of grey cast iron BS 350 as the material, and green
sand casting as the primary forming process.
• Solution S
2
consists of an aluminum matrix compound (F3K20S
Duralcan®, Alcan Aluminum Ltd., San Diego, CA) as the material, and
squeeze casting (liquid metal forging) as the primary forming process.
12.8.3 Analysis of Performance
By defi ning the weight of the automobile and imposing the required braking
capacity, it was possible to determine the braking moment required on each
wheel and the pressures at the disk–pad contact necessary to produce this
moment. The primary performance was thus translated into the following
conditions of correct functioning that must be ensured by the thermal–
mechanical characteristics of the material:
• Thermal peaks below the maximum operating temperature of the
materials
• Global stress state (due to superimposition of mechanical and ther-
mal loading) below the mechanic resistance limits of the materials
• Global strain state (due to the superimposition of mechanical and
thermal loading) within the elastic limit of the materials
Given the complexity of the problem, the performance analysis was conducted
using the fi nite element software MSC Patran/Nastran
®
(MSC Software
Corporation, Santa Ana, CA), which allowed the correlation of performance
properties of the materials, variable geometric parameters, and the corre-
some results of the stress and thermal analyses on the disk. These FEM anal-
yses were calibrated on the basis of experimental data available in the litera-
ture (Bassignana et al., 1984; Brembo, 1998). Both of the producible solutions
the performance volume PfV and the variable geometric parameters (thick-
ness s and internal radius R
i
) must assume in order to ensure the perfor-
mance, together with the corresponding weights.
Comparing the two solutions under examination, the Duralcan option
requires greater performance volume PfV (and therefore larger overall
dimensions) to ensure primary performance. The conventional solution in
2722_C012_r02.indd 3382722_C012_r02.indd 338 11/30/2005 1:52:00 PM11/30/2005 1:52:00 PM
© 2006 by Taylor & Francis Group, LLC
sponding structural and thermal loading. As an example, Figure 12.6 shows
under examination were found to function. Table 12.1 shows the values that
Environmental Characterization of Materials and Optimal Choice 339
cast iron reduces the overall dimensions but results in a greater weight (ϩ56%
compared to Duralcan).
12.8.4 Evaluation of Life Cycle Indicators and Analysis of Results
Equations (12.6) and (12.9) were used to calculate the indicators of environ-
mental impact and cost for each performing solution. The results of the calcu-
as follows:
• In the calculation of production impacts and costs, only the primary
manufacturing processes were considered; secondary processes
were ignored.
• In the evaluation of Equation (12.9), the end-of-life costs expressed
by Equation (12.10) were ignored because of the diffi culty of obtain-
ing the relevant data. Thus, only the cost of production C
Prod
was
considered as the cost indicator.
• In this fi rst phase, Equation (12.6) was evaluated ignoring the envi-
ronmental impact related to use of the product.
From the values in Table 12.2, it is clear that the Duralcan solution leads to an
impact (2272.2 mPt) two orders of magnitude greater than that of the solu-
composition of the environmental indicator EI
LC
; it is particularly interesting
in that it demonstrates the different distributions of the environmental impact
over the life cycle for each potential solution.
Comparing the two solutions, it is evident that:
• The overall impact of the Duralcan solution is essentially due to the
impact of producing the material itself, which also offers a negligible
recycling fraction (low recovery of impact).
• The solution in cast iron has a much lower production impact and,
furthermore, its high recyclability allows a substantial recovery of
impact at end-of-life.
TABLE 12.1 Performance volume, weight, and variable
geometric parameters
PfV (dm
3
) W (kg) s (mm) R
i
(mm)
BS 350 0.82 6.00 25 110
F3K20S 1.36 3.83 30 90
2722_C012_r02.indd 3392722_C012_r02.indd 339 11/30/2005 1:52:00 PM11/30/2005 1:52:00 PM
© 2006 by Taylor & Francis Group, LLC
tion in cast iron (43.5 mPt). The graph shown in Figure 12.7 describes the
lation models are reported in Table 12.2. The general models were simplifi ed
340 Product Design for the Environment
The values r
is more favorable—the conventional solution in cast iron—since it results in
the lowest values of both C
Prod
and EI
LC
.
In conclusion, it is evident that when the properties considered most impor-
tant for the fi nal product are those of reduced cost and environmental impact
of the life cycle, the best solution is that in cast iron. The alternative solution
property.
This is confi rmed by applying the multiobjective analysis method intro-
duced in Section 12.7. Considering EI
LC
, C
Prod
, weight W, and performance
volume PfV as objective functions, different values of the function to mini-
mize ␥ are obtained for the two alternative solutions according to how the set
i
different orientations of investigation, corresponding to the different empha-
ses given to the objective functions in the evaluation of ␥:
• 1—Maximum importance given to environmental impact, medium
to cost, low to W and PfV reductions
TABLE 12.2 Results of the evaluation of Life Cycle Indicators
LIFE CYCLE INDICATORS
EI
PROD
(mPt)
EI
EOL
(mPt)
C
MAT
(EURO)
C
PRSS
(EURO)
EI
LC
(mPt)
C
PROD
(EURO)
BS 350 208.9
Ϫ165.4
6.59 14.70 43.5 21.29
F3K20S 2293.3
Ϫ21.1
18.94 27.52 2272.2 46.46
FIGURE 12.7 Composition of indicator EI
LC
in relation to
phases of life cycle.
2722_C012_r02.indd 3402722_C012_r02.indd 340 11/30/2005 1:52:00 PM11/30/2005 1:52:00 PM
© 2006 by Taylor & Francis Group, LLC
of weight coeffi cients ␣ is defi ned. Figure 12.8 shows the results for four
in Duralcan is favorable only when light weight is chosen as the primary
eported in Table 12.2 clearly indicate which of the two solutions
Environmental Characterization of Materials and Optimal Choice 341
• 2—Maximum importance given to W reduction, medium to cost,
low to environmental impact and PfV reductions
• 3—Primary reduction of cost
• 4—Primary reduction of environmental impact
It can be seen that, compared to the solution in cast iron, the solution in
Duralcan is interesting only in the second case.
12.8.5 Introduction of Environmental Impact of Use: Evaluation of Life
Cycle Indicators and Analysis of Results
The Duralcan solution has the primary advantage of reducing the weight of the
disk. The consequent lightening of the vehicle can result in a suffi cient reduc-
tion in the environmental impact of use to recover the increased impact in
production. To evaluate whether (and under what conditions) this is true, it is
necessary to evaluate the term EI
Use
in Equation (12.6), which was ignored previ-
ously. Apart from this, all the other simplifi cations introduced in Section 12.8.4
remain the same. Having established an overall reference distance traveled
(mission), the environmental impact of use EI
Use
can be expressed as:
EI EI EI ei q ei q
Use Fuel Mission Fuel Fuel Mission Mission
ϭϩ ϭ ϩ·· (12.13)
where ei
Fuel
is the eco-indicator per unit weight of fuel; ei
Mission
is the
eco-indicator associated with the use of the vehicle powered with this kind of
fuel per unit of distance traveled; q
Fuel
is the quantity of fuel needed for the
entire distance covered; and q
Mission
is the total expected distance.
FIGURE 12.8 Study of multiobjective function ␥.
2722_C012_r02.indd 3412722_C012_r02.indd 341 11/30/2005 1:52:00 PM11/30/2005 1:52:00 PM
© 2006 by Taylor & Francis Group, LLC
342 Product Design for the Environment
To evaluate all the quantities in play, the following assumptions were made:
• Weight of vehicle = 1000 kg
• Mean fuel consumption = 0.085 L/km
• Reduction in consumption due to a 10% reduction in total weight of
vehicle = 4.5% ( Source: IKP, University of Stüttgart, Germany)
On the basis of these assumptions, and after having evaluated the overall
reduction in weight due to the choice of four disks made of Duralcan instead
of cast iron (Ϫ8.7 kg), it was possible to evaluate the reduced weight of the
vehicle (991.3 kg) and the mean fuel consumption of the lightened vehicle
(0.0847 L/kg).
the environmental impact of use for an expected traveling distance of
mental impact than that in cast iron, in terms of both the phase of use alone
(Ϫ0.4%) and the entire life cycle (Ϫ0.3%).
The percentage reduction in EI
LC
also depends on the expected distance
even point of EI
LC
. This represents the minimum distance that must be trav-
eled for the EI
LC
corresponding to the solution in Duralcan to be less than the
EI
LC
of the solution in cast iron (about 31,300 km).
mental indicator EI
LC
in relation to the different phases of the life cycle for
each potential solution (distance traveled ϭ 150,000 km). Because of the
different orders of magnitude, the components regarding the phase of use
are shown in Pt rather than in mPt.
In conclusion, when the environmental impact relating to the phase of use
(infl uenced by the vehicle weight) is also taken into account, the solution in
Duralcan is advantageous not only when lightness is chosen as the primary
property, but also when the environmental impact of the entire life cycle is
considered; this advantage becomes apparent after a minimum distance trav-
eled of approximately 31,000 km.
TABLE 12.3 Results of the evaluation of Life Cycle
Indicators (including phase of use)
LIFE CYCLE INDICATORS
EI
PROD
(mPt)
EI
USE
(mPt)
EI
EOL
(mPt)
EI
LC
(mPt)
BS 350 208.9 2729884
Ϫ165.4
2729927
F3K20S 2293.3 2719201
Ϫ21.1
2721479
2722_C012_r02.indd 3422722_C012_r02.indd 342 11/30/2005 1:52:00 PM11/30/2005 1:52:00 PM
© 2006 by Taylor & Francis Group, LLC
traveled. The graph in Figure 12.9 shows, for the two solutions, the break-
T he graph in Figure 12.10 describes the new composition of the environ-
Table 12.3 shows the environmental indicators of the life cycle, considering
150,000 km. It is clear that the solution in Duralcan results in a lower environ-
Environmental Characterization of Materials and Optimal Choice 343
This consideration is again confi rmed by applying the multiobjective analy-
sis method. Considering EI
LC
(which now also includes EI
Use
, calculated for
the reference distance of 150,000 km), C
Prod
, the weight W, and the performance
obtained for the four different investigation orientations described in Section
12.8.4. It can be seen that, again, the solution in cast iron is better for the fi rst
(maximum importance to environmental impact, medium to cost) and third
(primary reduction of cost) investigation typologies, while that in Duralcan is
better for the second one (maximum importance to weight reduction).
FIGURE 12.9 Breakeven point of EI
LC
for the two solutions.
FIGURE 12.10 Composition of indicator EI
LC
in relation to
phases of life cycle (including use).
2722_C012_r02.indd 3432722_C012_r02.indd 343 11/30/2005 1:52:01 PM11/30/2005 1:52:01 PM
© 2006 by Taylor & Francis Group, LLC
volume PfV as objective functions the results shown in Figure 12.11 are
344 Product Design for the Environment
However, for the last investigation typology (directed at reducing primar-
ily the environmental impact) the two solutions are essentially equivalent,
while for distances over 150,000 km the solution in Duralcan tends to be more
advantageous than that in cast iron (since the lower value of EI
LC
due to the
reduced weight tends to increase with the distance traveled).
12.9 Acknowledgments
The main contents of this chapter were previously published (Giudice, F., La
Rosa, G., and Risitano, A., Materials selection in the life-cycle design process:
A method to integrate mechanical and environmental performances in opti-
mal choice, Materials and Design, 26[1], 9–20, 2005), and are reproduced with
permission from Elsevier.
12.10 Summary
The proposed selection procedure elaborates data (both conventional and
environmental) regarding the properties of materials and processes. It relates
this data to the performance requirements demanded of the product and
calculates the values assumed by functions that quantify the environmental
impact over the entire life cycle, including the phases of use and retirement,
and the costs resulting from the choice of materials.
FIGURE 12.11 Study of multiobjective function ␥ (including use).
2722_C012_r02.indd 3442722_C012_r02.indd 344 11/30/2005 1:52:01 PM11/30/2005 1:52:01 PM
© 2006 by Taylor & Francis Group, LLC
Environmental Characterization of Materials and Optimal Choice 345
A complete application of this method in the design of an automobile
component allowed a direct comparison between the optimal choice made
after a multiobjective analysis and that obtained in a conventional design
approach. This experience demonstrated the need to use new tools in order
to ensure, in the design phase, environmental safeguards in the development
of industrial products, and the possibility of fully integrating such new tools
with conventional design tools.
12.11 References
Ashby, M.F., Materials Selection in Mechanical Design, 2nd ed., Butterworth-Heinemann,
Oxford, UK, 1999.
Ashby, M.F., Multi-objective optimization in material design and selection, Acta
Materialia, 48(1), 359–369, 2000.
Ashby, M.F., Drivers for material development in the 21st century, Progress in Materials
Science, 46, 191–199, 2001.
Ashby, M.F. and Cebon, D.A., Compilation of material indices, Granta Design Ltd.,
Cambridge, UK, 1995.
Ashby, M.F. et al., Selection strategies for materials and processes, Materials and
Design, 25, 51–67, 2004.
Bassignana, P., Gavello, E., and Leonti, S., Analisi termica, termoelastica e meccanica
di freni automobilistici, ATA Ingegneria Automotoristica, 37(11), 727–740, 1984.
Brechet, Y. et al., Challenges in materials and process selection, Progress in Materials
Science, 46, 407–428, 2001.
Brembo, Il Manuale del Disco Freno, Giorgio Nada Editore, Milano, Italy, 1998.
Charles, J.A., Crane, F.A.A., and Furness, J.A.G., Selection and Use of Engineering
Materials, 3rd ed., Butterworth-Heinemann, Oxford, UK, 1997.
Chen, R.W. et al., A systematic methodology of material selection with environmental
considerations, in Proceedings of IEEE International Symposium on Electronics and
the Environment , San Francisco, 1994, 252–260.
Edwards, K.L., Designing of engineering components for optimal materials and
manufacturing process utilisation, Materials and Design, 24, 355–366, 2003.
Farag, M.M., Materials Selection for Engineering Design, Prentice Hall Europe, Hemel
Hempstead, UK, 1997.
Farag, M.M., Quantitative methods of materials selection, in Handbook of Materials
Selection, Kutz, M., Ed., John Wiley & Sons, New York, 2002, chap. 1.
Giudice, F., La Rosa, G., and Risitano, A., Optimal material selection in the design for
environment process: Environmental characterisation of polymeric materials
and a methodology of selection, in Proceedings of ENTREE 2001—Environmental
Training in Engineering Education , Florence, Italy, 2001, 215–234.
Holloway, L., Materials selection for optimal environmental impact in mechanical
design, Materials & Design, 19(4), 133–143, 1998.
Kampe, S.L., Incorporating green engineering in materials selection and design,
in Proceedings of the 2001 Green Engineering Conference: Sustainable and
Environmentally Conscious Engineering , Roanoke, VA, 2001, 7/1–7/6.
2722_C012_r02.indd 3452722_C012_r02.indd 345 11/30/2005 1:52:02 PM11/30/2005 1:52:02 PM
© 2006 by Taylor & Francis Group, LLC
346 Product Design for the Environment
Lu, W.F. and Deng, Y M., A system modeling methodology for materials and engi-
neering systems design integration, Materials and Design, 25, 459–469, 2004.
Navin-Chandra, D., Design for environmentability, in Proceedings of ASME Design
Theory and Methodology Conference , Miami, FL, 1991, DE-31, 119–125.
Pré, SimaPro 5 Database Manual: The BUWAL 250 Library, Pré Consultants BV,
Amersfoort, The Netherlands, 2003.
Sawaragi, Y., Nakayama, H., and Tanino, T., Theory of Multiobjective Optimisation,
Academic Press, Orlando, FL, 1985.
Stuart, J.A., Materials selection for life cycle design, in Proceedings of IEEE International
Symposium on Electronics and the Environment , Oak Brook, IL, 1998, 151–158.
Ulrich, K.T. and Eppinger, S.D., Product Design and Development, 2nd ed., McGraw-
Hill, New York, 2000.
Wegst, U.G.K. and Ashby, M.F., The development and use of a methodology for the
environmentally conscious selection of materials, in Proceedings of 3rd Biennial
World Conference on Integrated Design and Process Technology (IDPT) , Berlin, 1998,
5, 88–93.
2722_C012_r02.indd 3462722_C012_r02.indd 346 11/30/2005 1:52:02 PM11/30/2005 1:52:02 PM
© 2006 by Taylor & Francis Group, LLC