TPM Route to World Class Performance Part 7 ppsx
Bạn đang xem bản rút gọn của tài liệu. Xem và tải ngay bản đầy đủ của tài liệu tại đây (737.86 KB, 20 trang )
I
TOTAL PRODUCTIVE MATNTENANCE PROGRAMME
FUH
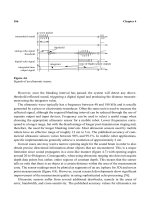
FRONT DOORLINE CO,
MIG
WELDING CELL
MATERIAL USAGE CHART
7
Material
I
Welding wire
I
1
Welding tip
1
I
Shroud
I
Anti-spatter spray
i-
P
0
N
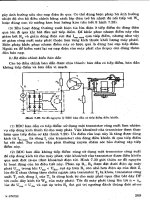
Figure 5.26 Material usage
chart
for
example
in
Figure
5.25
The
TPM
improvement
plan
103
maintaining
and
supporting the equipment,
which
are then
standardized
as
the best practice routine across
all
shifts.
Figure
5.27
summarizes the relationship between standard operation,
techniques for asset care and the right tools, spares, facilities and equipment.
The
right
tools,
Achieved
through:
facilities,
communication
equipment
correct application
training
consistent application
Figure
5.27
Best
practice
Standard operation ensures:
0
reduced chance
of
error
and
risk
0
removal
of
performance irregularity
0
elimination
of
poor operation
as
a cause of problem
0
simplified
training
within and
between
shifts
When launching
a
pilot, we
should
consider:
0
What
is
the best method
of
operating
our
pilot?
0
Does the team agree?
0
Does
each
shift
agree?
0
Do
the key contacts agree?
0
How do we
train
people
to
operate
this
method?
(single-point lessons)
0
How
do
we communicate this method to each
shift?
(visual
managmmt)
0
How
do we make it easy to
do
it right
and
difficult to do it wrong?
(improvements)
For each piece
of
equipment we need to estabLish the best practice for:
provision
of
tools
0
provision
of
spares
0
monitoring instruments
0
outside contracts
104
TPM-A
Route to World-Class Performance
0
warranties
0
technical help
We must therefore involve the key contacts.
In effect, the best practice routine is similar to your motor car handbook.
It explains the best and correct way to operate, maintain and support the car.
It gives the standard operation and asset care procedures.
Step
9
Problem
solving
P-M
analysis
Once the 'noise' of poor equipment care and different operative practices are
addressed, the real technical problems can be revealed.
In seeking to solve the problems which lie behind the six big losses, TPM
uses P-M analysis to address problems with mechanisms. This emphasizes
the machine/human interface: there are
phenomena
which are
physical,
which
cause
problems
which can be
prevented;
these are to do with
materials, machines,
methods
and
manpozuer.
These problems may have a single cause, multiple causes or a complex
combination of causes. P-M analysis is concerned with pinpointing the causes,
taking countermeasures and evolving best practice routines so that the problems
are dealt with once and for all and fed back into an improved
OEE.
On-the-job reality
This approach recognizes practical on-the-job steps as follows:
0
Cleaning
is
inspection
Operators are encouraged to look for opportunities
to reduce accelerated deterioration and improve equipment design.
0
Detect problems
and
opportunities
Work with the team to systematically
review problems and opportunities to achieve target performance:
-
Adopt a multi-stage approach
-
Make all aware of the problem and the opportunity
-
Observe the current situation and record
-
Define the problem and the conditions under which it occurs
-
Develop the optimum solution progressively
-
Try out new ideas first and check the results
-
Apply proven low-cost or no-cost solutions first
-
Implement ideas as soon as possible and refine quickly
-
Standardize best practice with all those involved
-
Monitor and review
Event re view
For sporadic losses, the event review provides a simple way of trapping
information, problem solving and developing countermeasures. The form
shown in Figure
5.28
links five-why problem analysis with the five main
countermeasures to sporadic losses. It is designed to promote post-event
The
TPM
improvement plan
105
EVENT REVIEW FORM
Plant
No
Line No
-
Product
I
Opened datelshift
I
I
Breakdown briefing
Closed
I
Ref
Brief description
of
fault and problem definition:
I
How long
ago
could this defect have been detected?
I
3
Short term actions
Priority for review
Modification to operator/maintainer
practicekraining
IMPROVED Routine Activities
Planned maintenance
Component modification
Other
8
8
e.
Agreed Planned Implemented (inc SPL) Confirmed
Figure
5.28
Event review format
discussion between operators and maintainers. It also uses
status
wheels
to
report progress and provide a record to review the event of reoccurrence.
In
Figure
5.29
we have completed an event review form using the overhead
projector analogy discussed in Chapter
3.
Recurring
problems
In
order to resolve problems and prevent recurrence, knowledge and
106
TPM-A
Route
to
World-Class Pevformance
Opened Date/Shift
Breakdown Briefing
EVENT REVIEW FORM
Plant
No
O/head
Pyojector
Line No
1
Product
View
Foils
14/12/98
6-2
pm shift
I
Closed
I
I
Ref
106 Lama
bdbs
keea
blowina
Brief description
of
fault and problem definition:
How
long ago could this defect have been detected?
Probably
1
month plus
Wh)
A/F
insuff
3
Filter blocked Source
of
contamination
Whv filter block
4
1
Not cleaned
I
Dailv asset care needed
Modification to operatorimaintainer
practiceltraining
See
below
Cleanfilter once a week
on
Friday
Shift
-
Operator
Set
up thermometer
to
check
temnerature
in
the
box.
Colour code
/
IMPROVED Routine activities
Checkhediction
b
L
Planned maintenance
Overhaul and check fan rating
every six months
Component modification
Set
up thermometer. Shadow board for
bulbs
OTHER
SPL
needs for
OPS
recleaning and
changing filter
+
temperature reading
+
bulb changing
8
Agreed
8
Planned
@
Implemented (inc
SPL)
Confirmed
Figure
5.29
Event review example
understanding is the key to training operators to be equipment-conscious.
Some examples, checklists and techniques are given below.
Overheating, vibration and leakage are problems which will constantly
arise and, unless tackled and eliminated once and for all, will continue to
contribute to breakdown losses. Tables
5.2-5.5
offer approaches to these
problems.
A
structured approach to set-up reduction is necessary. Table
5.6
draws
attention to all the points which must be looked at and evaluated.
An
indication
The TPM improvement plan
107
Table
5.2
Problem solving: leakages
Cause Remedy
1
Excessive vibration
2
Unabsorbent mountings
3
Insufficient mountings or supports
4
Wrong grade/type component fitted
5
Poor fitting
6
Overheating
7
Technical ignorance/innocence
8
Material breakdown
Cure cause
Refit new mountings
Fit extra
Fit correct grade
Refit correctly
Seek and cure cause
Retrain
Replace
Vibration is one of the major causes of fittings or fixings working loose and giving rise
to leaks. Other items contribute, such
as
poor fitting, or overheating, which causes
seals first to bake and then crack.
To
identify leaks:
*
In
the case of liquids: puddles will form
*
In
the case of gases: noise, smell
or
bubbles when tested with soapy water.
Table
5.3
Problem solving: overheating
Cause Remedy
1
Excessive lubrication
2
Incorrect lubricant
3
Lubrication failure/contamination
4
Low lubricant level
5
Poor fitting
6
Excessive speed above standard
7
Overloading
8
Blockages in system
9
Excessive pipe lengths or joints
Remove excess
Replace with correct
Check cause and remedy
Refit correctly
Reduce speed to standard
Reduce loading
Clean and flush system
Redesign system
TOP
UP
~~~ ~~ ~~
Table
5.4
Problem solving: overheating and lubrication
When
overheating
can be attributed to
a
lubricating problem, it is always best policy to
remove all lubricant and replace with new after the problem has been cured. Lubricant
which has overheated starts to break down and will not perform as it should.
Identification
of
overheating:
Visual
*
Smell
*
Touch
Items that have overheated will discolour or give off smoke.
In
many
cases overheated items give off fumes which can be smelt.
By
touching items suspected
of
overheating one can tell, but caution
must
be exercised in the first instance.
A
hand held close to the item
will indicate whether it would burn if touched.
e
Electvical/
Many items of equipment have built-in temperature-sensing devices
Visual
and these should be monitored regularly. An awareness of the
significance of the temperature readings is essential.
108 TPM-A Route to World-Class Performance
Table
5.5
Problem solving: vibration
Cause
Remedy
1
2
3
4
5
6
7
8
9
10
11
Out of balance
Bent shafts
Poor
surface finish
Loose nuts and bolts
Insecure clips
Insufficient mountings
Too
rigid mountings
Slip stick
Incorrect grade lubricant
Worn bearings
Excessive speed above standard
Correct
or
replace
Straighten or replace
Rework surface
Tighten
Secure
clips
Get
extra
added
Get
softer ones
Lubricate
Clean and replace
Replace
Reduce speed to standard
Some
of
the remedies will require
a
skilled maintenance fitter. Others can be carried
out by the operator with some training (items
4,
5,
8,
9
and
11).
Vibration is identified by sight, touch
or
noise increase.
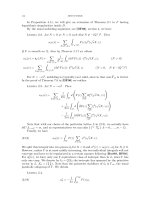
of the importance of tackling adjustment is given by the percentage figures
based on hard experience shown in Table 5.7.
Set-up and adjustment are
so
important in the drive towards reduced
losses, better equipment effectiveness and ultimately world-class manufacture.
Shigeo Shingo, the guru of Single-Minute Exchange Die (SMED), states the
following in his book
A
Revolution
in
Manufacturing: the SMED System:
'Every
machine set-up can be reduced by 75%'.
What a challenge for Western companies! The SMED approach uses a
derivative of the Deming circle:
Focus Set-up video
Analyse Pareto, ergonomics
Develop Script, simulate, agree
Execute Train, measure, honour, empower
In the SMED system, success is subject to certain conditions:
e
An attitude
The team wants to score.
An empowerment
The team has a budget.
An
involvement
A
commitment
Management sets the target.
A philosophy
Step-by-step improvement.
Management is part of the team.
Moreover, the SMED approach suggests that there are characteristics common
to all set-ups:
Prepare, position, adjust, store away
Internal and external activities
From last good product to first
good
product
The TPM improvement plan
109
Table
5.6
Factors in reduction
of
set-up and adjustment time
External set-up
Tools (types, quantities)
Preparations
Locations
*
Don’t search
0
Position
0
Don’t move
Workplace organization and housekeeping Don’t
use
*
Preparation procedure
Preparation of
a
Check
jigs
ardlary Measuring instruments
equipment
Preheating dies
0
Presetting
Internal set-up
0
0
0
0
0
0
*
Dies and jigs
0
0
0
0
0
0
0
Standardize work procedures
Allocate work
Evaluate effectiveness
of
work
Parallel operations
Simplify work
Number of personnel
Simplify assembly
Assembly /integration
Elimination
Eliminate
redundant
procedures
Reduce basic
operation
Clamping methods Makeit easy
Reduce number of clamping parts
Shapes of dies and
jigs:
consider mechanisms
Use intermediary jigs
Standardize dies and jigs
Use common dies and jigs
Weight
Separate functions and methods
Interchangeability
Eliminate
adjustment
Adjustment
Precision of jigs
Precision of equipment
Set reference surfaces
0
Measurement methods
Simplification methods
Standardize adjustment procedures
Quantification
*
Selection
Use gauges
Separate out interdependent adjustments
Optimize conditions
-
Table
5.7
Adjustments as a percentage
of
total
set-up
time
Preparation of materials, jigs, tools and fittings
Removal and attachment of jigs, tools and dies
Centring, dimensioning
10%
20%
20%
Trial processing, adjustment
50%
110
TPM-A
Route to World-Class Performance
-A
On
B-
A
Figure 5.30 shows the three steps towards a cumulative reduction of 75 per
cent to 95 per cent
in
set-up time
in
the
SMED
system.
A
graphical representation
of the reductions achieved is shown in Figure 5.31.
TPM
develops six conceptual steps for analysing adjustment operations.
1
Purpose
What function
is
apparently served by adjustment?
2
Current rationale
Why is adjustment needed at present?
3
Method
How is the adjustment performed?
On
B
A
Set-up reduced by
50%
On
B
*
Set-up reduced by another
50%
Step
3:
Minimize external activities and
continue reducing internal activities
Figuve
5.30
SMED
steps to reducing set-up time
1.5
0’
I
I
I
I I I
b
1
2
3
4
5
6
Application time (months)
Figure
5.31
Set-up times veduced significantly by
SMED
approach
The
TPM
improvement plan
111
Set
fixed
Increase Set
precision
procedure values
Standardize
I
Analyse adjustment
operations methods in detail
Improve
operator
skills
Identify reasons for present
adjustments
I
Analyse principles behind
adjustments
*
Equipment mechanism
Equipment precision
*
Accumulation of errors
Standardization
Mechanical deficiency
*
Insufficient rigidity
a
Optimize by trial and error
Mechanical deficiency
Insufficient rigidity
a
Figure
5.32
Analysis
of
adjustment operations
112
TPM-A Route to World-Class Performance
Analyse set-up data
I
Study equipment
characteristics
4
Principles
What is the true function of the adjustment operation as a
5
Causal factors
What conditions create the need for adjustment?
6
Alternatives
What improvements will eliminate the need for adjustment?
Figure 5.32 provides a clear visual presentation of the
TPM
approach to
analysing adjustment operations leading to minimization of losses. Figure
5.33 reviews progressively the process from an analysis of the present position
right through to achieving optimal conditions. Wherever possible, make use
of video: it is a very powerful analysis tool.
whole?
W
Progress in reducing set-up times
W
Variable factors
Problems
W
Points requiring attention
W
Equipment mechanisdsystem
W
Characteristics
W
Scope of set-up operation
W
Shape mechanism, and precision jigs/tools
Analyse work methods
Set improvement targets
W
Targets based on equipment restrictions
(the challenge)
W
Targets based on desired improvement
W
Time
Adjustment methods and details
W
Effectiveness of each operation
W
Tools
W
Location
I
W
Transport devices
Preparatory steps
(everything
to
hand)
W
External set-up work
W
Internal set-up work
I
Separate internal
&
external
set-up operations
W
Methods, timing
Workers, spare parts
W
Practise thoroughly
Establish work sequences
for external set-up
Establish work sequences
for
internal set-up
Co-ordinate work sequences
and
methods
Figuve
5.33
Pvocess
of
improving set-up and adjustment
The
TPM
improvement plan
113
Stabilize set-up times
Quality problems
Start-up stability
Attainment of targeted time
Selected targeted tasks
Effect of improvements
Study adjustments
Study adjustments and
jigs
Details
of
adjustments
Reasons for adjustments
Alternatives to adjustments
Relation between adjustments
and equipmentljigs
Create improvement plan
w
Figure
5.33
continued
Establish new work
I
Ascertain optimal
conditions
I
Standard across all shifts
Figure
5.34
provides
a
decision-tree structure
to
help eliminate reasons
for
running
at
reduced speeds. Table
5.8
provides
a
checklist
of
ideas for developing
approaches to increase speeds.
114
TPM-A
Route
to
World-Class Performance
Content of
Study the breakdowns
Defective rate
equipment
Cycle diagram
condition
Vibration
present level of
Electric current
Static accuracy
Investigation of
troubles in the
past
time of
equipment
I
I
Study the Compare the
principles of the specifications
processing of the and present
mechanism situations
0
b
*
Problems from
viewpoint of
principles
Processing conditions
Kinds of breakdowns
and
the
countermeasures
taken
Transition
of
defective rate
Chronological
transition of the
processing speed
Design
specifications
Theoretical values
Specify the
Restoration
Elimination of all
possible minor
problems
Pursuit of ideal
condition
against the
problems
+
Check results
Standardization
1-
Daily inspection
standards
Periodical
inspection
standards
Figure
5.34
Countermeasures
for
speed
losses
The
TPM
improvement plan
115
Table
5.8
Strategies for increasing speed
Determine present levels
Check differences between
specification and present situation
Investigate past problems
Investigate processing theories and
principles
Investigate mechanisms
Investigate present situation
*
*
*
0
e
0
*
0
e
9
*
*
*
*
9
*
0
*
*
0
0
Speed
Bottleneck processes
Downtime, frequency of stoppages
Conditions producing defects
What are the specifications?
Difference between standard speed
and present speed
Difference in speeds for different products
Has
the speed ever been increased?
Types of problems
Measures taken to deal with past problems
Trends in defect ratios
Differences in similar equipment
Problems related to processing theories
and principles
Machining conditions
Processing conditions
Theoretical values
Mechanisms
Rated output and load ratio
Investigate stress
Revolving parts
Investigate specification
of
each part
Processing time per operation (cycle
diagram)
Loss
time (idling times)
Check precision of each part
Check usinE five senses
Applying
the
TPM
improvement plan
6.1
Training context
The following example is based on a TPM improvement plan training exercise
as part of a four-day TPM facilitator training course. Approximately
70
per
cent of the course content is putting the theory of TPM into practice on a
live
TPM pilot piece of equipment. This practical focus is
so
that the facilitators
are experiencing over four days what they will be coaching their own TPM
teams over the twelve to twenty weeks of a typical TPM pilot project, the
process of which is described in Chapter
7.
The output of this particular exercise is based on a one-hour feedback
presentation which the five budding TPM facilitators made after spending
two and a half days assimilating and using the nine-step TPM improvement
plan. The following sections
6.2
to
6.16
inclusive are the content of their
presentation.
6.2
Team brief
A
core team is undertaking a pilot TPM project. The team is made up
of
0
Three production personnel (one per shift)
0
Two maintenance personnel (one electrical, one mechanical)
The company
-
Merlin Gun Technology
-
is planning to introduce TPM
across the site
(200
personnel).
The pilot aims to develop a practical, model example of equipment operating
under
TPM.
This will support the roll-out
of
TPM. It will also highlight those
issues which need to be overcome to achieve a successful implementation.
Specifically, the team will:
assess the critical elements of the equipment;
identify what refurbishment is required to put the equipment into
good
condition;
0
develop a practical, model example of equipment in good condition;
develop an asset care and history recording process;
0
identify the main problem areas and develop solutions;
establish the current level of overall equipment effectiveness and set
targets for improvement;
Applying the
TPM
improvement plan
117
Maintenance
Manager
0
produce an implementation plan to improve the equipment
reliability.
Ordering
Production
Manager Procedure Control
Background
Merlin Gun Technology has the following characteristics:
0
The company makes welding guns and welding tips.
0
Most
of
the volume is in welding tips.
The co'mpany experiences pressure from customers to produce in small
batches.
0
The company is expanding into further export markets.
0
Department
50
is recognized as the main bottleneck.
The company organization is shown in Figure 6.1.
I
I
I
Dept Dept
40
50
Department
50
Department
50
makes the most popular welding tips. It has always been the
bottleneck department.
The department produces basically three types of tip (Figure 6.2):
e
The
5020,
a flat-head tip produced in
two
operations
The 5031, a tip with one angled face produced by three operations
*
The 5042, a pointed tip with
two
angled faces produced
in
%our operations
There are three machines:
0
The
LlOl
computer numerically controlled
(CNC)
lathe
The M201
CNC
Bridgeport Interact milling machine
The M202 Denford Easimill3 milling machine
The machine operating data are shown in Figure 6.3. It should be noted
that the times have been developed by the planners based on experience. The
machines should be capable of the following cycle times:
I I
Dept Despatch
60
Managing
Figure
6.1
Merlin
Gun
Technology: organization
118
TPM-A
Route
to
World-Class
Performance
-
5031
@2D
Side angle
@I=
5042
Pointed
Figure
6.2
Department
50
products
Part
5020
5031
5042
<[D
Forecast Operations
Total cycle
time (mins)
I
LlOl
I
M201
I
M202
I
RH
angle
I
LH
angle
1
13.50
29.50
45.50
Output per week
330
I
I
7200
I
4800
I
Scheduled running time
(min)
5200
I
Scheduled time per
1
7.5
1
6.00
1
16.00
16.00
cycle (min)
Figure
6.3
Department
50
machine operating data
Applying
the
TPM
irnprovemmf
plan
119
L101:
4.12
min
including loading
M201:
3
min
including loading
M202:
8.5
min
including loading
As
can be seen from the data
in
Figure
6.3,
the lathe
is
running
three
slufts
five days per
week;
the miller
M201
is
running
two
shifts,
five days; and the
miller
M202
is
running
two
shifts
plus overtime. Some cover
is
provided
for
the machines during the
shifts,
but there are
still
times when the machines
cannot be
m.
These planned stoppages
are
one
of
the reasons
for
the difference
between them.
There
are
some
tool
changes.
Sometimes
this
is
done by maintenance outside
production time. Usually some production time
is
lost
owing
to tool breakages.
There seem
to
be occasional quality problems where much of the output
has to be reworked to remove
burrs.
However, mostly there
are
few
quality
problems.
Department 50’s
financial
data are shown
in
Figure
6.4.
The company’s
shopfloor logistics are given
in
Figure
6.5.
6.3
TPM
presentation and plan
The equipment chosen for the pilot project
is
the
M201
milling
machine.
The
TPM
presentation
for
the
M201
team had the following headings:
Introduction
Plan
Equipment description
0
Equipment history
OEE assessment
The
six
losses
0
Criticality assessment
Condition appraisal
Refurbishment
Future asset care
Best practice routines
Problems/improvements
Lmplementation plan
Concluding remarks
As
discussed
in
earlier chapters, the
TPM
improvement plan has the
The
schedule
for
the project
is
shown
in
Figure
6.6.
following
three cycles and nine steps.
Measurement
cycle
0
Decide what to record and monitor
Decide the OEE measures: best
of
best, world class
0
Assess
the
six
losses
120
TPM-A
Route
to
Would-Class Performance
Profit forecast
Sales
Materials
Consumables
Inventory adjustment
Material costs
Direct labour
Pensions
Holiday pay
25’000
550.00
2.72
6.13
138.15
23.14
13.27
Labour
costs
Production
Depreciation
188.55
37.78
Production overheads
Technical
Administration
Selling
Finance
roo0
1322.36
558.85
174.56
226.33
61.26
104.15
77.26
33.35
Other overheads
Total costs
Profit
Cost
apportionment
Part Production Material Cycle
forecast cost/piece time
(min)
5020 45540
9.40 13.5
5031
10 120 9.40
29.5
5042
3 680 9.40
45.5
59
340
Revenue forecast
Part Total Operational
cost/piece margin
(%)
(E)
5020 14.41 25
5031 20.34 50
5042 26.28 100
Machine time
(h)
10 246.50
4 975.67
2 790.67
18
012.84
Selling
price
(E)
18.01
30.51
52.55
276.02 22%
86.60 7%
1235.76
Fixed Fixed
costs/product costs/piece
228
046
5.01
110 739 10.94
62 109 16.88
(E) (E)
400 894
Total
revenue
(E)
820 153
308
800
193 402
1 322 355
Figure
6.4
Department
50
financial data
Condition
cycle
Critically assess the equipment
Carry out an appraisal
of
its condition
Applying the
TPM
improvement plan
121
Pack and
despatch to
customer
File order
Order
t
received by date
Produce job
cards
Plan route based
on
capacity
To
stores
Issue material
and papers to
first station
Match up
job
card
with order
t
To
heat
treatment,
etc.
T
1
Second
operation
Pass to
second
station
t
First
2
operation
Figure
6.5
Merlin
Gun
Technology: shopfloor logistics
Activity
Plan
Equipment description
Collect equipment history
Define
OEE
Assess
6
losses
Criticality assessment
Condition
appraisal
Refurbishment plan
Future asset care
Best practice
Problemshmprovements
Implementation plan
Presentation preparation
Tuesday
I
Wednesday
I
Wednesday
Thursday
am
Figure
6.6
Miller
M201
project management plan