ADVANCED ONSITE WASTEWATER SYSTEMS TECHNOLOGIES - CHAPTER 2 pptx
Bạn đang xem bản rút gọn của tài liệu. Xem và tải ngay bản đầy đủ của tài liệu tại đây (1.31 MB, 41 trang )
© 2006 by Taylor & Francis Group, LLC
31
chapter two
Decentralized wastewater
solutions
Introduction
Society today has widely accepted the importance of adequate wastewater
treatment prior to discharge as opposed to discharge of untreated wastewa-
ter. Wastewater treatment prior to discharge is necessary to ensure protection
of water quality and to reduce requirements for treatment of potable water.
of centralized collection systems was viewed as a cost-effective permanent
concept for wastewater treatment, while the use of conventional onsite sys-
tems, typically septic systems, was viewed as a temporary solution for areas
outside the reach of centralized collection systems. By the end of the 20th
century, wastewater professionals realized that centralized collection and
treatment is not the only way for managing wastewater and it is impossible
to extend centralized collection systems to many areas where new growth
is occurring. Rural “electrification” (extending the central electric service
grid to all of the populace) is no longer the model for serving the entire
population of the U.S. with adequate wastewater collection, treatment, and
effluent dispersal. Decentralized wastewater solutions can and will play an
important role for managing wastewater in the future. Thus, advanced onsite
wastewater systems technologies offer alternatives not only to conventional
septic systems but also to centralized wastewater solutions.
In this chapter, we explain what the term decentralized wastewater solution
means, how it differs from centralized wastewater and conventional septic
system solutions, and how to look at wastewater within the framework of
decentralized wastewater solutions.
As mentioned in Chapter 1, during the 19th and the 20th centuries, the use
© 2006 by Taylor & Francis Group, LLC
32 Advanced onsite wastewater systems technologies
The term decentralized
The term decentralized wastewater solution has several aliases, including on-lot
system, onsite system, individual wastewater system, cluster system, and commu-
nity system. The main idea behind decentralized wastewater solutions is to
manage (treat and disperse or reuse) wastewater at or near the place where
it is produced. Centralized wastewater solutions manage the wastewater in
a central location that typically is far away from the place where it is pro-
duced. The other main difference between decentralized and centralized
wastewater solutions is in terms of the receiving environment into which
the effluent (treated wastewater) is released. Centralized wastewater systems
typically release effluent into surface water bodies, such as oceans, rivers,
streams, or creeks, whereas decentralized wastewater systems typically
release effluent into soil or on top of land.
Why does one need to consider the use of decentralized wastewater
systems? There are many reasons. For example, many old septic systems are
not working correctly and sewage is seen on top of drain fields or sewage
is backing up in homes. The sewer system that was supposed to arrive in a
particular area just is not coming or citizens do not want it to come. Someone
is planning to build a new home or develop a business in the area where
you cannot get a permit to install a conventional septic system because the
land does not percolate (“perc”), or poor water quality is observed in lakes
or other surface water bodies resulting from a large number of malfunction-
ing septic tank systems that have been in use for decades.
For new developments, it is not uncommon for the nearest centralized
municipal wastewater collection and treatment systems to be too far away
to be economically accessible. In rapidly developing areas, municipal collec-
tion and treatment systems simply have not kept pace to provide capacity
for the population growth. Decentralized systems can provide developers
with wastewater collection and treatment solutions. For many developers
who want to maximize lot density, decentralized solutions in the form of
cluster collection treatment and dispersal systems provide a means to max-
imize density and meet the wastewater needs necessary to develop. In some
cases, developers would like to provide “green” development by reusing
water rather than flushing it down the sewer and not being able to recover
any of its value. The wastewater using advanced onsite wastewater systems
technologies can easily be treated and reused for irrigation of green space
within the development. For areas where water is a precious commodity,
and homeowners enjoy having green lawns, reusing treated wastewater
effluent provides a means to achieve this goal and, at the same time, recover
the value of water rather than throw it down the sewer.
In some areas of the U.S., homeowners are currently being rewarded
tens of thousands of dollars to remove their lawns and replace their grass
with xeriscaping in order to reduce water usage. At the same time, in these
same areas, sewage is simply being dumped down the sewers and treated
at great expense so that it can be disposed of into surface water bodies. In
© 2006 by Taylor & Francis Group, LLC
Chapter two: Decentralized wastewater solutions 33
some cases, rural water districts have responded to their patrons by provid-
ing managed decentralized wastewater systems, while at the same time
generating additional revenue for the water district. Areas within these
districts have seen a surge in growth because developers are able to provide
“city water” and “city sewers” to homeowners and developers.
If for any of the aforementioned reasons, or for other similar reasons,
you want to address wastewater needs using decentralized wastewater sys-
tems, you now can do so using advanced onsite wastewater systems tech-
nologies. Use of these technologies have only two conditions: you must have
an adequate management entity present in your area that can own and
operate the technologies and you must have a legal and regulatory frame-
work that recognizes the use of advanced onsite wastewater systems with
management. We discuss more about the management entity and legal and
The decentralized wastewater management solutions are presented as
positive developments for rural areas. Although the authors agree, as do
most people, that successful wastewater treatment with subsequent dispersal
of treated water to the hydrologic cycle is a positive and healthy goal,
planning commissions have used lack of adequate wastewater collection,
treatment, and dispersal as a method to prevent urban sprawl and uncon-
trolled development in rural and suburban areas. With the advent of feasible,
easily achievable wastewater collection and treatment for decentralized sys-
tems, planning commissions can no longer use wastewater as a mechanism
or an excuse to control growth. Decentralized wastewater technology has
“grown up” and taken that excuse away from planners. This puts planning
commissions in the unfortunate and politically unpopular position of having
to pass ordinances that limit growth on its face value rather than using
wastewater regulatory agencies as their enforcement department for con-
trolling growth. We propose ideas for planning with managed decentralized
Centralized versus decentralized solutions
The main objective of any wastewater solution (centralized or decentralized)
is to adequately treat wastewater before releasing effluent into the environ-
ment. The cost of wastewater management systems is always the main issue
in any public or private decision-making process. What is an appropriate
cost for wastewater management? The answer depends on many factors,
including the level of treatment necessary prior to discharge and the overall
socioeconomic standards of the location. Typically, water and wastewater
projects are viewed as public projects, and they are funded by either grant
or low-interest loan funds, especially when centralized solutions are
employed. The total capital cost of any such project is divided among the
users and charged as connection or hook-up fees, and operating costs are
charged based on usage.
regulatory framework in Chapters 6 and 7.
onsite systems in Chapter 8.
© 2006 by Taylor & Francis Group, LLC
34 Advanced onsite wastewater systems technologies
Components of wastewater systems
The three basic components of any wastewater system are collection, treat-
ment, and disposal (dispersal) systems. Of these three components, collection
is the least important for treatment of wastewater. In the past, collection was
a necessary and important component of wastewater systems mainly
because the use of advanced treatment technologies was not cost-effective
when employed for treating small quantities of wastewater. However, we
now have access to wastewater treatment technologies that can treat waste-
water in small quantities and meet the necessary discharge standards in a
cost-effective manner, thus collection of large quantities of wastewater in
one central location for treatment of an entire city’s or region’s wastewater
is no longer needed. Wastewater solutions can now be offered using decen-
tralized, small-scale systems with a cost-effectiveness similar to what was
once only possible using a centralized, large-scale system. Granted, tradi-
tional wastewater collection and treatment systems are exactly the correct
solution in areas where housing and business density and numbers makes
this traditional approach economically superior; however, in less densely
populated areas, the traditional approach may not be the best solution.
Categorizing decentralized and centralized systems
There are no well-defined standards for quantitatively determining whether
a proposed wastewater solution can be viewed as a decentralized or central-
ized system. We propose that if the capital and operational costs allocated
to the collection components (such as sewer lines and pump stations) of a
wastewater solution system are less than 25% of the total project costs, then
the solution may be viewed as a decentralized wastewater solution. By
minimizing the costs associated with collection of untreated wastewater, one
can maximize the capital and operational funding for wastewater treatment
and effluent dispersal and reuse components of the system. If you think that
the capital costs for your proposed new wastewater system are too much,
we suggest that you find out the costs associated with the collection com-
ponent of the entire system; if it is more than 25% of the total cost, you
should consider decentralized wastewater systems to meet your demand for
wastewater treatment.
The other key factor of a decentralized wastewater solution is the method
by which and the receiving environment in which the effluent is released
back into the environment. Decentralized wastewater systems offer alterna-
tives to surface water discharge of effluent. This is very important for com-
munities that rely primarily on groundwater as their source of drinking
water. Treating wastewater onsite and dispersing effluent using land-based
effluent dispersal systems can recharge groundwater, thus offering a sustain-
able source of fresh water to communities. In addition, land-based effluent
dispersal technologies can reap the benefits of soil as a natural filtration
medium and a buffer between the effluent and the source water, which is
© 2006 by Taylor & Francis Group, LLC
Chapter two: Decentralized wastewater solutions 35
typically not possible when effluent is dispersed into surface water. An
additional benefit for communities and other areas dependent on ground
water as a source of drinking water is that, by providing measurable, effec-
tive, managed treatment of sewage (as contrasted to traditional septic tank
drain fields), groundwater is protected from unknown contaminants from
septic tanks. Rural water districts reap the benefits of well-head protection
by providing decentralized wastewater systems to their patrons.
The science of wastewater
For both decentralized and centralized wastewater solutions, it is important
to understand the science behind wastewater treatment and wastewater
treatment classification schemes. Wastewater treatment is important and
necessary to minimize pollution from discharged effluent into the environ-
ment. However, what is pollution? There are many technical and legal def-
initions of the term pollution. Technically, pollution means undesirable or
adverse environmental conditions caused by the discharge of untreated or
inadequately treated wastewater into an environment. Since matter can nei-
ther be created nor destroyed, from a very fundamental viewpoint, pollution
is a natural resource that is misplaced.
Many states have legal definitions of the term pollution. For example, in
Virginia, the State Water Control Law of Virginia § 62.1-44.3 states:
“Pollution” means such alteration of the physical, chemical or
biological properties of any state waters as will or is likely to
create a nuisance or render such waters (a) harmful or detrimental
or injurious to the public health, safety or welfare, or to the health
of animals, fish or aquatic life; (b) unsuitable with reasonable
treatment for use as present or possible future sources of public
water supply; or (c) unsuitable for recreational, commercial, in-
dustrial, agricultural, or other reasonable uses, provided that (i)
an alteration of the physical, chemical, or biological property of
state waters, or a discharge or deposit of sewage, industrial wastes
or other wastes to state waters by any owner which by itself is
not sufficient to cause pollution, but which, in combination with
such alteration of or discharge or deposit to state waters by other
owners, is sufficient to cause pollution; (ii) the discharge of un-
treated sewage by any owner into state waters; and (iii) contrib-
uting to the contravention of standards of water quality duly
established by the Board, are “pollution”.
Pollution scale
In order to define the term pollution in a quantitative (objective) manner,
rather than just a qualitative (subjective) manner as defined by any environ-
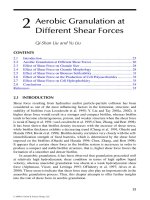
mental law, we propose a Pollution Scale from 0 to 10 (Figure 2-1). This scale
© 2006 by Taylor & Francis Group, LLC
36 Advanced onsite wastewater systems technologies
can be used for any water-quality related project; however, in this book, we
use the scale to differentiate between drinking water and wastewater qual-
ities.
It should be noted that the scale proposed here is in contrast to the
current, subjective, somewhat loosely defined terminology of “primary,”
“secondary,” and “tertiary” treatment. The terms primary, secondary, and
tertiary seem to be fairly loosely interpreted by professionals around the U.S.
and, in fact, recently, an additional term, advanced secondary has come into
use. We propose to define treatment levels (and therefore pollution level) in
terms of a measurable, quantifiable scale that ranks wastewater treatment
in terms of easily identifiable values ranging from drinking water to raw
sewage. We also propose quantitative values for treatment levels and a
method to determine overall treatment level (OTL) for an advanced onsite
treatment technology. An onsite system designer’s job would be to select an
advanced onsite treatment technology that would be suitable for discharge
of effluent into the receiving environment present at a project site, thus
minimizing the potential for pollution.
Water by its very nature cannot be found in its purest form. There are
always some impurities dissolved in natural water. The U.S. Environmental
Protection Agency (EPA) has established the acceptable drinking water qual-
there are 87 primary and 15 secondary standards for acceptable drinking
water quality. On one extreme of the Pollution Scale, 0 indicates water that
meets drinking water quality, in other words, the levels of all of the 102
contaminants are within the limits specified in Table 2.1 (a) and (b). On the
other extreme of the Pollution Scale, 10 indicates untreated (raw) wastewater
also called sewage. The basic idea behind any wastewater treatment scheme
is to reduce the level of pollutants and move towards the left end of the
Pollution Scale.
An inverse relationship can be developed between water quality on the
Pollution Scale and treatment level, and terms such as raw wastewater, effluent,
wastewater treatment scheme, treatment up to some degree can be achieved
prior to discharging effluent into a receiving environment (RE); the remainder
of treatment can be achieved after dispersal into the environment by natural
activities as well as by dilution. The treatment level necessary before dispersal
depends on the characteristics of the RE and its overall assimilative capacity.
Figure 2.1 Pollution Scale from 0 (drinking water) to 10 (sewage) for differentiating
between drinking water and sewage.
Water Effluent Sewage
0
1
2
3
4
5
6
7
8
9
10
and drinking water can be defined as shown in Table 2.2. Note that in any
ity standards shown in Table 2.1 (a) and (b). Note that at the present time
Chapter two: Decentralized wastewater solutions 37
Table 2.1 EPA National Primary Drinking Water Standards
Contaminant
MCL or TT
1
(mg/l)
2
Potential health effects from exposure
above the MCL
Common sources of contaminant
in drinking water
Public
Health
Goal
OC Acrylamide TT8 Nervous system or blood problems; Added to water during sewage/
wastewater increased risk of cancer
treatment
zero
OC Alachlor 0.002 Eye, liver, kidney or spleen problems;
anemia; increased risk of cancer
Runoff from herbicide used on row
crops
zero
R Alpha particles 15picocuries
per Liter
(pCi/L)
Increased risk of cancer Erosion of natural deposits of certain
minerals that are radioactive and may
emit a form of radiation known as
alpha radiation
zero
IOC Antimony 0.006 Increase in blood cholesterol; decrease in
blood sugar
Discharge from petroleum refineries;
fire retardants; ceramics; electronics;
solder
0.006
IOC Arsenic 0.010 as of 1/
23/06
Skin damage or problems with circulatory
systems, and may have increased risk of
getting cancer
Erosion of natural deposits; runoff
from orchards, runoff from glass &
electronics production wastes
0
IOC Asbestos (fibers
>10micrometers)
7 million
fibers per
Liter (MFL)
Increased risk of developing benign
intestinal polyps
Decay of asbestos cement in water
mains; erosion of natural deposits
7 MFL
OC Atrazine 0.003 Cardiovascular system or reproductive
problems
Runoff from herbicide used on row
crops
0.003
IOC Barium 2 Increase in blood pressure Discharge of drilling wastes; discharge
from metal refineries; erosion of
natural deposits
2
OC Benzene 0.005 Anemia; decrease in blood platelets;
increased risk of cancer
Discharge from factories; leaching from
gas storage tanks and landfills
zero
OC Benzo(a)pyrene
(PAHs)
0.0002 Reproductive difficulties; increased risk of
cancer
Leaching from linings of water storage
tanks and distribution lines
zero
© 2006 by Taylor & Francis Group, LLC
38 Advanced onsite wastewater systems technologies
IOC Beryllium 0.004 Intestinal lesions Discharge from metal refineries and
coal-burning factories; discharge from
electrical, aerospace, and defense
industries
0.004
R Beta particles and
photon emitters
4 millirems
per year
Increased risk of cancer Decay of natural and man-made
deposits of certain minerals that are
radioactive and may emit forms of
radiation known as photons and beta
radiation
zero
DBP Bromate 0.010 Increased risk of cancer Byproduct of drinking water
disinfection
zero
IOC Cadmium 0.005 Kidney damage Corrosion of galvanized pipes; erosion
of natural deposits; discharge from
metal refineries; runoff from waste
batteries and paints
0.005
OC Carbofuran 0.04 Problems with blood, nervous system, or
reproductive system
Leaching of soil fumigant used on rice
and alfalfa
0.04
OC Carbon tetrachloride 0.005 Liver problems; increased risk of cancer Discharge from chemical plants and
other industrial activities
zero
D Chloramines (as Cl2) MRDL=4.01 Eye/nose irritation; stomach discomfort,
anemia
Water additive used to control
microbes
MRDLG
=41
OC Chlordane 0.002 Liver or nervous system problems;
increased risk of cancer
Residue of banned termiticide zero
D Chlorine (as Cl2) MRDL=4.01 Eye/nose irritation; stomach discomfort
Water additive used to control
microbes
MRDLG
=41
D Chlorine dioxide (as
ClO2)
MRDL=0.81 Anemia; infants & young children: nervous
system effects
Water additive used to control
microbes
MRDLG
=0.81
Table 2.1 EPA National Primary Drinking Water Standards
Contaminant
MCL or TT
1
(mg/l)
2
Potential health effects from exposure
above the MCL
Common sources of contaminant
in drinking water
Public
Health
Goal
© 2006 by Taylor & Francis Group, LLC
Chapter two: Decentralized wastewater solutions 39
DBP Chlorite 1.0 Anemia; infants & young children: nervous
system effects
Byproduct of drinking water
disinfection
0.8
OC Chlorobenzene 0.1 Liver or kidney problems Discharge from chemical and
agricultural chemical factories
0.1
IOC Chromium (total) 0.1 Allergic dermatitis Discharge from steel and pulp mills;
erosion of natural deposits
0.1
IOC Copper TT7; Action
Level = 1.3
Short term exposure: Gastrointestinal
distress. Long term exposure: Liver or
kidney damage. People with Wilson’s
Disease should consult their personal
doctor if the amount of copper in their
water exceeds the action level
Corrosion of household plumbing
systems; erosion of natural deposits
1.3
M Cryptosporidium TT3 Gastrointestinal illness (e.g., diarrhea,
vomiting, cramps)
Human and animal fecal waste zero
IOC Cyanide (as free
cyanide)
0.2 Nerve damage or thyroid problems Discharge from steel/metal factories;
discharge from plastic and fertilizer
factories
0.2
OC 2,4-D 0.07 Kidney, liver, or adrenal gland problems Runoff from herbicide used on r
ow
crops
0.07
OC Dalapon 0.2 Minor kidney changes Runoff from herbicide used on rights
of way
0.2
OC 1,2-Dibromo-3-chlorop
ropane (DBCP)
0.0002 Reproductive difficulties; increased risk of
cancer
Runoff/leaching from soil fumigant
used on soybeans, cotton, pineapples,
and orchards
zero
OC o-Dichlorobenzene 0.6 Liver, kidney, or circulatory system
problems
Discharge from industrial chemical
factories
0.6
OC p-Dichlorobenzene 0.075 Anemia; liver, kidney or spleen damage;
changes in blood
Discharge from industrial chemical
factories
0.075
Table 2.1 EPA National Primary Drinking Water Standards
Contaminant
MCL or TT
1
(mg/l)
2
Potential health effects from exposure
above the MCL
Common sources of contaminant
in drinking water
Public
Health
Goal
© 2006 by Taylor & Francis Group, LLC
40 Advanced onsite wastewater systems technologies
OC 1,2-Dichloroethane 0.005 Increased risk of cancer Discharge from industrial chemical
factories
zero
OC 1,1-Dichloroethylene 0.007 Liver problems Discharge from industrial chemical
factories
0.007
OC cis-1,2-Dichloroethylen
e
0.07 Liver problems Discharge from industrial chemical
factories
0.07
OC trans-1,2-Dichloroethyl
ene
0.1 Liver problems Discharge from industrial chemical
factories
0.1
OC Dichloromethane 0.005 Liver problems; increased risk of cancer Discharge from drug and chemical
factories
zero
OC 1,2-Dichloropropane 0.005 Increased risk of cancer Discharge from industrial chemical
factories
zero
OC Di(2-ethylhexyl)
adipate
0.4 Weight loss, live problems, or possible
reproductive difficulties
Discharge from chemical factories 0.4
OC Di(2-ethylhexyl)
phthalate
0.006 Reproductive difficulties; liver problems;
increased risk of cancer
Discharge from rubber and chemical
factories
zero
OC Dinoseb 0.007 Reproductive difficulties Runoff from herbicide used on
soybeans and vegetables
0.007
OC Dioxin (2,3,7,8-TCDD) 0.00000003 Reproductive difficulties; increased risk of
cancer
Emissions from waste incineration and
other combustion; discharge from
chemical factories
zero
OC Diquat 0.02 Cataracts Runoff from herbicide use 0.02
OC Endothall 0.1 Stomach and intestinal problems Runoff from herbicide use 0.1
OC Endrin 0.002 Liver problems Residue of banned insecticide 0.002
OC Epichlorohydrin TT8 Increased cancer risk, and over a long
period of time, stomach problems
Discharge from industrial chemical
factories; an impurity of some water
treatment chemicals
zero
OC Ethylbenzene 0.7 Liver or kidneys problems Discharge from petroleum refineries 0.7
Table 2.1 EPA National Primary Drinking Water Standards
Contaminant
MCL or TT
1
(mg/l)
2
Potential health effects from exposure
above the MCL
Common sources of contaminant
in drinking water
Public
Health
Goal
© 2006 by Taylor & Francis Group, LLC
Chapter two: Decentralized wastewater solutions 41
OC Ethylene dibromide 0.00005 Problems with liver, stomach, reproductive
system, or kidneys; increased risk of cancer
Discharge from petroleum refineries zero
IOC Fluoride 4.0 Bone disease (pain and tenderness of the
bones); Children may get mottled teeth
Water additive which promotes strong
teeth; erosion of natural deposits;
discharge from fertilizer and
aluminum factories
4.0
M
Giardia lamblia TT3 Gastrointestinal illness (e.g., diarrhea,
vomiting, cramps)
Human and animal fecal waste zero
OC Glyphosate 0.7 Kidney problems; reproductive difficulties Runoff from herbicide use 0.7
DBP Haloacetic acids
(HAA5)
0.060 Increased risk of cancer Byproduct of drinking water
disinfection
n/a6
OC Heptachlor 0.0004 Liver damage; increased risk of cancer Residue of banned termiticide
zero
OC Heptachlor epoxide 0.0002 Liver damage; increased risk of cancer Breakdown of heptachlor
zero
M Heterotrophic plate
count (HPC)
TT3 HPC has no health effects; it is an analytic
method used to measure the variety of
bacteria that are common in water. The
lower the concentration of bacteria in
drinking water, the better maintained the
water system is.
HPC measures a range of bacteria that
are naturally present in the
environment
n/a
OC Hexachlorobenzene 0.001 Liver or kidney problems; reproductive
difficulties; increased risk of cancer
Discharge from metal refineries and
agricultural chemical factories
zero
OC Hexachlorocyclopenta
diene
0.05 Kidney or stomach problems Discharge from chemical factories 0.05
IOC Lead TT7; Action
Level = 0.015
Infants and children: Delays in physical or
mental development; children could show
slight deficits in attention span and
learning abilities; Adults: Kidney
problems; high blood pressure
Corrosion of household plumbing
systems; erosion of natural deposits
zero
Table 2.1 EPA National Primary Drinking Water Standards
Contaminant
MCL or TT
1
(mg/l)
2
Potential health effects from exposure
above the MCL
Common sources of contaminant
in drinking water
Public
Health
Goal
© 2006 by Taylor & Francis Group, LLC
42 Advanced onsite wastewater systems technologies
M Legionella TT3 Legionnaire’s Disease, a type of pneumonia Found naturally in water; multiplies in
heating systems
zero
OC Lindane 0.0002 Liver or kidney problems Runoff/leaching from insecticide used
on cattle, lumber, gardens
0.0002
IOC Mercury (inorganic) 0.002 Kidney damage Erosion of natural deposits; discharge
from refineries and factories; runoff
from landfills and croplands
0.002
OC Methoxychlor 0.04 Reproductive difficulties Runoff/leaching from insecticide used
on fruits, vegetables, alfalfa,
livest
ock
0.04
IOC Nitrate (measured as
Nitrogen)
10 Infants below the age of six months who
drink water containing nitrate in excess of
the MCL could become seriously ill and, if
untreated, may die. Symptoms include
shortness of breath and blue-baby
syndrome.
Runoff from fertilizer use; leaching
from septic tanks, sewage; erosion of
natural deposits
10
IOC Nitrite (measured as
Nitrogen)
1 Infants below the age of six months who
drink water containing nitrite in excess of
the MCL could become seriously ill and, if
untreated, may die. Symptoms include
shortness of breath and blue-baby
syndrome.
Runoff from fertilizer use; leaching
from septic tanks, sewage; erosion of
natural deposits
1
OC Oxamyl (Vydate) 0.2 Slight nervous system effects Runoff/leaching from insecticide used
on apples, potatoes, and tomatoes
0.2
OC Pentachlorophenol 0.001 Liver or kidney problems; increased cancer
risk
Discharge from wood preserving
factories
zero
OC Picloram 0.5 Liver problems Herbicide runoff 0.5
Table 2.1 EPA National Primary Drinking Water Standards
Contaminant
MCL or TT
1
(mg/l)
2
Potential health effects from exposure
above the MCL
Common sources of contaminant
in drinking water
Public
Health
Goal
© 2006 by Taylor & Francis Group, LLC
Chapter two: Decentralized wastewater solutions 43
OC Polychlorinated
biphenyls (PCBs)
0.0005 Skin changes; thymus gland problems;
immune deficiencies; reproductive or
nervous system difficulties; increased risk
of cancer
Runoff from landfills; discharge of
waste chemicals
zero
R Radium 226 and
Radium 228
(combined)
5 pCi/L Increased risk of cancer
Erosion of natural deposits zero
IOC Selenium 0.05 Hair or fingernail loss; numbness in fingers
or toes; circulatory problems
Discharge from petroleum refineries;
erosion of natural deposits; discharge
from mines
0.05
OC Simazine 0.004 Problems with blood Herbicide runoff 0.004
OC Styrene 0.1 Liver, kidney, or circulatory system
problems
Discharge from rubber and plastic
factories; leaching from landfills
0.1
OC Tetrachloroethylene 0.005 Liver problems; increased risk of cancer Discharge from factories and dry
cleaners
zero
IOC Thallium 0.002 Hair loss; changes in blood; kidney,
intestine, or liver problems
Leaching from ore-processing sites;
discharge from electronics, glass, and
drug factories
0.0005
OC Toluene 1 Nervous system, kidney, or liver problems Discharge from petroleum factories 1
M Total Coliforms
(including fecal
coliform and E. coli)
5.0%4 Not a health threat in itself; it is used to
indicate whether other potentially harmful
bacteria may be present5
Coliforms are naturally present in the
environment as well as feces; fecal
coliforms and E. coli only come from
human and animal fecal waste.
zero
DBP Total Trihalomethanes
(TTHMs)
0.10 0.080
after 12/31/
03
Liver, kidney or central nervous system
problems; increased risk of cancer
Byproduct of drinking water
disinfection
n/a6
OC Toxaphene 0.003 Kidney, liver, or thyroid problems;
increased risk of cancer
Runoff/leaching from insecticide used
on cotton and cattle
zero
Table 2.1 EPA National Primary Drinking Water Standards
Contaminant
MCL or TT
1
(mg/l)
2
Potential health effects from exposure
above the MCL
Common sources of contaminant
in drinking water
Public
Health
Goal
© 2006 by Taylor & Francis Group, LLC
44 Advanced onsite wastewater systems technologies
OC 2,4,5-TP (Silvex) 0.05 Liver problems Residue of banned herbicide 0.05
OC 1,2,4-Trichlorobenzene 0.07 Changes in adrenal glands Discharge from textile finishing
factories
0.07
OC 1,1,1-Trichloroethane 0.2 Liver, nervous system, or circulatory
problems
Discharge from metal degreasing sites
and other factories
0.20
OC 1,1,2-Trichloroethane 0.005 Liver, kidney, or immune system problems Discharge from industrial chemical
factories
0.003
OC Trichloroethylene 0.005 Liver problems; increased risk of cancer Discharge from metal degreasing sites
and other factories
zero
M Turbidity TT3 Turbidity is a measure of the cloudiness of
water. It is used to indicate water quality
and filtration effectiveness (e.g., whether
disease-causing organisms are present).
Higher turbidity levels are often associated
with higher levels of disease-causing
micro-organisms such as viruses, parasites
and some bacteria. These organisms can
cause symptoms such as nausea, cramps,
diarrhea, and associated headaches
Soil runoff n/a
R Uranium 30 ug/L as of
12/08/03
Increased risk of cancer, kidney toxicity Erosion of natural deposits
zero
OC Vinyl chloride 0.002 Increased risk of cancer Leaching from PVC pipes; discharge
from plastic factories
zero
M Viruses (enteric) TT3 Gastrointestinal illness (e.g., diarrhea,
vomiting, cramps)
Human and animal fecal waste Zero
OC Xylenes (total) 10 Nervous system damage Discharge from petroleum factories;
discharge from chemical factories
10
Table 2.1 EPA National Primary Drinking Water Standards
Contaminant
MCL or TT
1
(mg/l)
2
Potential health effects from exposure
above the MCL
Common sources of contaminant
in drinking water
Public
Health
Goal
© 2006 by Taylor & Francis Group, LLC
Chapter two: Decentralized wastewater solutions 45
NOTES
1 Definitions
• Maximum Contaminant Level Goal (MCLG)—The level of a contaminant in drinking water below which ther
e is no known or expected risk to
health. MCLGs allow for a margin of safety and are non-enforceable public health goals consideration. MCLs are enforceable standards.
• Maximum Residual Disinfectant Level Goal (MRDLG)—The level of a drinking water disinfectant below which ther
e is no known or expected
risk to health. MRDLGs do not reflect the benefits of the use of disinfectants to contr
ol microbial contaminants.
• Maximum Residual Disinfectant Level (MRDL)—The highest level of a disinfectant allowed in drinking water
. There is convincing evidence
that addition of a disinfectant is necessary for control of microbial contaminants.
• Treatment Technique (TT)—A required process intended to reduce the level of a contaminant in drinking water.
2 Units are in milligrams per liter (mg/L) unless otherwise noted. Milligrams per liter are equivalent to parts per million (pp
m).
3 EPA’s surface water treatment rules require systems using surface water or gr
ound water under the direct influence of surface water to (1) disinfect
their water, and (2) filter their water or meet criteria for avoiding fi
ltration so that the following contaminants are controlled at the following levels:
• Cryptosporidium (as of 1/1/02 for systems serving >10,000 and 1/14/05 for systems serving <10,000) 99% r
emoval.
• Giardia lamblia: 99.9% removal/inactivation
• Viruses: 99.99% removal/inactivation
• Legionella: No limit, but EPA believes that if Giardia and viruses ar
e removed/inactivated, Legionella will also be controlle
d.
• Turbidity: At no time can turbidity (cloudiness of water) go above 5 nephelolometric turbidity units (NTU); systems that fi
lter must ensure that
the turbidity go no higher than 1 NTU (0.5 NTU for conventional or direct filtration) in at least 95% of the daily samples in an
y month. As of
January 1, 2002, for systems servicing >10,000, and January 14, 2005, for systems servicing <10,000, turbidity may never exceed
1 NTU, and must
not exceed 0.3 NTU in 95% of daily samples in any month.
• HPC: No more than 500 bacterial colonies per milliliter
• Long Term 1 Enhanced Surface Water Treatment (Effective Date: January 14, 2005); Surface water systems or (GWUDI) systems ser
ving fewer
than 10,000 people must comply with the applicable Long Term 1 Enhanced Surface Water Treatment Rule provisions (e.g. turbidity
standards,
individual filter monitoring, Cryptosporidium removal requirements, updated watershed control requirements for unfilter
ed systems).
• Filter Backwash Recycling: The Filter Backwash Recycling Rule requir
es systems that recycle to return specific recycle flows through all processes
of the system’s existing conventional or direct filtration system or at an alternate location approved by the state
Table 2.1 EPA National Primary Drinking Water Standards
Contaminant
MCL or TT
1
(mg/l)
2
Potential health effects from exposure
above the MCL
Common sources of contaminant
in drinking water
Public
Health
Goal
© 2006 by Taylor & Francis Group, LLC
46 Advanced onsite wastewater systems technologies
4 No more than 5.0% samples total coliform-positive in a month. (For water systems that collect fewer than 40 r
outine samples per month, no more than
one sample can be total coliform-positive per month.) Every sample that has total coliform must be analyzed for either fecal co
liforms or E. coli
if two consecutive TC-positive samples, and one is also positive for E. coli fecal coliforms, system has an acute MCL violation
.
5 Fecal coliform and E. coli are bacteria whose presence indicates that the water may be contaminated with human or animal wast
es. Disease-causing
microbes (pathogens) in these wastes can cause diarrhea, cramps, nausea, headaches, or other symptoms. These pathogens may pose
a special
health risk for infants, young children, and people with severely compromised immune systems.
6 Although there is no collective MCLG for this contaminant group, ther
e are individual MCLGs for some of the individual contaminants:
• Haloacetic acids: dichloroacetic acid (zero); trichloroacetic acid (0.3 mg/L)
• Trihalomethanes: bromodichloromethane (zero); bromoform (zer
o); dibromochloromethane (0.06 mg/L)
7 Lead and copper are regulated by a Treatment Technique that r
equires systems to control the corrosiveness of their water. If more than 10% of tap
water samples exceed the action level, water systems must take additional steps. For copper
, the action level is 1.3 mg/L, and for lead is 0.015 mg/L
8 Each water system must certify, in writing, to the state (using thir
d-party or manufacturers certification) that when it uses
acrylamide and/or
epichlorohydrin to treat water, the combination (or product) of dose and monomer level does not exceed the levels specifi
ed, as follows: Acrylamide
= 0.05% dosed at 1 mg/L (or equivalent); Epichlorohydrin = 0.01% dosed at 20 mg/L (or equivalent).
Table 2.1 EPA National Primary Drinking Water Standards
Contaminant
MCL or TT
1
(mg/l)
2
Potential health effects from exposure
above the MCL
Common sources of contaminant
in drinking water
Public
Health
Goal
© 2006 by Taylor & Francis Group, LLC
© 2006 by Taylor & Francis Group, LLC
Chapter two: Decentralized wastewater solutions 47
In this chapter, we present basics of wastewater treatment, wastewater char-
acterization, and classification of OTLs prior to dispersal of effluent into a RE.
We assume that the reader is familiar with terms that are typically used to
describe the quality of untreated wastewater and effluent, such as biochemical
oxygen demand (BOD); total suspended solids (TSS); fats, oil, and grease
(FOG); Total Kjeldahl Nitrogen (TKN); total nitrogen (TN = TKN + nitrate
nitrogen); total phosphorus (TP); and fecal coliform (FC). Literature cited at
the end of this chapter offers more information on these terms.
The advanced science behind wastewater treatment is presented in a
number of textbooks that are listed in the reference section of this chapter.
Today, a number of pre-engineered advanced onsite wastewater treatment
technologies are available in the market, each is designed based on proven
scientific principles of wastewater treatment.
We will not go into details of the scientific principles and theories behind
wastewater treatment. Instead, we present basic information on wastewater
characterization and outline how to calculate OTLs obtained by currently avail-
able advanced onsite treatment systems.
Wastewater treatment basics
Treatability
In order to design onsite wastewater treatment systems, we must consider
the nature of the wastewater. Effluent quality depends on influent charac-
Table 2.1b National Secondary Drinking Water Standards
National Secondary Drinking Water Standards are non-enforceable guidelines
regulating contaminants that may cause cosmetic effects (such as skin or tooth
discoloration) or aesthetic effects (such as taste, odor, or color) in drinking water. EPA
recommends secondary standards to water systems but does not require systems to
comply. However, states may choose to adopt them as enforceable standards
Contaminant Secondary Standard
Aluminum 0.05 to 0.2 mg/L
Chloride 250 mg/L
Color 15 (color units)
Copper 1.0 mg/L
Corrosivity noncorrosive
Fluoride 2.0 mg/L
Foaming Agents 0.5 mg/L
Iron 0.3 mg/L
Manganese 0.05 mg/L
Odor 3 threshold odor number
pH 6.5-8.5
Silver 0.10 mg/L
Sulfate 250 mg/L
Total Dissolved Solids 500 mg/L
Zinc 5 mg/L
Source:
© 2006 by Taylor & Francis Group, LLC
48 Advanced onsite wastewater systems technologies
teristics. The influent characteristics, in turn, depend on the activities that
take place in the dwellings or businesses that generate the wastewater. Typ-
ically, we look at the wastewater generated from a single home or a group
of homes, with the main source of the wastewater being residential activities.
For other types of wastewater sources, we recommend that the onsite system
designer (a professional engineer or other professional educated and trained
in wastewater engineering) do a detailed study on the source activities to
determine what may be present in the raw wastewater. This is particularly
important for commercial establishments, in which wastewater is not gen-
erated by residences.
Treatment capacity and treatment efficiency of systems are calculated
based on influent concentrations and effluent requirements.
Efficiency = [(C
in
− C
out
)/C
in
] 100 (2.1)
Table 2.2 Pollution Scale versus Overall Treatment Levels (OTL) before Discharge
Pollution Scale
OTL Before
Discharge Treatment Level Terms
10.0 0% Raw Sewage
9.0 10% Effluent
8.5 15%
8.0 20%
7.5 25%
7.0 30% 1
6.5 35%
6.0 40%
5.5 45%
5.0 50%
4.5 55%
4.0 60%
3.5 65%
3.0 70%
2.5 75%
2.0 80% 2
1.5 85%
1.0 90%
0.9 91%
0.8 92%
0.7 93% 3
0.6 94%
0.5 95%
0.4 96%
0.3 97%
0.2 98% 4
0.1 99% Effluent
0.0 100% 5 Drinking
Water
© 2006 by Taylor & Francis Group, LLC
Chapter two: Decentralized wastewater solutions 49
where
C in = Influent concentration (typically mg/L)
C out = Effluent concentration (typically mg/L)
Efficiency is expressed as a percentage (%)
Also, the treatment capacity over time for biochemical processes is usually
modeled as a first-order equation such that:
C
t
/C
0
= e
−kt
(2.2)
where
C
t
= Concentration at time t (typically in mg/L)
C
0
= Initial concentration at time = 0 (typically in mg/L)
k = Reaction rate constant (typically in days
-1
)
t = time (typically in days)
For the purposes of explaining the importance of wastewater characteristics
here, wastewater strength (concentration of contaminants), the availability
of contaminants as a food source, and the characteristic of being easily
metabolized or difficult to metabolize are all important factors to consider
for designing treatment processes. Treating all wastewater as if it is residen-
tial wastewater can have disastrous results.
The source of the wastewater influences the characteristics of the waste
stream. In general, we can categorize the source as residential, municipal,
commercial, industrial, or agricultural. Tables documenting historically
accepted values for wastewater characteristics are available for domestic
wastewater. Untreated domestic wastewater has different characteristics
from septic tank effluent. Septic tank effluent from a tank with an effluent
screen (effluent filter) has different characteristics from unscreened effluent.
Grinder pump effluent has different characteristics from any of the others.
Wastewater from commercial sources, such as restaurants, schools, super-
markets, hospitals, hotels, and convenience stores with food service; car
washes; beauty salons; and other types of establishments, can have charac-
teristics specific to the wastewater-generating activities conducted as part of
the business.
Typical components of raw wastewater and their concentrations are
typical domestic septic tank effluent. Most of the discussion so far, along
with the tables and graphs presented, has focused on the concentration of
constituents in wastewater. The concentration tables may be quite familiar.
However, another set of tables is available to the designer, showing typical
Onsite Wastewater Treatment Systems Manual, provides information on typical
residential wastewater flows from particular research projects. Most states
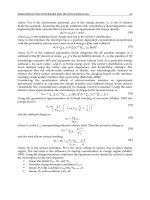
logical treatment in a septic tank (Figure 2.2), its characteristics have been
shown in Table 2.3. Once the raw sewage has undergone physical and bio-
altered from those of raw sewage. Table 2.4 illustrates the characteristics of
flow rates from various establishments. Table 2.5, from the U.S. EPA 2002
© 2006 by Taylor & Francis Group, LLC
50 Advanced onsite wastewater systems technologies
have tables within their own onsite wastewater regulations that prescribe
flows to be used for design. For larger flows, such as from multiple dwellings,
community systems, and subdivisions, the regulatory agencies generally
have an estimated flow per dwelling or equivalent dwelling unit (EDU) that
is used for design. Information regarding flow rates from sources other than
Wastewater Treatment Systems Manual.
on an average daily basis. Note that the concept of load is simply the product
of flow times the concentration, and the load to a wastewater treatment
system is the mass of the constituent that is expected to be treated by the
system.
Investigating the idea of load leads to a discussion of flows. Typical flows
from residential sources may be obtained from references on onsite and
Table 2.3 Raw Sewage Characteristics
Component Concentration Range
Typical
Concentration
Total suspended solids, TSS 155–330 mg/L 250 mg/L
5-day biochemical oxygen
demand, BOD
5
155–286 mg/L 250 mg/L
pH 6-9 s.u. 6.5 s.u.
Total coliform bacteria 10
8
–10
10
CFU/100mL 10
9
CFU/100mL
Fecal coliform bacteria 10
6
–10
8
CFU/100mL 10
7
CFU/100mL
Ammonium-nitrogen, NH
4
-N 4-13 mg/L 10 mg/L
Nitrate-nitrogen, NO
3
-N Less than 1 mg/L Less than 1 mg/L
Total nitrogen 26–75 mg/L 60 mg/L
Total phosphorus 6-12 mg/L 10 mg/L
Source: Onsite Wastewater Treatment Systems Manual U.S. EPA February 2002 (EPA/625/R-00/
008).
Note: mg/L = milligrams per liter; s.u. = standard units; CFU/100 mL = colony-forming
units per 100 milliliters.
Figure 2.2 Septic Tank Profile
residences is shown in Table 2.6, also taken from the U.S. EPA 2002 Onsite
Table 2.7 indicates the mass loads associated with domestic wastewater
© 2006 by Taylor & Francis Group, LLC
Chapter two: Decentralized wastewater solutions 51
decentralized wastewater systems, such as those cited in the reference sec-
tions of this text. Although Table 2.5 indicates the results of some of the
research producing ranges for estimating residential flows on a per person,
average daily basis, experience from some of the decentralized wastewater
systems indicates that actual average daily flows from a single residence
ranges from 150 gallons per day to approximately 200 gallons per day per
residence. These values are from cluster systems with septic tank effluent
Table 2.4 Septic Tank Effluent Characteristics
Component Concentration Range
Typical
Concentration
Total suspended solids, TSS 36-85 mg/L 60 mg/L
5-day biochemical oxygen
demand, BOD
5
118-189 mg/L 120 mg/L
pH 6.4–7.8 s.u. 6.5 s.u.
Fecal coliform bacteria 10
6
–10
7
CFU/100mL 10
6
CFU/100mL
Ammonium-nitrogen, NH
4
-N 30–50 mg/L 40 mg/L
Nitrate-nitrogen, NO
3
-N 0–10 mg/L 0 mg/L
Total nitrogen 29.5–63.4 mg/L 60 mg/L
Total phosphorus 8.1–8.2 mg/L 8.1 mg/L
Sources: U.S. Environmental Protection Agency. “Onsite Wastewater Treatment Systems
Manual,” EPA 625-R-00-008. Cincinnati, OH: U.S. EPA Publication Clearinghouse, 2002,
and Crites, R., and G. Tchobanoglous. Small and Decentralized Wastewater Management
Systems. Boston: WCB/McGraw-Hill Companies, Inc., 1998.
Table 2.5 Residential Wastewater Flows
Study
Number of
Residences
Study
Duration
(months)
Study Average
(gal/person/
day)
Study range
(gal/person/day)
Brown &
Caldwell
(1984)
210 66.2 (250.6)
a
57.3 – 73.0
(216.9 – 276.3)
b
Anderson
& Siegrist
(1989)
90 3 70.8 (268.0) 65.9 – 75.6
(249.4 – 289.9)
Anderson,
et al.
(1983)
25 2 50.7 (191.9) 26.1 – 85.2
(98.9 – 322.5)
Mayer et al.
(1999)
1188 1
c
69.3 (252.3) 57.1 – 83.5
(216.1 – 316.1)
Weighted
average
153 68.6 (259.7)
a
Based on indoor water use monitoring and not wastewater flow monitoring
b
Liters per person per day in parentheses
c
Based on 2 weeks of continuous monitoring in each of two seasons at each home
Sources: U.S. Environmental Protection Agency. “Onsite Wastewater Treatment Systems
Manual,” EPA 625-R-00-008. Cincinnati, OH: U.S. EPA Publication Clearinghouse, 2002.
© 2006 by Taylor & Francis Group, LLC
52 Advanced onsite wastewater systems technologies
pressure (STEP) sewers. When cluster systems are served by traditional
gravity sewer systems, the effect of infiltration and inflow must be consid-
ered in the design flows and loads. Viessman and Hammer (1998) advise
that infiltration and inflow may be as high as 60,000 gallons per day (gpd)
per mile where groundwater tables are high and sewers are not tight and
that, for 8″ diameter sewers, rates of 3500 to 5000 gpd per mile represent the
Table 2.6 Typical Wastewater Flows From Various Facilities
Facility Unit
Flow gallons/unit/
day Flow Liters/unit/day
Range Typical Range Typical
Airport Passenger 2-4 3 8-15 11
Apartment/
House
Person 40-80 50 150-300 190
Automobile
service station
Vehicle
served
8-15 12 30-57 45
Employee 9-15 13 34-57 49
Bar Customer 1-5 3 4-19 11
Employee 10-16 13 38-61 49
Boarding
house
Person 25-60 40 95-230 150
Department
store
Toilet room 400-600 500 1500-230
0
1900
Employee 8-15 10 30-57 38
Hotel Guest 40-60 50 150-230 190
Employee 8-13 10 30-49 38
Industrial
building
(sanitary
waste only)
Employee 7-16 13 26-61 49
Laundry (self
service)
Machine 450-650 550 1700-250
0
2100
Wash 45-55 50 170-210 190
Office Employee 7-16 13 26-61 49
Public lavatory User 3-6 5 11-23 19
Restaurant
(with toilet)
Meal 2-4 3 8-15 11
Conventional Customer 8-10 9 30-38 34
Short order Customer 3-8 6 11-30 23
Bar/Cocktail
lounge
Customer 2-4 3 8-15 11
Shopping
center
Employee 7-13 10 26-49 38
Parking
space
1-3 2 4-11 8
Theater Seat 2-4 3 8-15 11
Sources: U.S. Environmental Protection Agency. “Onsite Wastewater Treatment Systems
Manual,” EPA 625-R-00-008. Cincinnati, OH: U.S. EPA Publication Clearinghouse, 2002.
© 2006 by Taylor & Francis Group, LLC
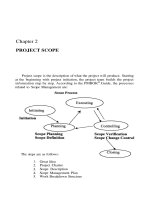
Chapter two: Decentralized wastewater solutions 53
shows overflowing sewer system near the pump station and you can see a
standby generator next to the pump station.
Though average daily flow may be appropriate for estimating the size
of a wastewater treatment system, consideration must be given to the fact
variability and patterns typical of a day’s residential flows. When sizing
wastewater treatment systems, it is always advisable to consider peak flows
as well as average daily flows. Even with single residential systems, these
peaks may have an effect on the treatment system. In addition to daily flow
variation, seasonal variations may also occur. Typically, wastewater treat-
ment processes are sized to treat the maximum daily flow rather than simply
average daily flow. Maximum daily flow is the maximum flow that occurs
over the course of a single day, perhaps 450 gpd for a typical 3-bedroom
home. Average daily flow is the average of flow that occurs during single
days over the course of some period of time, perhaps years. This may be
approximately 150 gpd. The onsite system can then be designed for all types
of flow conditions.
Philosophically (if not particularly statistically rigorous), designing
wastewater treatment system performance based on average daily flow
would imply that 50% of the time, the system is in compliance and 50% of
the time the system is out of compliance. For this reason, treatment systems
are typically designed to produce the required effluent quality when treating
the maximum daily flow. With cluster systems, the effect of instantaneous
peaks may be dampened because of the number of homes; however, even
Table 2.7 Waste discharge by individual on a dry weight basis
Constituent
lb/capita-day gram/capita-day
Minimum Maximum Minimum Maximum
BOD5 0.11 0.26 50 120
COD 0.30 0.65 110 295
TSS 0.13 0.33 60 150
NH3 as N 0.011 0.026 5 12
Organic N as
N
0.009 0.022 4 10
TKN as N 0.020 0.048 9 21.7
Organic P as P 0.002 0.004 0.9 1.8
Inorganic P as
P
0.004 0.006 1.8 2.7
Total P as P 0.006 0.010 2.7 4.5
Oil and
Grease
0.022 0.088 10 40
Source: Crites and Tchobanoglous, “Small and Decentralized Wastewater Management
Systems,” 1998.
Note: mass load (lb/day) = concentration (mg/l) x flow (gpd) x 8.34 x 10⁻⁶
mass load (gram/day) = concentration (gram/m3) x flow (m3/day)
that peaks occur during the course of the day. Figure 2.3 illustrates the
range in which most specifications fall. Photo 2.1 shows a sign where one
community is facing the reality of leaking conventional sewers. Photo 2.2
© 2006 by Taylor & Francis Group, LLC
54 Advanced onsite wastewater systems technologies
Photo 2.1 Infiltration and Inflow Project Sign
Photo 2.2 City sewer system facing problems due to I & I – Note the over flow of
raw wastewater from the manhole and the backup power generator in the back-
ground.
© 2006 by Taylor & Francis Group, LLC
Chapter two: Decentralized wastewater solutions 55
in that case, the maximum daily flow should be considered during design
of any wastewater system to compensate for the effect of increased load
during the days when large flows may occur. These considerations are sound
engineering principles applied to all wastewater systems regardless of
whether they are decentralized or traditional sewer systems. As discussed
in the following paragraph, these effects have an even greater impact when
a commercial system is considered. An easily understood example is a
school, in which dramatic peaks may be experienced during such periods
as recess, between classes, and during and after lunch breaks, when meal
preparation and dishwashing occur.
There are two concepts that need consideration while designing a waste-
water system — hydraulic loading rate and mass loading rate. When considering
the hydraulic loading rate, the volume of water flowing through the treat-
ment process is the design parameter under consideration. For the concept
of mass loading rate, the idea of the mass or weight of a particular contaminant
flowing through the system over some time is considered. Organic loading
rate, the number of pounds or kilograms of BOD per day, or solids loading
rate, the number of pounds or kilograms of TSS per day, are common mass
loading rates.
By combining wastewater characteristics determined by estimates from
tables or typical residential wastewater, or perhaps by sampling and analyz-
ing a particular wastewater stream, with the flow rate, the wastewater load
may be calculated. This calculation is the product of the flow rate and the
concentration as follows:
Load = Concentration × Flow x Conversion factor (2.3)
Typically, as shown in the tables provided in this text, concentration is given
in units of milligrams per liter (mg/L) and flow rate is given in units of
gallons per day (gpd). Conversion to consistent units is required to produce
Figure 2.3 Daily indoor water use patterns for single-family residences. Variability
and patterns typical of a day’s residential flows.
T - Toilet
L - Laundry
B - Bath / Shower
D - Dish Wash
W - Water Softener
O - Other
L/CAP/HR
GAL/CAP/HR
MN MN369 369
N
Time of Day
15
10
5
0
4
3
2
1
0
Source: University of Wisconsin, 1978.
OO
TT
L
L
B
B
D
D