Mechanical Properties of Engineered Materials 2008 Part 15 potx
Bạn đang xem bản rút gọn của tài liệu. Xem và tải ngay bản đầy đủ của tài liệu tại đây (973.71 KB, 55 trang )
14
FatigueofMaterials
14.1INTRODUCTION
Fatigueistheresponseofamaterialtocyclicloadingbytheinitiationand
propagationofcracks.Fatiguehasbeenestimatedtoaccountforupto80–
90%ofmechanicalfailuresinengineeringstructuresandcomponents
(Illstonetal.,1979).Itis,therefore,notsurprisingthataconsiderable
amountofresearchhasbeencarriedouttoinvestigatetheinitiationand
propagationofcracksbyfatigue.Asummaryofpriorworkonfatiguecan
befoundinacomprehensivetextbySuresh(1999).Thischapterwill,there-
fore,presentonlyageneraloverviewofthesubject.
Theearliestworkonfatiguewascarriedoutinthemiddleofthe19th
century,followingtheadventoftheindustrialrevolution.Albert(1838)
conductedaseriesoftestsonminingcables,whichwereobservedtofail
afterbeingsubjectedtoloadsthatwerebelowthedesignloads.However,
Wo
¨
hler(1858–1871)wasthefirsttocarryoutsystematicinvestigationsof
fatigue.Heshowedthatfatiguelifewasnotdeterminedbythemaximum
load,butbytheloadrange.WohlerproposedtheuseofSÀNcurvesof
stressamplitude,S
a
(Fig.14.1),orstressrange,ÁS(Fig.14.1),versusthe
numberofcyclestofailure,N
f
,fordesignagainstfatigue.Suchdataarestill
obtainedfrommachinesofthetypeshowninFig.14.2.Healsoidentifieda
Copyright © 2003 Marcel Dekker, Inc.
‘‘fatigue limit’’ below which smooth specimens appeared to have an infinite
fatigue life.
Rankine (1843) of mechanical engineering fame (the Rankine cycle)
noted the characteristic ‘‘brittle’’ appearance of material broken under
repeated loading, and suggested that this type of failure was due to recrys-
FIGURE 14.1 Basic definitions of stress parameters that are used in the char-
acterization of fatigue cycles. (From Callister, 2000—reprinted with permis-
sion of John Wiley & Sons.)
Copyright © 2003 Marcel Dekker, Inc.
tallization.Thegeneralopinionsoondevelopedaroundthisconcept,andit
wasgenerallyacceptedthatbecausethesefailuresappearedtooccursud-
denlyinpartsthathadfunctionedsatisfactorilyoveraperiodoftime,the
materialsimplybecame‘‘tired’’ofcarryingrepeatedloads,andsudden
fractureoccurredduetorecrystallization.Hence,thewordfatiguewas
coined(fromthelatinword‘‘fatigare’’whichmeanstotire)todescribe
suchfailures.
ThismisunderstandingofthenatureoffatiguepersisteduntilEwing
andHumfrey(1903)identifiedthestagesoffatiguecrackinitiationand
propagationbytheformationofslipbands.Thesethickentonucleate
microcracksthatcanpropagateunderfatigueloading.However,Ewing
andHumfreydidnothavethemodelingframeworkwithinwhichthey
couldanalyzefatiguecrackinitiationandpropagation.Also,asaresult
ofanumberofwell-publicizedfailuresduetobrittlefracture(Smith,
1984),thesignificanceofthepre-existenceofcracksinmostengineering
structuresbecamewidelyrecognized.Thisprovidedtheimpetusforfurther
researchintothecausesoffatiguecrackgrowth.
AsdiscussedearlierinChapter11,Irwin(1957)proposedtheuseof
the stress intensity factor (SIF) as a parameter for characterizing the stress
and strain distributions at the crack tip. The SIF was obtained using a
representation of the crack-tip stresses, proposed initially by Westergaard
(1939) for stresses in the vicinity of the crack tip. It was developed for brittle
fracture applications, and was motivated by the growing demands for devel-
opments in aerospace, pressure vessels, welded structures, and in particular
from the U.S. Space Program. This led to the rapid development of fracture
mechanics, which has since been applied to fatigue crack growth problems.
Paris et al. (1961) were the first to recognize the correlation between
fatigue crack growth rate, da/dN, and the stress intensity range, ÁK.
Although the work of Paris et al. (1961) was rejected initially by many of
FIGURE 14.2 Schematic of rotating bending test machine. (From Keyser
1973—reprinted with permission of Prentice-Hall, Inc.)
Copyright © 2003 Marcel Dekker, Inc.
the leading researchers of the period, it was soon widely accepted by a global
audience of scientists and engineers. Paris and Erdogan (1963) later showed
that da/dN can be related to ÁK through a simple power law expression.
This relationship is the most widely used expression for the modeling of
fatigue crack growth.
In general, however, the relationshp between da/dN and ÁK is also
affected by stress ratio, R ¼ K
min
=K
max
. The effects of stress ratio are parti-
cularly apparent in the so-called near-threshold regime, and also at high SIF
ranges. The differences in the near-threshold regime have been attributed
largely to crack closure (Suresh and Ritchie, 1984a, 1984b), which was first
discovered by Elber (1970) as a graduate student in Australia. The high
crack growth rates at high ÁK values have also been shown to be due to
the additional contributions from monotonic or ‘‘static’’ fracture modes
(Ritchie and Knott, 1973).
Given the success of the application of the SIF to the correlation of the
growth of essentially long cracks, it is not surprising that attempts have been
made to apply it to short cracks, where the scale of local plasticity often
violates the continuum assumptions of linear elastic fracture mechanics
(LEFM) that were made in the derivation of K by Irwin (1957). In most
cases, anomalous growth short cracks have been shown to occur below the
so-called long-crack threshold. The anomalous behavior of short cracks has
been reviewed extensively, e.g., by Miller (1987), and has been attributed
largely to the combined effects of microstructure and microtexture localized
plasticity (Ritchie and Lankford, 1986). Various parameters have been pro-
posed to characterize the stress–strain fields associated with short cracks.
These include the fatigue limit, Coffin–Manson type expressions for low
cycle fatigue (Coffin, 1954; Manson, 1954), and elastic–plastic fracture
mechanics criteria such as ÁJ and the crack opening displacement
(Ritchie and Lankford, 1986).
Considerable progress has also been made in the understanding of
fatigue crack initiation and propagation mechanisms. Although Ewing
and Humfrey observed the separate stages of crack initiation by slip-band
formation and crack propagation as early as in 1903, it was not until about
50 years later that Zappfe and Worden (1951) reported fractographs of
striations associated with fatigue crack propagation. However, they did
not recognize the one-to-one correspondence of striations with the number
of cycles. This was first reported by Forsyth (1961), a year before Laird and
Smith (1962) proposed the most widely accepted model of crack propaga-
tion. Since then, a great deal of research has been carried out to investigate
various aspects of fatigue. A summary of the results obtained from well-
established prior research on the fatigue of materials is presented in this
chapter.
Copyright © 2003 Marcel Dekker, Inc.
14.2MICROMECHANISMSOFFATIGUECRACK
INITIATION
Microcrackstendtoinitiateinregionsofhighstressconcentrationsuchas
thosearoundnotchesandinclusions.Theymayalsoinitiateinthecentral
regionsofgrains,orinthegrainboundaries,evenwhennomacroscopic
stressraisersarepresent.Ingeneral,however,microcracksinitiateasaresult
ofslipprocesses(Wood,1958)duetostressorplasticstraincycling.
Dislocationseitheremergeatthesurfaceorpileupagainstobstaclessuch
asgrainboundaries,inclusions,andoxidefilms,toformslipbands,which
werefirstobservedbyEwingandHumfrey(1903).Thompsonetal.(1956)
latershowedthatiftheseslipbandsareremovedbyelectropolishing,they
willreappearwhenfatiguingisrecommenced,andsotheyreferredtothem
aspersistentslipbands(PSBs).
Theresistancetotheinitiationofslipatthecentralportiondecreases
withincreasinggrainsize,followingtheHall–Petchrelation(Hall,1951;
Petch,1953).Theresistanceofthegrainboundaryregionscanalsobe
weakenedinsoftprecipitatefreezones(PFZs)(MulvihillandBeevers,
1986)attheregionsofintersectionofgrainboundaries,e.g.,triplepoints
(Miller,1987),byembrittlementduetograinboundarysegregation
(Lewandowskietal.,1987),andalsobystresscorrosioneffects(Cottis,
1986).Hence,crackingcanoccurwithingrainsoratgrainboundaries.
Theinitiationofmicrocracksmayalsobeinfluencedbyenvironment.
LairdandSmith(1963)showedthatinitiationoffatiguecrackswasslower
invacuumthaninair,andtheyattributedthislargelytotheeffectsofthe
irreversibilityofslipinair.
Fourmainstagesofcrackinitiationhavebeenidentified.They
involve:
1.Localizedstrainhardeningorsofteningduetotheaccumulation
ofslipstepsatthesurface.Thisoccursatsufficientlyhighalter-
natingplanestrainamplitudes.AslipstepofoneBurgersvector
iscreatedwhenadislocationemergesatthesurface.Sincedis-
locationsemergeduringbothhalvesofeachfatiguecycle,slip
stepscanaccumulateinalocalregion,andthisleadstosevere
rougheningofthesurface.
2.Theformationofintrusionsandextrusions(Fig.14.3).Cottrell
andHull(1957)havepostulatedthatthesecanbeformedwhen
sequentialslipoccursontwointersectingslipplanes,asillu-
stratedinFig.14.4.Slipoccursinthefirstslipsystemandthen
in the second during the first half of the cycle, to give the inden-
tation shown in Fig. 14.4(c). The slip systems may operate con-
Copyright © 2003 Marcel Dekker, Inc.
secutivelyorsimultaneouslyduringthereversecycletogiverise
topairsofintrusionsandextrusions,asshowninFigs14.4(d)
and14.4(e).Itisalsopossiblethatintrusionsandextrusionsmay
formasaresultofadislocationavalanchealongparallelneigh-
boringslipplanescontainingdislocationpile-upsofopposite
signs,aspostulatedbyFineandRitchie(1979).Thisisillustrated
inFig.14.5.Althoughitisunlikelythatintrusionsandextrusions
form exactly by either of these mechanisms, they do illustrate the
kind of slip processes that must be operative.
3. The formation of microcracks. This is often defined by the resol-
ving power of the microscope or the resolution of the nondes-
tructive inspection tool that is used. It is still not clear how
intrusions and extrusions evolve into microcracks. These cracks
often propagate initially along crystallographic planes of maxi-
mum shear stress by Mode II (Forsyth Stage II) shear mechan-
isms (Forsyth, 1961). Since the plasticity associated with the
crack tips of these microcracks is often less than the controlling
microstructural unit size, microstructural barriers, such as grain
boundaries and dispersed precipitates may cause discontinuities
in the crack growth.
4. The formation of macrocracks (usually larger than several grain
sizes) as a result of microcrack coalescence or crack growth to a
particular crack size where the crack begins to propagate by
FIGURE 14.3 Formation of surface cracks by slip. Static slip forms unidirec-
tional step: (a) optical microscope; (b) electron microscope. Fatigue slip by to-
and-fro movements in slip band may form notch (c) or peak (d). (From Wood,
1958—reprinted with permission of Taylor & Francis Ltd.)
Copyright © 2003 Marcel Dekker, Inc.
Mode I (Forsyth Stage II) mechanisms (Forsyth, 1961), with the
direction of crack propagation being perpendicular to the direc-
tion of the principal axis. There is no universally accepted defini-
tion of the transition from microcrack to macrocrack behavior,
although a fatigue macrocrack is usually taken to be one that is
sufficiently long to be characterized by LEFM.
14.3 MICROMECHANISMS OF FATIGUE CRACK
PROPAGATION
Various models of fatigue crack propagation have been proposed (Forsyth
and Ryder, 1961; Laird and Smith, 1962; Tomkins, 1968; Neumann, 1969,
1974; Pelloux, 1969, 1970; Tomkins and Biggs, 1969; Kuo and Liu, 1976).
However, none of these models has been universally accepted. It is also
unlikely that any single model of fatigue crack growth can fully explain
the range of crack extension mechanisms that are possible in different mate-
rials over the wide range of stress levels that are encountered in practice.
Nevertheless, the above models to provide useful insights into the kinds of
processes that can occur at the crack tips during crack propagation by
FIGURE 14.4 Cottrell–Hull model for the formation of intrusions and extru-
sions. (From Cottrell and Hull, 1957—reprinted with permission from the
Royal Society.)
Copyright © 2003 Marcel Dekker, Inc.
fatigue.Manyofthemarebasedonthealternatingshearrupturemechan-
ismwhichwasfirstproposedbyOrowan(1949),andmostofthemassume
partialirreversibilityofslipduetothetanglingofdislocationsandthe
chemisorptionofenvironmentalspeciesonfreshlyexposedsurfacesatthe
cracktip.
OneoftheearliestmodelswasproposedbyForsythandRyder(1961).
Itwasbasedonobservationsoffatiguecrackgrowthinaluminumalloys.
Theysuggestedthatfatiguecrackextensionoccursasaresultofburstsof
brittleandductilefracture(Fig.14.6)andthattheproportionofbrittleand
ductilefractureinasituationdependsontheductilityofthematerial.They
alsoproposedthatcrackgrowthcouldoccurinsomecasesbyvoidlinkage.
Thesevoidsareformedduringtheforwardcyclearoundparticlesthatfrac-
tureduringthepreviousreversecycle.Crackingthenoccursbythenecking
downofinterveningmaterialuntilthevoidlinksupwiththecrack,as
showninFigs.14.7.
FIGURE14.5Paireddislocationpile-upsagainstobstacleonmetalsurface
grow with cyclic straining until they reach a critical size at which an avalanche
occurs to form intrusions and extrusions. (From Fine and Ritchie, 1979—
reprinted with permission of ASM International.)
FIGURE 14.6 Bursts of brittle fracture (A) and ductile fracture (B) along stria-
tion profile. (From Forsyth and Ryder, 1961—reprinted with permission from
Cranfield College of Engineers.)
Copyright © 2003 Marcel Dekker, Inc.
Laird and Smith (1962) and Laird (1967) proposed an alternative
model based on the repetitive blunting and sharpening of the crack tip
due to plastic flow. In this model, localized slip occurs on planes of max-
imum shear oriented at $ 708 to the crack tip (Irwin, 1957; Williams, 1957)
on the application of a tensile load. As the crack opens during the forward
cycle, the crack tip opens up, Figs 14.8(a) and 14.8(b). Further straining
results in the formation of ears [Fig. 14.8(c)], which they observed clearly at
the peak tensile strain, and the broadening of the slip bands, Fig. 14.8(c).
The crack tip is also blunted progressively [Figs 14.8(b) and 14.8(c)] as a
FIGURE 14.7 Forsyth and Ryder model of crack extrusion by void linkage.
(From Forsyth and Ryder, 1961—reprinted with permission of Metallurgica.)
FIGURE 14.8 Schematic representation of fatigue crack advance by Laird and
Smith’s plastic blunting model. (From Laird and Smith, 1962—reprinted with
permission of Taylor and Francis Ltd.
Copyright © 2003 Marcel Dekker, Inc.
resultofplasticflow,whichisreversedonunloading,Fig.14.8(d).Thecrack
facesarebroughttogetherasthecrackcloses,buttheadsorptionofparticles
intheenvironmentatthecracktipontothefreshlyexposedsurfacespre-
ventscompleterewelding,andhenceperfectreversibilityofslip.Also,the
newlycreatedsurfacesbuckleasthecrackextendsbyafractureofthecrack
openingdisplacement,duringthereversehalfofthecycle,Figs14.8(e)and
14.8(f).Thecorrespondingcrack-tipgeometriesobtainedoncompressing
thespecimenduringthereversecycleareshowninFigs14.8(g–i).
TomkinsandBiggs(1969)andTomkins(1968)haveproposedamodel
thatissimilartoLairdandSmith’splasticbuntingmodel.Theysuggestthat
newcracksurfacesareformedbyplasticdecohesiononavailableshear
planes,atthelimitoftensilestraining.ThismodelalsoappliestoStageI
growthwheretheyhypothesizethatslipwillonlyoccurononeofthetwo
availableslipplanes.CrackextensionbythismodelisillustratedinFig.14.9
forStageIIfatiguepropagation.
Pelloux(1969,1970)hasformulatedadifferentmodelbasedonalter-
natingshear.Thebehavorofthecracktipissimulatedusingfullyplastic
specimenscontainingsharpnotches(Fig.14.10)—thiscanbejustifiedwhen
theplasticzoneisseveraltimesthesizeofthestriationspacing.Pelloux’s
modelisillustratedinFig.14.11.Crackextensionoccursonintersectingslip
planes as a result of alternating slip, which takes place sequentially or
FIGURE 14.9 Plastic flow model of crack advance proposed by Tomkins and
Biggs (1969). (Reprinted with permission of Taylor & Francis Ltd.)
Copyright © 2003 Marcel Dekker, Inc.
simultaneously.Completereversibilityispreventedinactiveenvironments,
e.g.,laboratoryair,bytheformationofoxidelayersonthefreslyexposed
surfacesduringthereversecycle.Theslowercyclegrowthratesthatare
generallyobservedinvacuumcanalsobeexplainedusingPelloux’salter-
natingshearmodel,sincereversedslipwouldbeexpectedinavacuumdue
totheabsenceofoxidelayers.Pelloux(1969,1970)hasproposedamodel
forcrackgrowthinvacuumwhichisillustratedinFig.14.11i–m.
Similarmodelsbasedonalternatingsliphavebeenproposedby
Neumann(1969,1974)andKuoandLiu(1976).Neumann’scoarseslip
model(Fig.14.12)wasproposedforhighfatiguecrackpropagationrates
wheremorethanonepairofslipplanesareactivatedpercycle.However,
FIGURE14.10Pelloux’sfullyplasticspecimen.(Pelloux,1969,1970—rep-
rinted with permission of ASM International.)
FIGURE 14.11 Crack extension by Pelloux’s alternating shear model for
laboratory air and vacuum. (From Pelloux, 1970—reprinted with permission
of ASM International.)
Copyright © 2003 Marcel Dekker, Inc.
althoughitrequirescrackextensiontooccurasaresultofirreversibilityof
slip,itdoesnotincludecrackbluntingandsharpeningstages.The‘‘unzip-
ping’’modelbyKuoandLiu(1976)isasimplevariantofPelloux’salter-
natingslipmodel,withtheaddedrestrictionthatonlyshearatthecracktip
willcontributetocrackgrowth.Theydefineasinglepointwithanupper
andlowerpartA
þ
andA
À
[Figs.14.13(a–d)]andarguethatcrackextension
willonlyoccurforasharpcrackwhenthesepointsarephysicallyseparated.
Theyalsosuggestthat,althoughplasticdeformationmayoccuratthecrack
tip,itwillnotcontributetocrackextension.Crackingbythemodelisonly
allowedbyunzippingalongsliplinefields,asshownschematicallyinFig.
14.13(e–j).
14.4CONVENTIONALAPPROACHTOFATIGUE
14.4.1StressAmplitudeorStressRangeApproach
SincetheoriginalworkbyWo
¨
hler(1958–1871),theconventional
approachtofatiguehasreliedontheuseofSÀNcurves.Thesearecurves
usuallyderivedfromtestsonsmoothspecimensbyapplyingconstant
amplitudeloadrangesintension–compressiontestswithzeromean
load,orinrotating–bendingtests,e.g.,BS3518(1963)Theyshowthe
FIGURE14.12Neumann’scoarseslipmodelofcrackadvance.(From
Neumann, 1974—reprinted with permission of AGARD.)
Copyright © 2003 Marcel Dekker, Inc.
dependenceofastressparameter(usuallythestressamplitude,S
a
or
a
,
orthestressrange,ÁSorÁ,notthenumberofcyclesrequiredtocause
failures,N
f
.
Strainagingmaterials,suchasmildsteelshowasharp‘‘fatiguelimit’’
belowwhichnofatiguetakesplace,andthespecimensappeartolastindefi-
nitely.Nonagingmaterialsdonotshowasharpfatiguelimit,anditis
conventionaltospecifyan‘‘endurancelimit’’fordesignpurposes,which
isusuallydefinedasthealternatingstressrequiredtocausefailurein10
8
cycles.TypicalSÀNcurvesarepresentedinFig.14.14.Itisimportantto
notethat,althoughthefatiguelimitsarelessthantheyieldstressinmild
steels(typicallyhalftheyieldstress),theyaregenerallygreaterthantheyield
stressandlessthantheultimatetensilestrength(UTS).Inmostcases,the
fatiguelimitsofagingsteelsaretypically$(UTS)/2insteels.
FIGURE14.13KuoandLiu’s‘‘unzipping’’modelofcrackgrowth.(FromKuo
and Liu, 1976—reprinted with permission of Elsevier Science.)
Copyright © 2003 Marcel Dekker, Inc.
AgreatdealofworkhasbeencarriedoutontheuseofSÀNcurves,
andaconsiderableamountofusefuldatahasbeenaccumulatedonthe
effectsofmeanstress,environment,notches,andotherfactors.Suchdata
havebeenused,andarestillwidelyused,intheestimationofcomponent
livesinengineeringstructures.However,theSÀNcurveisempiricalin
nature,anditdoesnotprovideanyfundamentalunderstandingofthe
underlyingfatigueprocessesinstructuresthatmaycontainpre-existing
flaws.
14.4.2Strain-rangeApproach
Fatiguebehaviorinsmoothspecimenssubjectedtolow-cyclefatigueis
dependentontheplasticstrainrange(Coffin1954;Manson,1954).The
amountofplasticstrainimposedpercyclecanbefoundfromthehysteresis
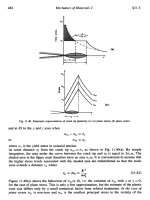
loopintheplotofstressversusstrainoveronecycle,asshowninFig.14.15.
Theeffectofplasticrange,Á"
p
,onthenumberofcyclestofailure,N
f
,is
expressedbytheCoffin–Mansonrelationship:
Á"
p
ÁN
1
f
¼C
1
ð14:1Þ
where
1
ð%0:5ÞandC
1
(%1Þarematerialconstants.Thisrelationshpwas
obtainedempirically,andhasbeenshowntoholdfordifferentmaterials
(Fig.14.16),underconditionsoflow-cyclefatigue.However,theBasquin
FIGURE14.14SÀNfatiguecurve.CurvesoftypeAaretypicalofmildsteeland
alloys which strainage, and curves of type B are typical of nonaging alloys.
(From Knott, 1973—reprinted with permission from Butterworth-Heinemann.)
Copyright © 2003 Marcel Dekker, Inc.
FIGURE 14.15 Hysterisis loop of one fatigue cycle.
FIGURE 14.16 Coffin–Manson relationship:
______
C/Mn steel; - - - - - - Ni/Cr/Mo
alloy steel; - - - Á - - - Al–Cu alloy, - - - - x - - - - Al–Mg alloy. (From Knott, 1973—
reprinted with permission from Butterworth-Heinemann.)
Copyright © 2003 Marcel Dekker, Inc.
law(Basquin,1910)isfoundtobemoresuitableforhigh-cyclefatigue.This
relatestheelasticstrainrange,Á"
e
(seeFig.14.15),tothenumberofcycles
to failure, N
f
, by the following expression:
Á"
e
Á N
2
f
¼ C
2
ð14:2Þ
where
2
and C
2
are material constants.
It is also possible to obtain elastic and plastic strain range fatigue
limits (Lukas et al. 1974), which have been shown to correspond to that
fatigue limit obtained from stress-controlled tests (Kendall, 1986).
14.4.3 Effects of Mean Stress
Mean stress has been shown to have a marked effect on the endurance limit.
Once the yield stress has been exceeded locally, and alternating plastic strain
made possible, a mean tensile stress accelerates the fatigue fracture mechan-
isms. Therefore, since most SÀN curves are obtained from tests conducted at
zero mean stress, there is a need for an extra design criterion to account for
the combined effects of mean and alternating stresses. Gerber (1874) and
Goodman (1899) proposed relationships of the form (Figure 14.17):
Æ ¼Æ
0
1 À
m
t
n
ð14:3Þ
where is the fatigue limit at a mean stress of
m
,
0
is the fatigue limit for
m
¼ 0,
t
is the tensile strength of the material, and the exponent n ¼ 1in
the Goodman expression, and n ¼ 2 in Gerber’s version of Eq. (14.3). The
resulting Goodman line and Gerber parabola are shown in Figs 14.17(a)
and 14.17(b), respectively.
FIGURE 14.17 (a) Goodman line; (b) Gerber parabola.
Copyright © 2003 Marcel Dekker, Inc.
14.4.4 Fatigue Behavior in Smooth Specimens
The fatigue behavior in smooth specimens is predominantly initiation con-
trolled (Schijve, 1979). High cyclic stresses (> yield stress) are needed to
cause alternating plastic deformation and hardening in the surface grains.
These deformations are not fully reversible and they result in the formation
of persistent slip bands (Ewing and Humfrey, 1903; Thompson et al., 1956),
which develop into intrusions, and extrusions (Cottrell and Hull, 1957) that
are usually associated with the nucleation of microcracks. The microcracks
usually join up to form a single crack which propagates by Stage I crack
growth (Forsyth, 1961) along an active slip band that is inclined at $ 458 to
the direction of the principal stress (Ham, 1966; Laird, 1967). Crack growth
then continues by Stage II propagation (Forsyth, 1961), e.g., when the crack
reaches a critical crack-tip opening (Frost et al., 1974), until the crack
becomes sufficiently long for fast fracture or plastic collapse to take place.
The above processes may be divided into initiation and propagation
stages, and the SÀN curve can also be divided into initiation and propaga-
tion regions. The number of cycles for fatigue failure, N
f
, is then regarded as
the sum of the number of cycles for fatigue crack initiation, N
i
, and the
number of cycles for fatigue crack propagation, N
p
. The SÀN curves can,
therefore, be regarded as the sum of two curves (SÀN
i
and SÀN
p
), as shown
in Fig. 14.18. The extent to which either process contributes to the total
number of cycles to failure depends on the stress level and the material. In
ductile metals/alloys at low stress levels, N
f
is governed by N
i
, whereas at
high stress levels, N
f
is mainly determined by N
p
.
FIGURE 14.18 Initiation and propagation components of total fatigue life.
Copyright © 2003 Marcel Dekker, Inc.
14.4.5 Limitations of Conventional Approach to
Fatigue
The conventional approach to fatigue is based on the assumption that most
engineering structures are flawless at the beginning of service—hence, the
wide use of smooth specimens in conventional fatigue tests. This assumption
is valid in the design of most machine components, which are more or less
flawless. However, it is now universally accepted that most structures con-
tain defects at the start of service. These defects must be accounted for in
fatigue testing and design.
The relative importance of fatigue crack propagation compared to
fatigue crack initiation has also been recognized for most practical cases.
Although the SÀN curves can accont for these two processes, they do not
distinguish clearly between them. The results obtained from the conven-
tional tests cannot, therefore, be used for prediction of the fatigue lives of
most engineering structures with pre-existing flaws. Fatigue crack growth
predictions in such structures require the use of fracture mechanics techni-
ques, which are discussed in Sections 14.6, 14.8, and 14.11
14.5 DIFFERENTIAL APPROACH TO FATIGUE
Various workers have shown that the crack growth rate, da/dN, is a func-
tion of the applied stress range, Á, and the crack length (Head, 1956; Frost
and Dugdale, 1958; McEvily and Illg, 1958; Liu, 1961). Head (1956) pro-
posed that the crack growth rate is given by
da
dN
¼
C
3
Á
3
a
3=2
ð
ys
À Þ
w
1=2
0
ð14:4Þ
where C
3
is a material constant, w
0
is the plastic zone size, and a is half the
crack length.
Similar expressions have also been obtained by Frost and Dugdale
(1958) and Liu (1961), which can be written as
da
dN
¼ C
4
Á
3
a
4
ð14:5Þ
where C
4
is a material constant,
3
¼ 2, and
4
¼ 1.
McEvily and Illg (1958) recognized the significance of the stress con-
centration at the crack tip, and proposed that the crack growth rate is a
function of the maximum stress at the crack tip,
max
, i.e.,
Copyright © 2003 Marcel Dekker, Inc.
da
dN
¼ f ðK
t
net
Þð14:6Þ
where K
t
is the notch concentration factor, and
net
is the net section stress.
However, although the success of the application of the differential
method depends on the correlation of actual fatigue crack growth-rate data
with predictions made using the above equations, the stress parameters used
have not been shown to represent the local crack-tip driving force for crack
extension. This is probably why their use has been superseded by the frac-
ture mechanics parameters that are presented in the next section.
14.6 FATIGUE CRACK GROWTH IN DUCTILE SOLIDS
Fatigue crack growth in ductile solids can be categorized into the three
regimes, as shown in Fig. 14.19. The first region (regime A) occurs at low
ÁK and is called the near-threshold regime. This region corresponds to a
FIGURE 14.19 Schematic variation of da=dN with ÁK in steels showing pri-
mary mechanisms in the three distinct regimes of fatigue crack propagation.
(From Ritchie, 1979—reprinted with permission of Academic Press.)
Copyright © 2003 Marcel Dekker, Inc.
cleavage-likecrackgrowthmechanism,wherethecrackfollowspreferred
crystallographicdirections.Belowthefatiguethreshold,ÁK
0
,nocrackpro-
pagationcanbedetectedwithexistinginstruments,and,inpractice,the
fatiguethresholdisoftendefinedastheÁKthatcorrespondstoacrack
growthrateof10
À8
mm/cycle(approximatelyonelatticespacingpercycle).
Themiddleregime(regimeB)isalinearregionoftheplotwhichfollowsthe
Parisequation:
da
dN
¼CðÁKÞ
m
ð14:7Þ
whereda=dNisthefatiguecrackgrowthrate,Cisamaterialconstantthatis
oftencalledthePariscoefficient,ÁKisthestressintensityfactorrange,and
mistheParisexponent.Sincetheabovepowerlawexpressionapplies
largelytoregimeB,themid-ÁKregimeisoftencalledtheParisregime
(Parisandcoworkers,1961,1963).Crackpropagationusuallyproceedsby
amechanismofalternatingslipandcrack-tipbluntingthatoftenresultsin
striationformationinthisregime.
Environmenthasalsobeenshowntohaveimportanteffectsonthe
fatiguecrackgrowthandtheformationofstriations.Itwasfirstshownby
Meyn(1968)thatstriationformationmaybecompleteysuppressedinvacuo
inaluminumalloyswhichformwell-definedstriationsinmoistair.Pelloux
(1969)suggestedthatthealternatingshearprocessisreversibleunlessan
oxidefilmisformedontheslipstepscreatedatthecracktip.Thisoxide
layerimpedessliponloadreversal.Aschematicillustrationoftheopening
andclosingofacrackduringtwofullyreversedfatiguecyclinginairandin
vacuoisshowninFig.14.11.
Thethirdregime(regimeC)iscalledthehighÁKregime.Anincrease
incrackgrowthrateisusuallyobservedinthisregime,andthematerialis
generallyclosetofractureinthisregime(RitchieandKnott,1973;Merceret
al.,1991a,b;Shademan,2000).Acceleratedcrackgrowthoccursbyacom-
binationoffatigueandstaticfractureprocessesinthisregime.Finally,fast
fractureoccurswhenK
max
isapproximatelyequaltothefracturetoughness,
K
Ic
,ofthematerial.
Severalstudieshavebeencarriedouttoinvestigatethefactorsthat
controlthefatiguecrackgrowthbehaviorinductilesolids.Theinterested
readerisreferredtothetextbySuresh(1999).Themajorfactorsthataffect
fatiguecrackgrowthindifferentregimes(A,B,andC)havealsobeen
identifiedinareviewbyRitchie(1979).
Inthenear-thresholdregime,fatiguecrackgrowthisstronglyaffected
bymicrostructure,meanstress,andenvironment.However,inregimeB,
thesevariableshaveasmallereffectcompared(Figs14.19and14.20)to
those in regime A. In contrast, microstructure, means stress, and specimen
Copyright © 2003 Marcel Dekker, Inc.
thickness have a strong effect on fatigue crack growth in regime C, where
static fracture modes (cleavage), and interangular and ductile dimpled frac-
ture modes are observed as K
max
approaches the material fracture toughness
K
Ic
. In fact, the increase in the apparent slope in the da=dNÀÁK plot (in
regime C) has been shown to be inversely related to the fracture toughness,
K
Ic
(Ritchie and Knott, 1973). This is shown in Fig. 14.21.
FIGURE 14.20 Effects of stress ratio on fatigue crack growth rate in mill-
annealed Ti–6Al–4V. (Dubey et al., 1997—reprinted with permission of
Elsevier Science.)
FIGURE 14.21 Variation of apparent slope, m, with monotonic fracture tough-
ness. (From Ritchie and Knott, 1973—reprinted with permission of Elsevier
Science.)
Copyright © 2003 Marcel Dekker, Inc.
Themechanismsoffatiguecrackgrowthinregimes,A,B,andCcan
besummarizedonfatiguemechanismmapsthatshowthedomainsofÁK
andK
max
inwhichagivenmechanismoperates(Merceretal.,199a,b;
Shademan,2000).SelectedexamplesoffatiguemapsarepresentedinFig.
14.22forsinglecrystalandpolycrystallineInconel718.Theseshowplotsof
K
max
(ordinate)againstÁK(abscissa).Constant-stressratiodomainscor-
respondtostraightlinesintheseplots.Hence,thetransitionsinfracture
mechanismatagivenstressratiooccuralongtheselines,asÁKincreases
fromregimesA,B,andC(Figs14.19and14.22).
Itisparticularlyimportanttonotethatthetransitionsinfracture
modescorresponddirectlytothedifferentregimesofcrackgrowth.The
changesintheslopesoftheda=dNÀÁKplotsare,therefore,associated
withchangesintheunderyingfatiguecrackgrowthmechanisms.
Furthermore,thetransitionsinthefatiguemechanismsoccurgradually,
alonglinesthatradiateoutwards.Thispointcorrespondstotheupper
limitontheK
max
axis,whichalsodefinestheupperlimitforthetriangle
inwhichallfracturemodetransitionscanbedescribedforpositive
stressratios.Thepointcorrespondsclearlytothefracturetoughness,
K
Ic
orK
c
.
14.7FATIGUEOFPOLYMERS
Asignificantamountofworkhasbeendoneonthefatiguebehaviorof
plastics.Mostoftheimportantresultshavebeensummarizedinmonograph
byHertzbergandManson(1980),andtheinterestedreaderisreferredto
theirbookforfurtherdetails.Althoughthefatiguebehaviorofpolymers
exhibitsseveralcharacteristicsthataresimilartothoseinmetals,i.e.,stable
crackgrowthandSÀNtypebehavior,thereareseveralprofounddifferences
betweenthefatigueprocessesinpolymers.Theseincludehysteriticheating
andmoleculardeformationprocessesthatcangiverisetotheformationof
shearbandsandcrazesinpolymericmaterialsdeformedundercyclicload-
ing.Also,typicalParisexponentsinpolymersarebetween4and20.
FatiguecrackgrowthratedataarepresentedinFig.14.23fordifferent
polymeric materials. Note that the fatigue thresholds for polymers are gen-
erally very low. Furthermore, most polymers exhibit stable crack growth
over only limited ranges of ÁK compared to those in metals. Polymers also
exhibit significant sensitivity to frequency, with the crack growth rates being
much faster at lower frequency than at higher frequency. The frequency
sensitivity has been rationalized by considering the possible time-dependent
interactions between the material and the test environment (Hertzberg and
Manson, 1980).
Copyright © 2003 Marcel Dekker, Inc.
FIGURE 14.22 Fatigue fracture mechanism maps showing the transitions
between fatigue fracture modes as a function of ÁK and K
max
for (a) single
crystal IN 718 and (b) polycrystalline IN 718.
Copyright © 2003 Marcel Dekker, Inc.
Fatigue crack growth in polymers occurs by a range of mechanisms.
These include striation mechanisms that are somewhat analogous to those
observed in metals and their alloys. In such cases, a one-to-one correpson-
dence has been shown to exist between the total number of striations and the
number of fatigue cycles. However, polymers exhibit striated fatigue crack
growth in the high- Á K regime, while metals exhibit striated fatigue crack
growth in the mid-ÁK regime where the crack growth rates are slower.
Fatigue crack growth in polymers has also been shown to occur by crazing
and the formation of discontinuous shear bands. In the case of the latter, the
FIGURE 14.23 Fatigue crack growth rate data for selected polymers. (From
Hertzberg and Manson, 1980—reprinted with permission from Academic
Press.)
Copyright © 2003 Marcel Dekker, Inc.
discontinuous shear bands are formed once every hundred of cycles. There
is, therefore, not a one-to-one correspondence between the number of shear
bands and the number of fatigue cycles. Further details on the mechanisms
of crack growth in polymers can be found in texts by Hertzberg and Manson
(1980) and Suresh (1999).
14.8 FATIGUE OF BRITTLE SOLIDS
14.8.1 Initiation of Cracks
For highly brittle solids with strong covalent or ionic bonding, and very
little mobility of point defects and dislocations, defects such as pores, inclu-
sions, or gas-bubble entrapments serve as potential sites for the nucleation
of a dominant crack (Suresh, 1999). In most brittle solids, residual stress
generated at grain boundary facets and interfaces gives rise to microcracking
during cooling from the processing temperature. This occurs as a result of
thermal contraction mismatch between adjacent grains or phases. These
microcracks may nuc leate as major cracks unde r extreme conditions.
However, in general, a range of microcrack sizes will be nucleated, and
the larger cracks will tend to dominate the behavior of the solid.
For semibrittle solid like MgO (Majumdar et al., 1987), microcracks
may also form as a result of dislocation/microstructure interactions. In such
solids, slip may initiate when the resolved shear stress exceeds a certain
critical value on favorably oriented low-index planes. Dislocation sources
(of the Frank–Read type) are activated, and subsequently, the glide of the
dislocation loops, moving outwardly from the souces, is impeded by obsta-
cles such as grain boundaries and/or inclusions. This results ultimately in
dislocation pile-ups and microcrack nucleation, when critical conditions are
reached (Cotterell, 1958).
14.8.2 Growth of Cracks
For most brittle solids, fatigue crack growth is very difficult to monitor,
especially under tensile loading at room temperature. The Paris exponents,
m, for brittle materials are generally very high, i.e., $ 20À200 (Dauskardt et
al., 1990; Ritchie et al., 2000). However, stable crack growth, attributable
solely to cyclic variations in applied loads, can occur at room temperature
(even in the absence of an embrittling environment) in single-phase cera-
mics, transformation-toughened ceramics, and ceramic composites. This
was demonstrated for cyclic compression loading of notched plates by
Ewart and Suresh (1987).
Copyright © 2003 Marcel Dekker, Inc.