Mechanical Engineer''''s Reference Book 2011 Part 13 pot
Bạn đang xem bản rút gọn của tài liệu. Xem và tải ngay bản đầy đủ của tài liệu tại đây (2.57 MB, 70 trang )
Dynamics
of
floating
systems
14/31
conditions. Now, the solution for scattered wave potential due
to the stationary floating body, subjected to incident waves
of
potential,
~$2,
is identical to that described in Section 14.5 for
fixed structures. A set of linear simultaneous equations are
obtained by equating the flow due to the local source plus the
additional flow due to all other sources to the negative
of
the
flow due to the undisturbed wave for each facet on the body
surface. Solutions of these equations yields the unknown
source strengths and, therefore, the velocity potential,
bs,
which is used to derive pressures and wave forces by integra-
tion over the body surface. Thus the wave force vector,
F,
of
equation (14.46) may be obtained for an incident wave
of
specified frequency and direction.
The velocity potentials,
+f>
are obtained in a way similar to
that above except for the use of a different boundary condition
which reflects the fact that
bf
arises from body motions in
otherwise still water. Thus, at all facets, the source strengths,
+fi>
are such that the flow due to the local source plus the flow
due to all other sources equals the velocity component of the
body along the facet normal. This velocity component will
depend on the mode of motion (surge, sway, heave and
SO
on)
in which the body is moving. All of this can be represented by
equating the normal velocity of the fluid and
of
the jth facet
for the vessel moving in its kth mode of motion. This yields the
equation
(14.53)
where
v,k
is the normal velocity of the jth facet with the vessel
moving in its kth mode of motion. Furthermore,
nj
is the
normal to the jth facet,
a+,lanj
is the normal fluid velocity at
the jth facet due to a unit source at the itb facet, and
utk
are
the unknown source strengths required in the kth mode.
Application of equation (14.53) for all facets produces a
system
of
complex equations to be solved for the source
strengths. Once these are known, the pressures at the facets
are evaluated and their effects integrated over the vessel
surface to yield forces in each mode of motion to unit motion
in the kth mode.
These forces may be written as a complex square matrix,
G(w)
which can be decomposed into its real and imaginary
parts through the equation
G(w)
=
w2
MA
(w)
-
i~
BJw)
(14.54)
to yield frequency-dependent added mass and damping ma-
trices
MA(w)
and
Bp(w)
which are required for equation
(14.46).
The inclusion of physical mass, hydrostatic and mooring
stiffness matrices,
M,
K
and
K,
completes derivation of all
of
the coefficient matrices
of
equation (14.46). The hydrodyna-
mic coefficient matrices are, however, frequency dependent
and require carrying out a diffraction analysis at all frequen-
cies at which motions are required. Equation (14.46) is linear
and can readily be solved to yield the displacement vector
X.
The exciting force vector
F(w)
and the coefficient matrices
MA(w)
and
BJw)
can also be derived using finite-element
methods in a way analogous to that for the boundary-integral
approach described above.
There is one further point
of
interest regarding the relation-
ship between the scattered and forced wave potentials
(rnS
and
rnf)
for a floating vessel problem. The use of equations called
Haskind relations (see Newman3') enables the scattered wave
potential,
rnS,
to be expressed in terms
of
the incident and
forced wave potentials,
I$,,
and
+f.
Thus, once
6f
is calculated,
need not be computed by diffraction analysis but can
?stead be derived using the Haskind relations.
$
(Tik
=
Vjk
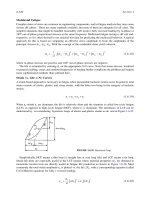
linearity around resonance with the heave response amplitude
per unit wave amplitude reducing from 4.88 mim at
1
m wave
amplitude to
1.26
mim ai
6
m wave amplitude. The vessel
motion response away from resonance
is
not significantly
affected, although there is some increase in response around
16-19
s
due to the corresponding increase in wave force
amplitude at these periods. The large change in the unit heave
response at and around resonance is to be expected, since the
damping force in a vibratory system is dominant at resonance.
14.6.6
Diffraction
theory
Calculations of wave-induced motions of a large non-space
frame structure in gravity waves requires a solution of the
wave problem with no flow boundary conditions at the moving
body surface in addition to the free surface and sea-bed
boundary conditions. The solution can be split into two related
problems
-
the scattering wave problem defines wave forces
on a floating body when fixed in space and with waves incident
on it in an identical manner to the technique for computing
wave forces
on
a fixed body described in Section 14.4. The
radiation wave problem is concerned with defining forces on
the body (added mass and damping) due to its oscillation in
otherwise still water. These oscillations will induce wave
potentials such that the total wave potential in the fluid is the
sum
of
the incident,
+,,,>
scattered,
&,
and forced wave
potentials.
rnf2
so
that
4
=
$w
+
dh
+
rnf
(14.50)
and these
must
satisfy the boundary conditions at the body
surface given by
(14.51)
where
V,q
is
the velocity
of
the body surface in the direction
n
normal
to
the surface. This boundary condition can be applied
at the mean body surface since the theory is applied for small
motions.
+>
together with its three components. It must also
satisfy thle Laplace equation and the free surface and sea-bed
boundary conditions. Furthermore, and
$f
must satisfy the
radiation conditions.
Boundary conditions for the scattering and radiation wave
problem:j can be split
up
from equation (14.51) as
a@,,
J0s
1
-+-=o
aH
oln
and
d@f
dn
respectively, both being applied on the body surface. The
scattering problem
is
identical to the application of diffraction
theory on fixed structures as described in Section 14.4. The
radiation problem can also be solved by using either
boundary-integral or boundary-element techniques. For brev-
ity, only the solution using boundary-integral techniques is
describesd here.
As
in Section
14 4,
the analysis assumes
inviscid, irrotational flow and that wave amplitudes are small.
The unsteady flow around the floating vessel is calculated by
introducing oscillating sources
of
unknown velocity potential
on
the vessel's submerged surface that is discretized by a mesh
of facets with an oscillating source
on
the surface of each facet.
A
Green's function
is
used to represent the velocity poten-
tial of each source which, because of the form of the Green's
function. satisfies Laplace's equation, zero flow at the hori-
zontal sea bed, the free surface and radiation boundary
(14.52)
~
__
-
"in
14/32
Offshore
engineering
0.6
-
Figure 14.32
Facet discretization
of
a submerged ship
hull
for diffraction theory
-0.6
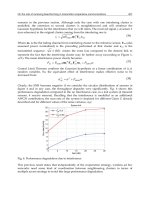
Typical results of a boundary integral diffraction analysis for
a ship-shaped hull are shown in Figure 14.33. The discretiza-
tion of the submerged hull geometry is shown in Figure 14.32
using 277 triangular facets
on
the ship half-hull. The vessel is
of
263.7
m
overall length, 40.8 m beam and 145 937
t
displacement with 14.80
m
draught floating in deep water.
Figure 14.33(a) presents the variation
of
added mass and
radiation damping coefficients with frequency for heave and
pitch motions. Note that the variation in added mass is
relatively small but the radiation damping shows large changes
with very small values at
some
wave periods. Wave-induced
heave force and pitching moments and the resultant motion
responses for head seas are presented
in
Figures 14.33(b) and
14.33(c).
14.7
Design considerations and certification
It is important to appreciate that the design procedures
for
jacket structures outlined in the previous three sections are
-
I
e
I
C
Y
I
E
P
x
I
U
m
>
I
0
5 10 15 20
Wave period
(5)
(a)
BO
48
36
24
12
0
Heave exciting force Pitch exciting
mom
amplitude
(MN/m)
amplitude
(GN
m/r
‘4
32
4
Wave period
(s)
(b)
Heave amplitude/
wave amplitude (m/m)
1
1.01
o.*i
It
4.0
3.2
2.4
1.6
0.8
0
I
Pitch amplitude/
wave amplitude
Wave period
(5)
(C)
Figure 14.33
Variations
of
heave and pitch added masses, wave-excitation forces and motion response with wave period for ship hull
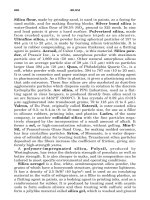
Design considerations and certification
14/33
I
Basic definition
of
configuration
and marine operations procedures
Naval architecture Marine operation
I
Procedures
Routes
Service fleet
Fittings, etc.
1
Bids, evaluations, contractors, selection
I
1
Fabrication documents
I
I
Technical assistance
at yard
Figure
14.34
Design procedure
for
jacket
structure
Technical assistance
at field
only a small part
of
the total design process.
In
order to
illustrate this point, Figure
14.34
presents a flow chart showing
the design procedures that need to be followed, from the
initial specification through
to
commencing operation of a
typical offshore structure. The jacket has to have sufficient
strength, as it is assembled during the fabrication stage and
loaded lout
of
the yard.
It
has also to meet the naval architec-
tural an,d structural requirements of tow-out, up-ending and
installation as well as surviving for a 20-40-year life. Some
of
the supplementary design tasks not covered ifi this chapter
include the response
of
the structure to earthquakes, the
provision of corrosion protection and in-service structural
monitoring. The design procedure for iarge jackets invariably
contains a model test phase for critical operations such as
up-ending during installation. The documentation of the
material, structural and welding details of the design during its
certification, fabrication and service life pose an engineering
management problem.
Certifying authorities play a key role
in
the design proced-
ure for an offshore structure. The major certifying authorities
in
the United Kingdom, Norway and the United States have
built up extensive codes
of
practice which reflect research
14/34
Offshore engineering
work, in-service experience and the results of failure investi-
gations over many years of operation (see Lloyd’s Register
of
Shi~ping,~’ Department
of
Energy,j‘ Det Norske Verita~,~~
and American Bureau of Shipping36). Certifying authorities
also provide
an
independent check
of
many of the calculations
and decisions that need to
be
made
during a typical design.
There tends
to
be
close technical collaboration between
research establishments, designers and the operators
of
off-
shore structures.
References
1. Department of Energy,
Offshore Installations, Guidance
on
design and construction,
Part
11,
Section 4.3, HMSO, London
(1986)
2. American Petroleum Institute,
Basic Petroleum Databook,
Volume
VI,
No. 3, September. API, 1220 L Street NW,
Washington, DC 20005, USA (1986)
3. Lee. G. C., ‘Recent advances in design and construction of
deep water platforms, Part l’,
Ocean Industry,
November,
71-80 (1980)
platforms: design and application’,
Engineering Structures,
3,
July, 140-152 (1980)
5.
Thornton,
D.,
‘A general review of future problems and their
solution‘,
Proceedings
of
the Second International Conference
on
Behaviour of Offshore Sfructures,
28-31 August, Paper 88,
BHRA Fluid Engineering, Craufield, Bedford, UK (1979)
6. Hamilton,
J.
and Perrett, G. R., ‘Deep water tension leg
platform designs’,
Proceedings of the Royal Institution of Naval
Architects International Svmuosium
on
Develooments in Deeoer
4.
Fumes,
0.
and Loset,
O.,
‘Shell structures in offshore
7.
8.
9.
IO.
11.
12.
13
14
15
16
17
Waters,
6-7 October, Paier‘no. 10 (1986)
Meteorological Office.
Meteorology for mariners,
3rd edition,
HMSO. London (1986)
Strahler, A. N. and Strahler, A.H.,
Modern Physical
Geography,
Wiley, New York (1978)
Airy, Sir
G.
B ‘Tides and waves’,
Encyc. Metrop.,
Art. 192,
DD.
241-396 (1845)
I
LI
Patel, M. H.:
Dynamics of Offshore Structures,
Butterworth
Scientific, Guildford (1989)
Morrison,
J.
R., O’Brien,
M.
P., Johnson, J. W. and Schaaf,
S.
A., ‘The forces exerted by surface waves
on
piles’,
Petroleum Transactions,
189,
TP 2846, 149 (1950)
Sarpkaya, T.;
‘In
line and transverse forces
on
smooth and
sand roughened cylinders in oscillatory flow at high Reynolds
numbers’,
Report No.
NPS-69SL76062,
Naval Postgraduate
School,
Monterey, California (1976)
Sarpkaya, T. and Isaacson, M.,
Mechanics
of
Wave Forces
on
Offshore Structures,
Van Nostrand Reinhold, New York (1981)
Sommerfield, A,,
Partial Differential Equations in Physics,
Academic Press: New York (1949)
Stoker,
J. J.,
Water Waves,
Interscience, New York (1957)
MacCamy,
R.
C.
and Fuchs, R. A,, ‘Wave forces
on
piles, a
diffraction theory’,
US Army Corps of Engineers, Beach
Erosion Board,
Tech.
Memo.
No.
69 (1954)
Garrison.
C.
J. and Chow, P. Y., ‘Wave forces
on
submerged
bodies’,
Journal
of
Waterways, Harbours and Coastal Division,
18.
19.
20.
21.
22.
23
24
25
26
27
28
29
30
31
32
33
34
American Society
of
Civil Engineers,
98,
No.
WW3. 375-392
(1972)
Eatock-Taylor, R. and Waite.
J.
B.,
‘The dynamics of offshore
structures evaluated by boundary integral techniques’.
International Journal for Numerical methods in Engineering,
Zienkiewicz.
0.
C.,
Bettes, P. and Kelly.
D.
W., ‘The finite
element method of determining fluid loading
on
rigid
structures
-
two and three dimensional formulations’: in
Zienkiewicz,
0.
C
Lewis, P. and Stass,
K.
G.
(eds).
Numerical Methods in Offshore Engineering.
Wiley, Chichester
(
1978)
Penzien, J. and Tseng,
W.
S.,
‘Three dimensional dynamic
analysis of fixed offshore platforms’. in Zienkiewicz,
0.
C.
et
al.
(eds).
Numerical Methods in Offshore Engineering,
Wiley,
Chichester (1978)
Bathe, K.
J.
and Wilson, E. L., ‘Solution methods for
eigen-value problems in engineering‘,
International Journal for
Numerical Methods in Engineering,
6,
213-216
Malhotra. A. K. and Penzien,
J.,
‘Nondeterministic analysis of
offshore tower structures’,
Journal of Engineering Mechanics
Division, American Society
of
Civil Engineers,
96.
No.
EM6.
985-1003 (1970)
Poulos, H. G. and Davis,
E. H.,
Pile Foundation Analysis and
Design,
Wiley, New York (1980)
Reese, L.
C.,
‘Laterally loaded pile; program documentation‘,
Journal of the Geotechnical Engineering Division, American
Society
of
Civil Engineers.
103,
No.
GT4,
287-305 (1977)
Focht,
J.
A., Jr and Kock, K.
J.,
‘Rational analysis of the
lateral performance of offshore pile groups’,
Proceedings of the
Offshore Technology Conference. OTC
1896 (1973)
O’Neill, M. W., Ghazzaly,
0.
I.
and
Ho,
Boo Ha, ‘Analysis of
three-dimensional pile groups with nonlinear soil response and
pile-soil-pile interaction’.
Proceedings of the Offshore
Technology Conference.
OTC 2838 (1977)
American Petroleum Institute,
Recommended practice for
planning, designing and constructing fired offshore platforms,
Dallas, Texas, Rpt No. API-RP-2A (revised annually) (1987)
British Standards Institution, Code of practice for fixed
offshore structures, BS 6235: 1982,
BSI,
2 Park Street.
London, WIA 2BS
Dover, W. D. and Connolly, M. P ‘Fatigue fracture
mechanics assessment of tubular welded
Y
and
K
joints’, Paper
No. C141186.
Institution
of
Mechanical Engineers.
London
(1986)
Dover, W.
D.
and Wilson,
T.
J., ‘Corrosion fatigue of tubular
welded T-joints’, Paper No C136186;
Institution of Mechanical
Engineers,
London (1986)
Warburton,
G.
B.,
The Dynamical Behaviour of Structures,
2nd edition, Pergamon Press, Oxford (1976)
Newman.
J.
N., ‘The exciting forces
on
fixed bodies in waves’,
Journal of Ship Research,
6,
10-17 (1962)
Lloyd’s Register of Shipping,
Rules and regulations for the
classification
of
mobile offshore units,
January, Part IV,
Chapter 1, Sections 2, 3, 4 and
5,
Lloyd’s Register of Shipping,
71 Fenchurch Street, London EC3 4BS (1986)
Department of Energy,
Development
of
the oil and gas
resources of the United Kingdom.
Appendix 15, Department of
Enerzv. HMSO (1986’1
13.
73-92 (1978)
35. Det Korske VerGas.
Rules for classification
of
mobile offshore
units,
Det Norske Veritas, PO Box 300, N-1322. Hovik,
Oslo,
Norway (1957)
36. American Bureau of Shipping,
Rules for building and classing
mobile offshore drilling
units,
ABS,
45
Eisenhower Drive,
PO
Box
910,
Paramus, New Jersey, USA (1987)
15
Plant engineering
I
L
S
Ernie Walker and Ronald
J.
Blaen
(Section
15.3)
John
S.
Bevan
(Section
15.4.3)
Roger
C.
Webster
(Section
15.7-1
5.9)
Conte
15.1 Compressors, fans and pumps industrial boilers
15/80
15.1.1 Design principles 15/3
15.3.4 Terminology 15/83
15.1.2 Machine selection 15/13
15.3.5 Waste-heat boilers 15/84
15.1.3 Performance monitoring and prediction
15/14
15.3.6
Economizers 15/84
15.2 Seals and
15.2.1
15.2.2
15.2.3
15.2.4
15.2.5
ct requirement for chimneys and
15.3 Boilers and waste-heat recovery 15/75 flue designs 15/89
15.3.1 Types
of
boilers 15/75
15.3.2 Application an
pressure vessels, pipes
15.4 Heating, ventilation and air conditioning 15191 15.9.3 Sound power 151139
15.4.1 Heating 15/91
15.9.4 Addition and subtraction of decibels 15/139
15.4.2 Ventilation 15/97
15.9.5 Addition
of
decibels: graph method 151139
15.4.3 Air conditioning 151106
15.9.6 The relationship between
SPL,
SIL
and
15.5 Refrigeration 151114 15.9.7 Frequency weighting and the human response
SWL 151139
15.5.1 Vapour compression cycle 151115
to
sound 15/140
15.5.2 Pressure-enthalpy chart 151115
15.9.8 Noise indices 151140
15.5.3 Gas refrigeration cycle 151115
15.9.9 Noise-rating curves 15/141
15.9.10 Community noise units 15/141
15.6 Energy management 151116 15.9.11 Road traffic 151141
15.6.1 The energy manager 15/116
15.9.12 Air traffic 151142
15.6.2 Energy surveys and audits 151116
15.9.13 Railway noise 151142
15.6.3 Applications 1511 18
15.9.14 Noise from demolition and construction
15.6.4 Waste-heat recovery 151122
sites 151142
15.6.5 Control systems 151123
15.9.15 Noise from industrial premises 151142
15.6.6 Summary 151124
15.9.16 Measurement of noise 151142
15.7 Condition monitoring 15/124
15.9.18 The sound-level meter 151142
15.7.1 Preventive maintenance 151124
15.9.19 Digital signal analysis 151143
15.7.2 Predictive preventive maintenance
151124 15.9.20 Noise control 15/143
15.7.3 Condition monitoring 151125
15.9.21 Noise nuisance 151143
15.7.4 The parameters 151125
15.9.22 Health effects 151144
15.7.5 Vibration monitoring for machine
15.9.23 Damage
to
plant/machinery/building
15.7.6 Vibration analysis techniques 151126 15.9.24 Legislation concerning the control of
15.9.17 Microphones 15/142
condition 151125 structures 151144
noise 151144
15.8 Vibration isolation and limits 151129 15.9.25 British Standard 4142: 1990 151145
15.8.1 Introduction 151129
15.9.26 Noise-abatement zones 151146
15.8.2 Damping 151130
15.9.27 Planning application conditions 151146
15.8.3 Multi-degree of freedom systems 151130 15.9.28 The Health and Safety at Work etc. Act
15.8.4 Vibration isolation 151130
1974 151146
15.8.5 Shock isolation 151131
15.9.29 The Noise at Work Regulations 1989 151146
15.8.6 Vibration attenuation 151132
15.9.30 Noise control engineering 151147
15.8.7 Measurement of vibration 151133
15.9.31 Noise-reduction principles 151147
15.8.8 Vibration limits 15/136
15.9.32 Absorbers 151148
15.9.33 Vibration isolation 151148
15.9 Acoustic noise 151138 15.9.34 Practical applications 151149
15.9.1 Introduction
-
basic acoustics
151138
15.9.2 Sound intensity 151139
References 151150
15.1
Compressors,
fans and
pumps
15.1.1
Design
principles
15.1
.I
.1
General
Compressors, fans and pumps are all devices for increasing the
pressure energy
of
the fluid involved. Two basic types are
used: rotodynamic, where flow is continuous, and positive
displacement. where fluid
is
worked on in discrete packages
defined by machine geometry. Compressors, fans and pumps
may be rotodynamic, and compressors and pumps positive
displacement. In general, the positive displacement machines
give
low
mass flow and high pressure rise.
15.1.1.2 Rotodynamic machine principles
These can be discussed together as the Euler equation applies
to all types, differences being due
to
the fluid involved and the
flow path. Figure 15.1 illustrates flow path differences.
15.1.1.3 Forms
of
the Euler equation
Standard turbomachinery textbooks (see Turton') derive this
equation,
so
it will be applied here to centrifugal and axial
machines. Considering Figure
15.2
(a simple centrifugal
pump) the specific energy increase is given by the Euler
equation
gH
=
112vu2
-
UlVU,
(15.1)
where
u,,
u2
are peripheral velocities
(=wr)
Vuz,
Vu,
are the
peripheral components
of
the absolute velocities
V2
and
V,,
respectively (see Figure 15.3).
Vul
11s
usually considered as zero in design flow conditions,
gHIDEAL
=
u2
Vu2
(15.2)
SO
Radial
Mixed Axial
Figure
15.1
Flow
paths used
in
rotodynamic machines
Compressors,
fans and
pumps
1513
Figure
15.2
A
simple radial outflow machine
Inlet
velocity
VI
=
vR1
u1
curved blade
/
blade
%
Outlet
velocity
triangles
v
0
(b)
Figure
15.3
The effect of outlet angle on machine performance
15/4
Plant engineering
or
(15.3)
Qu2
'42
or when rotational speed is constant,
gH1DE.u
=
Ki
-
K2Q
(15.4)
with
K2
depending on
pz.
Figure 15.3 shows how varying
p2
affects both velocity diagrams and the
gH
to
Q
plot of
performance plots, compressors being affected at lower flows
by
surge as discussed later.
A
simple axial machine is shown
in
Figure 15.4, with typical
general velocity diagrams, which define the geometry and
terms used:
gHIDEAL
=
u[vuZ
-
vull
(15.5)
or
if
Vul
=
0 (zero inlet whirl) as assumed for pumps of fans:
gHIDEAL
=
uvu2
(15.6)
gHlDEAL
=
U'i
-
-
cot&
or
gHIDEAL
=
uvA2
(15.7)
VA2
is a function of
Q
and flow area and
pz
is related
to
blade
angles.
For compressors, as Horlock' and Turton' show,
(15.8)
and for axial machines, this is usually written
(15.9)
_-
A'
-
Cp
AT
=
u
(~VU)
P
and the velocity diagrams combine, as shown in Figure
15.5,
on
a common base.
15.1.1.4
Definitions of efficiency
In
all these machines efficiency statements are used:
Power to fluid
Power to shaft
Overall efficiency
vo
=
(15.10)
Actual energy rise
Euler energy rise
Hydraulic efficiency
vH
=
(15.11)
Delivered flow
Flow passing through rotor
Volumetric efficiency
7"
=
(15.12)
Mechanical efficiency
qM
=
(15.13)
Thus
70
=
vM
vV
vH
(15.14)
Fluid power
Input shaft power
15.1.1.5
Reaction
This is defined for a compressor as:
Energy change due to or
resulting from static pressure
change in the rotor
Total change in the stage
R= (5.15)
For an axial compressor 50% reaction means a symmetrical
velocity diagram as shown in Figure 15.5.
Figure
15.4
Axial flow pump or compressor stage and the 'ideal'
velocity triangles
Figure
15.5
Axial velocity triangles based on a common base
for
an axial stage with
50%
reaction
(Vl
=
W,;
V,
=
Wl)
Compressors,
fans and
pumps
15/5
If a simple pump is considered, it is possible to state that
there must be a working relation between the power input
P,
the flow rate
0,
energy rise
gH,
fluid properties
p
and
p,
and
size of the machine
D.
If a dimensional analysis is performed it
can be shown that a working relation may exist between a
group of non-dimensional quantities in the following equation:
Term
(1)
is
a
power coefficient which does not carry any
conventional symbol. Term
(2)
can easily be shown to have
the shape V/Uand
is
called a flow coefficient, the usual symbol
being
8.
Term
(3)
similarly can be shown to be
gH/U2
and is
usually k.nown as a head coefficieat (or specific coefficient)
4.
Term
(4)
is effectively a Reynolds number with the velocity
the peripheral speed
wD
and the characteristic dimension
being usually the maximum impeller diameter. Term (5) is
effectively a Mach number, since
K
is the fluid modulus.
Since these groups in the SI system are non-dimensional
they can be used to present the results
of
tests
of
pumps in a
family of pumps that are geometrically similar and dyna-
mically similar. This may be done as shown in Figures 15.6 and
15.7 and Figure 15.8
shows
how the effect of changing speed
or diameter of a pump impeller may be predicted. using the
scaling 1,iws:
P
p3D5
~
Const
Q
wD3
=
(:Onst
(15.17)
t
02
Qi
a
Figure 15.8
Prediction
of
speed change effect using equations
(1
5.17)
In Figure 15.8 points A define the energy rise gHand power
PI
at a flow rate
01,
when the pump is driven at speed
w,.
If
equations (15.17) are applied,
D
and
p
being the same.
QJwlD3
=
Q2/w2D3;
hence
Q2
gHJw{D2
=
gH2/w$D2;
hence
gH2
PJpw:D5
=
Pdpw2Ds;
hence
P2
This approximate approach needs to be modified in practice
to
give accurate results,
for
using model tests
to
predict full size
power, as discussed by codes such as the American Hydraulic
Institute
standard^.'^
The classical approach to the problem
of
characterizing
the performance of a pump without including its dimensions
was discussed by Addi~on,~ who proposed that a pump of
standardized size will deliver energy at the rate of one
horsepower when generating a head
of
one foot when it is
driven at a speed called the Specific Speed:
N-\/75
Ns=
K-
~314
(
15.
18)
The constant
K
contains fluid density and a correction factor,
and it has been customary to suppress
K
and use the equation:
(15.19)
Figure
15.6
A
pump characteristic
for
constant rotational speed
h
Power
coeff
Pc
Figure
15.7
A
non-dimensional plo‘c lor
a
pump
Caution
is
needed in using data as the units depend
on
the
system
of
dimensions used, variations being litres/minute,
cubic metres/second, gallons per minute or
US
gallons per
minute as well a metres or feet. Plots of efficiency against
specific speed are in all textbooks based upon the classic
Worthington plot, and Figure 15.9, based on this information,
has been prepared using a non-dimensional statement known
as the characteristic number
(15.20)
This is based
on
the flow and specific energy produced by the
pump at its best efficiency point
of
performance following the
approach stated by Wisli~enus:~ ‘Any fixed value
of
the
specific speed describes a combination
of
operating conditions
that permits similar flow conditions in geometrically similar
hydrodynamic machines.’
Figure
15.10
presents,
on
the basis
of
the Characteristic
number, the typical impeller profiles, velocity triangle shapes
and characteristic curves to be expected from the machine
flow paths shown. In the figure the characteristic ordinates are
15/6
Plant engineering
II
(Yo)
90.
80
70
60
50
401
I
I
II
appear
in
metric form, as can be seen. The rules used are often
called the Scaling Laws, written in the form:
Other methods of adjusting the output while keeping the
speed constant consist of modifying the profiles of the blades
at the maximum diameter of the impeller. This technique has
been used for a long time and is often used to obtain a small
energy rise when the pump is down in performance when
tested. (The reader is referred to Karassik
et
aL5)
For compressors equation (15.16) could be employed
but
convention generally uses:
(15.22)
0.1
1.0
2
46
Radial Mixed
flow
Axial
Figure 15.9 The variation of overall efficiency with
non-dimensional characteristic number
k,
for pumps (Turton’)
are the ratios of actual head/design head and actual
flow/design flow. This indicates the use of the number as a
design tool for the pump engineer.
The scaling laws (equation (15.17)) may
be
used to predict
the performance from change
of
speed as indicated
in
Figure
15.8.
In
many cases the pump engineer may wish to modify the
performance of the pump by a small amount and Figure 15.11
illustrates how small changes in impeller diameter can affect
the performance. The diagram in its original form appeared
in
the handbook by Karrasik
et
aL5
and has been modified
to
The temperature and pressure statements are conventionally
stagnation values. Most compressor manufacturers use a
dimensional form, and state the gas involved,
so
that equation
(15.22) becomes:
(15.23)
Figure 15.12 presents a typical compressor plot.
15.1.1.6
Positive displacement machine principles
Whether the machine is of reciprocating or rotary design, fluid
is transferred from inlet
to
outlet in discrete quantities defined
by the geometry of the machine. For example, in a single-
acting piston design (Figure 15.13) the swept volume created
by piston movement
is
the quantity delivered by the pump for
each piston stroke, and the total flow is related
to
the number
Non-dimensional
k,
Impeller profiles Velocity triangles Characteristics
0.567
I-
do4
d21do
=
3.5
-
2.0
0.567-
0.944
d21do
=Z.O-
1.5
0.188-
u2
-
u2
loo
165
sQ/Qdesion
0
0.944-
1.511
dzldo
=
1.5= 1.3
@
1.511-
2.833
It
do
r!
d21do
=
1.2
-
1.1
0
100
155
QlQdesign
HA
0 100 140
QlQdesign
Figure
15.10
Impeller profiles, velocity triangles and typical characteristics as a function of
k,
(Turton’)
Compressors,
fans
and
pumps
15/7
Crank
Connecting Discharge
1
4.
Plunger
90
r-
30
1
I
I I
200
3
175
Y,
&
150
3
L-?
125
100
75
0.
a
0.2
0.3
Q
rn%
Figure
1%11
(adapted from Karrasik et
a/.?
Pump scaling laws applied to diameter change
-
Pa2
Po
1
Lines
of
constant
efficiency
F
mdToi
Po
1
Figure
15.12
A typical compressor plot
I?
/
I
I
I
t
Crokhead Take-up
Packing
Cylinder
guide
Suction
Figure
15.13
A plunger pump (or piston pump)
of
strokes per unit time. Similarly, the spur-gear device
(Figure
15.14)
traps a fixed quantity in the space between
adjacent teeth and the casing, and total flow rate is related
to
the rotational speed
of
the gear wheels.
Q,
=
displacement
X
speed
as shown in Figure
15.15.
The actual flow
is
reduced by
leakage, flow
QL:
Q
=
Qo
-
QL
The maximum possible flow rate
n
'
Figure
15.14
An external gear pump
I
Qo
Ap
(or
H)
Figure
15.15
The typical characteristic
of
a positive displacement
pump driven at constant speed
15/8
Plant engineering
The volumetric efficiency
Gas
pressure
on
free
surface
Throttle
bush often
fitted
Figure 15.17
Accumulator designs to reduce pulsation
Q
QL
7,
=
-
=
1
-
-
Qo
Qo
and
(15.24)
(15.25)
PI,
and
PL
are defined
in
Figure
15.15.
Table
15.1
gives typical
values of
7"
and
TJ~
for a number of pump types.
Since discrete quantities are trapped and transferred, the
delivery pressure and flow vary as shown in Figure
15.16:
which also illustrates how increasing the number
of
cylinders
in a reciprocating pump reduces fluctuations. In the case of
lobe and gear pumps the fluctuations are minimized by speed
of
rotation and increasing tooth number,
but
where, for
control or process reasons, the ripple in pressure is still
excessive a means of damping pulsations must be fitted. Often
a damper to cope with this and pressure pulses due to valve
closure is fitted, two types being shown in Figure
15.17.
The
capacity of the accumulator is important, and one formula
based on experience for sudden valve closure is
QP2(0.016 L
-
T)
QA
=
X
0.25
(PZ
-
PI)
(15.26)
Here
QA
is the accumulator volume (m3);
Q
is
flow
rate
(m3/s);
L
is pipe length
(m);
Tis valve closure time (seconds);
Table
15.1
Some values of
17"
and
7o
for positive displacement
Pumps
Precision gear
+98 +95
External gear
-
2MO
Screw
-
75-85
Vane
85-90 75-80
Radial
-
multi-piston
>95 >90
Axial
-
multi-piston
>98 >90
I.:
Time
One complete revolution;
1
ofcrankshaft
I
ti:.
Diaphragm
PI
is the pressure in the pipeline (N/m2); and
P2
is the
maximum pressure desired in the line (N/m2)
(P2
=
1.5P1
in
many cases).
15.1.1.7
Limitations
on
performance
For pumps, performance is limited by cavitation, viscosity
effects, gas entrainment and recirculation. Cavitation occurs
in the suction zone of a pump due to the local pressure falling
to around vapour pressure as Figure
15.18
illustrates.
Figure 15.18
Pressure changes on a stream surface in the
suction zone of a rotodynamic pump
E+ =
Single crank
-
Two
cranks
180"
out
of phase
I
Tme
,
ting flow pattern (separated for clarity)
Tme
Three
cranks
120"
out of phase
Figure 15.16
The variation in flow rate with numbers
of
cylinders caused
by
a reciprocating pump
Compressors,
fans
and
pumps
1519
can be used for the duty flow required. Equation (15.27)
is
used for reciprocating and rotary positive displacement
machines, but allowance is made for acceleration effects.
In reciprocators
hf
is calculated at peak instantaneous flow.
including maximum
loss
through a dirty filter, and an addi-
tional head
‘loss’
to allow for pulsation acceleration
is
used:
The pump flow range is reduced as suction pressure
reduces. Cavitation also causes considerable damage as
bubbles of gas
form
and then collapse. Two criteria are used to
judge whether a pump is in trouble from cavitation or not: one
is the concept
of
NPSH (net positive suction head) and the
other is the noise generated.
Net positive suction head is the margin of head at a point
above the vapour pressure head. Two statements are used:
NPSH available and NPSH required:
NPSHA
:=
Total head at suction flange
-
vapour pressure
Figure 15.19 illustrates how system NPSH or
NPSHavaiiable
is
calculated for the usual suction systems shown.
For a centrifugal pump, the basic NPSH is calculated from
head
(15.27)
where
h,
=
static suction head at the pump suction
(rn)
hf
=
flow
losses in suction system (m)
B
=
minimum barometric pressure (mbar)
(use 0.94
of
mean barometer reading)
P,
=
minimum pressure on free surface (bar gauge)
P,
=
vapour pressure at maximum working temperature
(bar absolute)
In the process industries
hf
is calculated for the maximum
flow rate and the
NPSH
at normal flow allowed for by using
the formula
NPSHA
0.8 [NPSHba,,,
-11
(15.28)
This gives a ‘target’ value
to
the pump supplier that
is
‘worst’
condition. In general,
for
cold-water duties equation (15.28)
-
pressure
r
abwlute
vacuum
Figure
15.19
A
visualization
of
the way NPSH is calculated
for a pump suction system.
(Courtesy
of
Girdlestone
Pumps
Ltd)
700
NQ
L
2
d2
hA
=
c__
2-
where
N
=
crankshaft rotational speed (rpm)
Q
=
flow rate,
(1
s-l)
L
=
length
of
line
(m)
d
=
diameter of line (mm)
and
NPSH
=
NPSHA
-
hA
For metering pumps,
(15.29)
(15.30)
(15.31)
hf
is as for the reciprocating pump based on peak instanta-
neous flow and
(15.32)
15.1.1.8
NPSH required
(NPSHR)
This is a statement of the NPSH that the pump can sustain by
its own operation,
so
that the operating requirement is that
NPSHR
<
NPSHA and Figure 15.20 indicates how the critical
operating flow is related
to
NPSHA and NPSHR. The usual
operating criterion is based on a cavitation test (Figure 15.21).
The critical NPSHR
is
defined as the point at which the pump
head falls by
x%
(3%
is often used).
For the centrifugal pump two terms are in common use: the
Thoma cavitation number
u
and the suction specific speed
SN:
(15.33)
NPSHR
is
defined as in Figure 15.22. This figure gives a typical
plot of
u
against
k,
that may be used as a first ‘design’ estimate
of NPSHR, but in many applications test data are required:
NPSHR
U=
Pump head rise
flow
rate
Figure
15.20
Critical flow rate determined
by
cavitation
considerations
15/10
Plant engineering
t
P
r
P
f
a
Test at
design
flow
at design
rotational
speed
I
Critical
NPSH
NPSH
Figure 15.21
A
conventional presentation
of
pump
cavitation
behaviour
Figure 15.22
Variation
of
u
with
k,
for rotodynamic
pumps
(Turton’)
N.\/iz
SN
=
K(NPSHR)~’~
(15.34)
where
K
is a constant
=
175 if
g
=
9.81 m
s-*,
Q
is in l/s, Nin
revolutions/second, and
NPSHR
is m of liquid.
A
‘good’ value
of
SN
for a centrifugal pump is around
10
000.
For reciprocating metering pumps
NPSHR
is related to
valve loading as shown in Figure
15.23:
(15.35)
where
dv
=
nominal valve size
(mm)
for single valves, and
PQ*
A=-
8ovQp
+
15
x
105-
Zd;
Z2d$
(15.36)
for double valves. It is recommended that for hydraulically
operated diaphragm pumps the extra losses imposed by the
diaphragm and support plate are treated as a single unloaded
valve.
For other reciprocators
0.12(p~)O.~~
NPSHR
=
5U2
+
(15.37)
P
Figure 15.23
NPSH
requ,re,j
for reciprocating metering
pumps
related to valve
spring
loading (equations
(15.35)
and
(15.36)
Increasing
viscosity
Efficiency
I/‘
~~~~
Capacity-
Figure
15.24
Effect of viscosity increase
on
centrifugal
pump
performance
where
U
=
mean plunger speed (m
s-’)
and
Pd
=
discharge
pressure bar absolute.
Viscosity affects pump performance by increasing
flow
losses. Figure 15.24 illustrates the deterioration as viscosity
increases. If the kinematic viscosity is greater then
100
centi-
stokes, water performance must be corrected as shown later in
Compressors,
fans
and
pumps
1511
1
Figure 15.27. Figure 15.25 indicates that in a positive displace-
ment
pump
the volumetric efficiency improves and power
requirement increases (with increasing viscosity).
Table 1.5.2 summarizes the effects of liquid changes (effect-
ively, viscosity and density changes)
on
pump performance
and Figure 15.26 presents material by Sterling6 which
illus-
trates how efficiency falls away with viscosity for two pumps
working at the same duty point, graphically illustrating the
rapid decay of efficiency as
p
increases in a centrifugai pump.
Figure 15.27 demonstrates a well-known method of correct-
ing for fluid change from water for a centrifugal pump.
This
allows an engineer to predict change in performance if the
kinematic viscosity of the liquid to be pumped is known and
the water test data are available.
Recirculation effects at low flow rates are now well docu-
mented, and can cause vibration and,
in
some cases, severe
QP
b
AP
Figure
15.25
displacemlent pump performance
Effect
of
viscosity increase on positive
Table 15.2
The effect
of
viscosity
-
a comparison
Type
of
pump Significant Effect
of
viscosity level Treatment and/or notes
viscosity levels
a
Centrifugal
Regenerative
Reciprocating
Plunger
Sliding vane
External gear
20
20-100
Above
100
Above
100
up
to
100
Above
100
Above 1000
-
Above
100
None
Internal gear None
Lobe roto1
Single-screw
Twin- or
multiple-screw
250
Above 250
None
Up to
500
Above 500
Lowering
of
H-Q
curve
increase in input hp
Marked loss of head
Marked loss
of
performance
Little
Performance maintained
but power input increased
Flow through valves may
become critical factor
-
Sliding action impaired:
slip increased
Power input and heat
generated increases with
increasing viscosity
Power input and heat
generated increases with
increasing viscosity
None
Cavitation may occur
-
Little
or
none
Increasing power input
required
Performance maintained similar
to
water performance
General lowering of efficiency but may be acceptable
Considerable reduction in eificiency,
but
high
up to this level
efficiencies may still be attainable from large
Pumps
Pumps of this type would not normally be considered
for handling fluids with a viscosity greater than
100
centistokes
Performance generally maintained. Some reduction
in
speed may be advisable to reduce power input
required
Speed is generally reduced to avoid excessive power
inputs and fluid heating
Larger pump size selection run at reduced speed
-
e.g.
3
X
size at
1000
centistokes running at
one-third speed. Modification
of
valve design may
be desirable for higher viscosities
For very high-pressure deliveries only
Not generally suitable for use with other than light
May be suitable for handling viscosities
up
to
25
000
viscosity fluids
centistokes without modification. For high
viscosities:
(a) Clearances may be increased
(b)
Speed reduced
(c) Number of gear teeth reduced
For higher viscosities:
(a)
Speed may be reduced
(b) Number of gear teeth reduced
(c) Lobe-shaped gears employed
(a) Speed may have to be reduced
(b)
Modified rotor form may be preferred
Nitrile rubber stator used with oil fluids
Speed may be reduced
to
improve efficiency
-
a
Viscosity
in
centistokes
15/12
Plant engineering
ao
60
L-
1
10
100
1000
10
000
p
(centipose)
Figure
15.26
Comparison of efficiency reduction with viscosity
increase for a screw pump and a centrifugal pump of similar duty
cavitation damage. Papers given at a recent conference’
indicate the magnitude
of
the problem.
Gas content is another important effect. It is well known
that centrifugal pumps will not pump high gas content mix-
tures, as flow breaks down (the pump loses ‘prime’) when the
gas/liquid ratio rises beyond
15%.
Figure 15.28 clearly shows
how a centrifugal pump is affected particularly at low flow
rates, and the behaviour is typical of conventional centrifugal
pumps. Figures 15.29 and 15.30 present well-known informa-
tion
on
the effects of dissolved and entrained gas on the
volumetric efficiency of a positive displacement pump.
Fans are often used in near-ambient conditions, and density
change is not significant,
so
that inlet density is used in power
calculations. Care is needed in air-conditioning systems
to
correct for the temperature at the fan inlet. Axial fan perfor-
mance is affected by blade stall as in compressors.
A compressor characteristic is shown in Figure 15.31. Flow
is limited at the high mass flow end of the curve at any speed
when local velocity in a passage (usually the last stage outlet
guide vanes in an axial machine and the diffuser vane ring in a
radial compressor) reaches sonic velocity and thus mass flow
cannot increase further. The phenomenon of surge is more
complicated as it is caused by flow instability.
Its
effects can be
limited by reducing the pressure rise in an axial stage but not
eliminated. Rotating stall occurs in both radial and axial
machines and its action is shown in Figure 15.32.
A
vane stalls
and affects flow round an adjacent vane which in turn stalls.
This effect thus propagates round the blade row, in the
opposite direction
to
rotation, at about half the rotational
speed. Reference
2
gives more detailed discussion.
Figure 15.31 shows the total limitations
on
the compressor
surge line and mass flow rate of stall and choking. For detailed
discussion, textbooks such as those by Horlock’ and Balje”
may be consulted.
f
I
,
I I//
1
I
I
00
100
200
400
600 1000
2000
4000
6000
10000
Flow
(USGPM)
I
I
1
I
I
I
I
400
750
1500 3000
7500
15000 30000
Flow
O/rninl
Figure
15.27
A method
of
correction for viscosity (adapted from
American Hydraulic
standard^'^).
Example: The pump is
to
handle 750 USGPM of
1000
SSU Liquid against a head of 30 m.
From the diagram,
C,
=
0.64;
Ca
=
0.95;
C,
=
0.92 at duty point
(1.0
x
QN).
To
test on water needs tests at a flow rate of 789.5
USGPM and 32.6 m: if
the
test efficiency
’1
is 75%, oil
efficiency
e
0.75
x
0.64
=
48%
/
increasing air content
Figure
15.28
Effect of gas content
on
centrifugal pump
performance
1lOr
Gas
solubility,
%
by volume
0-
4u
0
2 4
6 8 10
12 14
16
18
20 22 24 26 28
30
Suction
lift
in
Hg
(referred
to
30-in
barometer)
Figure
15.29
Gas solubility in water
Compressors,
fans and
pumps
15/13
Stall cell
movement
+
0
.d
110
Gas
entrainment,
%
by
volume
1
2P
3
0
5C'
5;
40'b
;
k
6
1'0
,
112
Ik
1;
1'8
:o
:2
:4
162;
L
(a)
Suction
lift,
in
Hg
(referred to 30-in barometer)
2
4
6 8
10
12
14
16
18
20
(b)
Solubility,
%air
by
volume
Figure
15.30
(a)
Effect
of
entrained gas
on
liquid
displacement
for
a
positive displacement
pump;
(b)
solubility
of
air
in
oil.
Example:
At
a
pressure
of
5
inches
Hg
with
3%
gas
entrainment
by
voluini?
pump
capacity is reduced to
84%
of
theoretical
displacemlent
First stage
sta
I
led
-
hdT1
P1
Figure
15.31
Limits placed on compressor performance
15.1.2
Machine
selection
Although Baljex and Csanady9 have proposed a common basis
of
performance presentations using a non-dimensionalized
number resembling specific speed, each type of machine will
be discussed separately. Engineers employed in water supply,
the process industries and other spheres of activity have a
formidable task when selecting equipment. If the equipment
movement
Figure
15.32
Rotating stall
in
an
axial
blade row
they select does not come up
to
specification the maximum
claim
on
the supplier is the price paid. The cost to their
company is that
of
plant downtime and lost production which
is
likely to exceed equipment costs by many times. 'Buyer
beware' is thus a normal rule.
To
assist the buyer there are
BS
and
IS0
specifications and codes of practice such as the
American Petroleum Industry
(API)
standards, but in many
areas there are
no
such aids, and the buyer has
to
rely
on
advice, experience and, ultimately, engineering common
sense.
Any pump, fan or compressor selected must fulfil the
specified duty (or duties) and be capable of operating safely
and economically with a minimum
of
maintenance and down-
time. The selector has therefore a challenging task. The first
essential task is to prepare the technical brief which will
become the tender document. This brief must state the entire
operating envelope
of
the machine, with complete details of
temperature, humidity, fluid properties and site variations,
and detail the standards and codes which will apply, e.g. API
610"
for refinery and petrochemical centrifugal pumps. This
covers materials, bearing and seal systems, pressure testing
of
casings. vibration and noise limits, hydraulic performance,
draft documents, shipping and installation in over
100
pages.
In
short it is a comprehensive document of mutual understand-
ing between customer and supplier.
The project engineer needs data to decide which type of
machine, likely size, rotational speed and drive system before
submitting a detailed tender document. Some basic charts will
therefore be discussed.
The principles of the two groups of pumps (rotodynamic
and positive displacement) have been discussed, and Figures
15.33 and 15.34 illustrate the main types. A universal index
of
flow path and size for centrifugal pumps is the specific speed
referred to above (Figure 15.10) which indicates the flow path
shapes and probable characteristics.
A
useful pressure to flow
rate envelope is shown in Figure 15.35. Once a type is decided,
manufacturers' data may be consulted. Usually these are test
data when pumping water
for
rotodynamic machines, and an
approximate idea
of
performance can be obtained by convert-
ing water data using a conversion chart as described earlier.
When considering the selection of positive displacement
pumps, Figure 15.36 is a useful range guide. Fan selection
devolves into the choice of an axial or a centrifugal machine,
and whether a single- or double-stage machine is required, but
choice is usually determined by
flow
rate and pressure
rise
needed, and in some cases by the space available in which a
machine will need
to
be installed. Table 15.3 gives a working
basis for fan selection.
Figure 15.37 outlines the main types
of
compressor, and it
must be said that when selecting turbo compressors the choice
of machines is a function
of
delivery pressure and flow rate (as
Figure 15.38 indicates). To extend consideration further,
Figure 15.39, based
on
an article
in
a
Sulzer
Technical Review,
15/14
Plant
engineering
Figure
15.33
Some typical pump layouts.
(a)
A
monobloc design with the impeller fixed on the motor shaft; (b)
a
modern back pull-out
design; (c) a double-entry pump; (d)
a
multistage pump design
covers plant supplied by the company
of
both turbomachine
and positive displacement, screw, vane, or diaphragm types.
Most makers offer oil-lubricated and non-lubricated
machines.
As Figures 15.38 and 15.39 indicate, the selection of com-
pressor type depends
on
the pressure rise and flow rate
required. Large compressors are supplied for a number of
duties. About
20%
are used for air compression, for factory
services where usage is typically around
87
bar for energy
storage, for other industrial duties, or in bottles. Industrial
usage in the field
of
oxygen, nitrogen and medical gases
accounts for a large sector. Natural gas transmission is also a
substantial field of application. The industrial and process
processes work on pressure up to about
400
bar. Polyethylene
processes demand pressures up to
3500
bar. As the discussion
on pumps indicated, when the duty could be met by a number
of types, choice is often determined by experience in service,
complexity or cost. The only positive attitude is probably to
choose a turbomachine unless company policy dictates a
positive displacement one. One factor with compressors is the
temperature rise (over 150°C with a reciprocator). Cooling
causes water and water vapour to accumulate with the conse-
quent need for careful after cooling, intercooling between
stages in multi-stage machines and water collection to prevent
tools, instruments or equipment being damaged.
Oil injection is often used in screw and rotary vane machines
to cool and to help eliminate water. Wear is also reduced. Oil
injection at the rate
of
up to
20
mg
m-3
of gas is used, and
then filtered well below the contamination limit for factory air
(5
mg
~n-~).
(An efficiency of recovery
of
99.9999% has been
claimed.)
Selection methods should reflect operating experience as
well as being based
on
intelligent use of manufacturers’ data,
satisfactory performance results from rigorous adherence to
company specifications as well as good selection.
15.1.3 Performance monitoring and prediction
Any
pump, fan or compressor is supplied against a contract
duty.
In
the case of many small pumps and fans which are
quantity or batch produced makers will often quote against a
typical performance which they check by routine testing, and
will only do a full works test if a customer requires this. With
larger pumps, fans and compressors, a full works test (usually
witnessed) is required, and often check tests when installed in
the systems will be needed; this latter point will be discussed
together with routine monitoring.
15.1.3.
1
Works
tests
For back-pull out pumps
IS0
519911 covers all aspects, includ-
ing testing, seals, bearings, noise and vibration, and lists all
the relevant
IS0
and related BS 5316 standards, among which
Part
1
(for general-duty class C pumps) and Part
2
(for class
B
Compressors,
fans
and
pumps
15/15
CISCHARGE
DISCHARGE
CR
t
(a)
t
CONNECTING
ADJUSTABLE
t
BYPASS
VALVE
/
HYDRAULIC
/
FLUID PLUNGER DIAPHRAGM
SUCTION
(b)
Figure 15.34
Some positive displacement pump designs. (a) Single plunger pump;
(b)
simple diaphragm pump; (c) mono pump; (d)
twin-screw pump;
(e)
steam reciprocating pump;
(f)
gear pump; (9)
lobe
pump;
(h)
vane pump
15/16 Plant engineering
1
in
inn
1
10
100
Flow
(lis)
Flow
Ws)
Figure
15.35
Range chart for rotodynamic pumps (after data
published
by
Nederlandse Aardolie
MIJ
BV)
Figure
15.36
Range chart for positive displacement pumps (after
Nederlandse Aardolie
MIJ
BV)
Table
15.3
An aid to fan selection
Type Pressure Industry Normal Applica-
volume drive tion
tt
Axial
00
Propeller
tt
!I
Bifurcated
ir
Paddle
Forward
@
Backward
2.5
in w.g. Very high
high volume
0.4 in w.g. Low
high volume
1.0 in w.g. Medium
up to
approx.
10 000 CFM
12 in w.g. Medium
up to
approx.
30 000 CFM
6.0
in w.g. High
very high
volume
20 in w.g. High
high volume
42
in w.g. Medium
usually low
volume
H
and V
H
and V
Fume
Dust ant
fume
H
and V
Dust and
fume
General
Direct
Direct
Direct
Vee an
direct
Vee and
direct
Vee and
direct
Direct
General use for ventilation, heating and minor fume
work
on
low-pressure systems
Usually applied
on
free air work: such as input and
output units for buildings due to pressure limitations
Motor not in air-stream. Used on explosive fume, wet
fume, high-temperature work and severe applications
General dust and frame. Will handle air containing dust
and chippings. Wide application in wood-waste
extraction plants
Will only handle clean air. Compact and quiet running.
Used on heating, ventilation and air-conditioning work
General dust and fume. High-pressure systems and
on
dust-collector plants. Will handle some dusty air
Furnace blowing, cooling, conveying and where there is
a need for high pressures
Blowers
Compressors, fans
and
pumps
15/17
Rotary
Compressors
Reciprocating
Ejector
-1
Radial
1
Axial
1
ROOIS
Figure
15.37
Basic compressor types
COMPRES3OR CAPACITY-LITRESISECOND
COMPRESSOR OPERATING RANGES
Figure
15.38
An
approximate range chart for compressors
15/18
Plant
engineering
r
10000
kW
10
kW
I
1
100
kW\
1000
kW\
IO4
kW
IO5
kW
10
100
1000
10
000
100 000
1
x
106
Actual suction volume
(m3/h)
Figure
15.39
An
example of
a
manufacturer’s range chart (based on
a
Solzer
Review
article17).
AI
-
reciprocating compressor, lubricated
and
non-lubricated cylinders;
A,
-
reciprocating compressors, lubricating compressors;
B
-
screw compressors,
dry
or oil-flooded rotors;
C
-
liquid
ring
compressor;
D
-
rotary (Roots type);
E
-
centrifugal compressors;
F
-
axial
compressors
pumps) detail test arrangements and procedures as well as
instrumentation for pressure, flow, torque power and speed.
Permissible bands of readings are specified as are alternative
cavitation tests. In the case of BS 5316 it is stated in an annex
that for mass-produced pumps the manufacturers, if they state
that the standard is being satisfied, must be able to ensure that
performance for any pump does not diverge from the pub-
lished curve by more than
+6%
for total head,
+8%
for flow
rate and
t8%
for input power. This allows customers to have
confidence in the published curves. Similar provisions will be
found in the American Hydraulic Institute Standards.13
If
the
pump is to follow API 610 these standards must be satisfied.
Where the liquid to be pumped
is
not water it is common
practice to test
on
cold water and to predict the performance
to he expected by using a chart such as Figure 15.36, which
gives an example of how water test duty may be obtained if the
duty
is
known.
For fans, standards also specify instrumentation and test rig
layout. BS 848: Part
li4
gives methods of standardized testing
and also of prediction when models are used and
of
allowance
for compressibility. Since fan noise is important in ventilation
systems
BS
848: Part
214
lays down noise-testing techniques
and gives details of test chambers and site provisions. The two
parts form an essential item of fan test provision, and give all
the necessary equations required for test data presentation as
well as for prediction
of
probable performance from model
tests, and for correction for non-standard situations and air
conditions.
A similar standard,
BS
2009,”
covers acceptance tests for
turbo-type compressors and exhausters. This also states provi-
sions for standardized rig layout and instrumentation and
methods
of
presenting data in a standardized way. Corrections
for compressibility and methods of performance prediction are
all given.
BS 1571: Part
116
lays down provisions for testing positive
displacement compressors of all the common types in use,
both in packaged form and other installations.
All the standards give lists of British Standards which are
relevant and quote IS0 Standards which correspond. The
reader is referred to the literature listed if test procedures and
equipment are being planned and where standardized me-
thods of performance are being sought for contract purposes.
Performance prediction is covered in the standards and fol-
lows broadly the dimensionless quantities described here.
15.2
Seals and sealing
15.2.1
Compression packing
15.2.1.1
Introduction
Compared to the deterministic qualities
of
ferrous metals, for
example, the essentially deformable nature
of
sealing ma-
terials has introduced a measure of variability that causes
many commentators to regard fluid sealing technology as an
art rather than a science. Seen as an anachronism in a period
of high technological achievement, compression packings
show
no
signs of losing significant ground in terms
of
produc-
tion quantities as new and improved types proliferate in both
Europe and elsewhere.
To
understand this situation requires
some appreciation of the fundamental mode of operation of
the adjustable gland or stuffing box shown in Figure 15.40.
Seals
and sealing
15/19
0
Frequent ability
to
cater for adverse conditions without
elaborate precautions
Valves
If any doubt exists regarding selection
on
pumps then
a much more obvious choice of soft packing applies to the
valve scene. The relative lack of movement, ease
of
fitting
and, in this case, lack of leakage requirement for lubrication
purposes (plus the most decisive advantage
of
low cost) are
factors which ideally relate to compression packings.
There are areas where moulded elastomeric seals present a
reasonable alternative but even the most exotic compounds
would seldom be used above
250°C
-
unless reinforced by
asbestos fabric.
Compressive force
System
pressure
c
Y
Figure 15.40
Compression
packing
This may be filled with
split
packing rings chosen from a
variety
of
materials and constructions, described elsewhere,
which art: persuaded to react against a shaft, whether rotary or
reciprocating, to the extent that the radial force developed
exceeds the pressure to be sealed. Packings in this category
used for rotating or reciprocating equipment rely
on
a con-
trolled leakage for long-term lubrication purposes if they are
to survive for an adequate period. The continued justification
for the icompression packing might appear obscure against
such a background but there can be no doubt that certain areas
of application exist where no reasonable substitute is avail-
able.
Pumps
Many reasoned and well-researched papers have
been published to support mechanical seals against soft pack-
ing, and vice versa. There is
no
doubt that the former have
supplanted packed glands as original equipment
on
the major-
ity of rotodynamic pumps for a variety of process and service
fluids, but there are operating parameters and cost considera-
tions which will frequently dictate the choice of soft packing.
Table
158.4
compares the relative attributes of the two con-
tenders
in
basic terms.
In general, it may be said that, unless zero leakage is an
absolute priority, compression packings will retain an impor-
tant position wherever regular maintenance is available and
the following considerations apply:
@
Simplicity in gland design and ancillary equipment
@
Ease
of
fitting
0
Flexibility of supply and spares for plant utilizing many
different types and sizes
of
pump handling a wide variety
of
fluids.
Tabre
15.4
15.2.1.2
Operating principles
By comparison
to
the seal types described in the litera-
ture
-
particularly elastomeric lip and squeeze seals
-
compression packings respond to applied pressure in inverse
proportion to the hardness of their construction and rely
on
an
external force to produce the radial pressure required for
effective sealing. The method of generating that force can vary
but usually (and preferably) involves a bolted gland spigot as
shown in Figure
15.40
where controlled axial movement is
easily achieved by adjustment of the retaining nuts or studs.
Spring loading is sometimes used in inaccessible situations but
such a provision lacks the fine control demanded by some
packing types and has a limited range of load capability.
While the sealing force can be adjusted
to
cater for service
wear, care must be taken to avoid overcompression which will
lead to excessive friction, shaft wear and premature packing
failure.
To increase density and dissipate heat, soft packings inva-
riably contain lubricants,
loss of
which, through excessive
compression or overheating in service, will result in packing
volume loss with subsequent reduction in the effective sealing
reaction and correspondingly increasing leakage rates. By
limiting compression to a point where slight controlled leakage
is obtained, adequate lubrication
of
the dynamic surfaces is
ensured and overcompression of the packing avoided.
However, where lubrication is a problem
-
or a degree
of
gland cooling is required
-
a lantern ring can be incorporated
into the gland area for the distribution
of
additional lubri-
Cornpar,ison
Initial cost
Reliability
Installat
ion
Maintenance
Spares
Shaft wear
Operating costs
Soft
packing Mechanical seal
Of the order of
10:l
in favour of soft packing depending
on
size and application
Ample warning of impending failure with
possibilities for correction
Essentially simple
-
requiring
no
special skills
if
correct procedure adopted
Regular and irequiring experience Zero
Facility for stocking length form material or
complete pre-formed sets at relatively low cost
Can be considerable; shaft sleeves reduce
replacement costs
Friction losses slightly higher with soft packing
Leakage losses zero with mechanical seals but positive with soft packing as lubrication
of
sealing rings is
essential
APPROXIMATELY EQUAL
Little or
no
warning
of
end
of
useful life with
possibility of sudden complete failure
Skilled fitting required
-
precisely defined
environment and assembly
Spare seal components must be available
-
cost
can be substantial
Nil
15/20
Plant engineering
Additional
lubricant/coolant
Barrier fluid
)J
Lantern
’
‘Distribution
ring ports
(a)
Flushing fluid
I
A
Y
x
Supply of sealed medium
to
prevent air-drawing
I
Figure
15.41
cant/coolant (Figure 15.41(a)). The position of a lantern ring
will depend
on
the nature of the application but, since the
packing rings nearest to the gland spigot do most of the work,
the additional fluid should usually be introduced near to that
area.
If
it is essential that the fluid being pumped does not escape
to atmosphere (e.g. a toxic medium), the lantern ring may
serve to introduce a barrier fluid at a pressure of 0.5-1 bar
above that to be sealed (Figure 15.41(b)). Similarly, where
there is a risk
of
severe abrasive wear to
the
packing, a
flushing fluid may be introduced through the lantern ring
(Figure 15.41(c)). For application with negative pump press-
ures (i.e. suction) a supply
of
the medium being sealed can be
made through the lantern ring to prevent air-drawing (Figure
15.41(d)).
If
extreme temperatures are to be encountered it is unlikely
that cooling through the lantern ring will be sufficient and
recourse must be made to internal cooling of the gland housing
and shaft to reduce the temperature at the gland to a value
within the packing’s capabilities. Conversely, when dealing
with media which crystallize or congeal when cool (e.g. sugars,
tars, etc.), the packing will face rapid destruction unless gland
heaters or a steam-jacketed arrangement are employed to
restore the fluid state before starting up.
It should always be remembered that the inclusion of a
lantern ring into the gland area invariably complicates as-
sembly and can provide a possible source of shaft scoring.
They should, therefore, only be considered when the nature of
the application absolutely demands their presence.
15.2.1.3
Gland design
At this juncture, few international standards exist to define
housing design for soft packings but the dimensions
shown
in
Table
15.5
should be satisfactory for most applications.
Hous-
ing depths will vary with individual circumstances, such as the
inclusion of a lantern ring, but five rings
of
square-section
Table
15.5
Suggested housing widths in relation
to
shaft diameters
(all
dimensions in millimetres)
All
packings except expanded graphite
Expanded graphite
Shaft diameter Housing width Shaft diameter Housing width
up to 12
3
up
to 18
3
Above
12-18
5
Above 1&75 5
18-25
6.5
75-150 7.5
25-50
8
150 and above 10
50-90 10
90-150 12.5
150 15