báo cáo khoa học: " Detection of DNA fusion junctions for BCR-ABL translocations by Anchored ChromPET" pot
Bạn đang xem bản rút gọn của tài liệu. Xem và tải ngay bản đầy đủ của tài liệu tại đây (1.06 MB, 13 trang )
MET H O D Open Access
Detection of DNA fusion junctions for BCR-ABL
translocations by Anchored ChromPET
Yoshiyuki Shibata
†
, Ankit Malhotra
†
, Anindya Dutta
*
Abstract
Anchored ChromPET, a technique to capture and interrogate targeted sequences in the genome, has been devel-
oped to identify chromosomal aberrations and define breakpoints. Using this method, we could define the BCR-
ABL1 translocation DNA breakpoint to a base-pair resolution in Philadelphia chromosome-positive samples. This
DNA-based method is highly sensitive and can detect the fusion junction using samples from which it is hard to
obtain RNA or cells where the RNA expression has been silenced.
Background
Chromosomal translocations play a major role in several
genetic diseases. Translocations between genes h ave the
potential to constitutively express or repress genes and
hence lead to different diseases. The Philadelphia chro-
mosome (Ph) is a prime example of such a tr anslocation ,
where a fusion gene is constitutive ly expressed and leads
to a particular class of leukemia. There are other translo-
cations that have been implicated in cancers and other
genetic diseases, and more are being discovered every
day. A method that can quickly and robustly characterize
specific translocations and produce DNA-based disease-
specific biomarkers will have both diagnostic and prog-
nostic applications. A method that is not dependent on
the growth of cells in culture will bring the power of
cytogenetics to many more cancers.
The incidence of chronic myeloid leukemia (CML) is
1 to 2 per 100,000 and the disease constitutes 15 to 20%
of adult leukemias. CML is characterized by the Ph,
resulting from the t(9;22)(q34;q11) balanced reciprocal
translocation. The translocation generates the BCR-
ABL1 fusion protein with constitutive kinase activity
and oncogenic activity. The breakpoints in the ABL1
gene lie in a 90-kb-long intron 1, upstream of the ABL1
tyrosine kinase domains encoded in exons 2 to 11. The
breakpoints within BCR are mapped to a 5.8-kb area
spanning exons 12 to 16, the major breakpoint cluster
region (M-bcr), found in 90% of patients with CML and
in 20 to 30% of patients with Ph-positive B-cell acute
lymphoblastic leukemia (Ph+ B-ALL) [1-3].
Detection of Ph or BCR-ABL1 transcripts establishes a
diagnosis of CML or Ph+ B-ALL. The majority of CML
patients are in the chronic phase of the disease when they
have their blood tested for diagnosis. Most patients in the
chronic phase are treated for extended periods of time by
inhibitors of BCR-ABL1 tyrosine kinase, such as imatinib
mesylate [4-6]. These patients must be monitored continu-
ously to follow their response to drugs and to ensure that
thediseasedoesnotrecur.Generally, a white blood cell
count is performed as a routine laboratory examination.
A chemical profile also gives important information. How-
ever, cytogenetics is still considered the gold standard for
diagnosing CML and evaluating the response to therapy.
There are two major forms of cytogenetic testing. Karyo-
typing requires condensation of chro mosomes and thus
cells undergoing mitosis. Therefore, karyotyping is usually
done on bone marrow aspirates, with the cells being
cultured for several days to increase their number and to
ensure active cell cycling before arrest in metaphase. The
in vitro cell culture step is essential for kar yotyping.
Another method of cytogenetic testing is fluorescent
in situ hybridization (FISH), which can be applied to non-
dividing cells isolated from peripheral blood. FISH is able
to detect BCR-ABL1 translocation directly with fluores-
cent-labeled DNA probes and allows the detection
of the BCR-ABL1 fusion gene in some cytogenetically
Ph-negative cases with microscopically invisible rearrange-
ments of chromosomes 9 and 22 [7-10]. However, neither
karyotyping nor interphase FISH yields a sensitive and
* Correspondence:
† Contributed equally
Department of Biochemistry and Molecular Genetics, University of Virginia,
School of Medicine, 1300 Jefferson Pk Ave, Charlottesville, VA 22908-0733,
USA
Shibata et al. Genome Medicine 2010, 2:70
/>© 2010 Shibata et al; licensee BioMed Central Ltd. This is an open access article distributed under the terms of the Creative Commons
Attribution License (http://cre ativecommons.org/licenses/by/2.0), which perm its unrestricted use, distribution, and reproduction in
any medium, provided the or iginal work is properly cited.
convenient molecular biomarker that can be used for fol-
low-up of patients during treatment.
Real-time reverse transcription PCR (RT-PCR) is the
most sensitive technique available for the detection of
BCR-ABL1 transcripts and is used to follow the progres-
sion of CML after initial diagnosis and treatment [11].
Although RT-PCR detects BCR-ABL1 transcripts from a
small number of cells, the quality and effic iency of RNA
extraction and/or reverse transcription affect the result.
False negative cases may arise from degradation of the
RNA following the harvesting of patient cells or from
repression of the BCR-ABL1 transcript. In fact, an
important question in the treatment of CML is whether
a negative result in the RT-PCR test means that the
patient is truly free of the disease and can be taken off
imatinib treatment. Mattarucchi et al. [12] reported the
persistence of leukemic DNA even with undetectable
levels of chimeric transcript. Thus, a DNA-based marker
of the translocation will facilitate patient management
by confirming the absence of leukemic DNA. In addi-
tion, genetic heterogeneity is known among patients
with CML and it is unclear whether the chromosomal
translocation breakpoint influences disease progression
because there has not been an easy method to sequence
such breakpoints [13].
Here we introduce a method for detecting and moni-
toring the BCR-ABL1 translocation based on a screen
for the DNA breakpoint. As demonstrated previously,
paired-end tags (PET) technology is a powerful techni-
que to identify unconventional fusion transcripts and
structural variatio ns in the genome [14-18]. Ho wever, a
genome-wide approach to detect the BCR- ABL1 translo-
cation for CML diagnosis is still too costly in both time
and money. Anchored Chro mPET combines three criti-
cal techniques: capture of a targeted region to selec-
tively enrich the region of interest, chromosomal PET
(chromPET) sequencing to interrogate the genomic
locus, and bar-coding to multiplex multiple sampl es
into a single ultra-high-throughput sequencing lane.
Using the M-bcr as a model, we demonstrate the use-
fulness of this technique for obtaining the sequence o f
the BCR-ABL1 DNA translocation junction from multi -
ple samples in a single lane of the Illumina genome
analyzer II (GA-II). The high resolution of breakpoint
identification, production of a patient-specific DNA bio-
marker, and the stability of DNA relat ive to RNA sug-
gest that Anchored ChromPET will be useful for the
detection and follow-up of diseases such as CML that
are caused by specific chromosomal translocations.
Materials and met hods
Reagents
Reagents used were APex Heat-Labile Alkaline Phos-
phatase (Epicentre, Madison, WI, USA; AP49010),
Biotin-16-UTP (Roche, Indianapolis, IN, USA;
11388908910), DNAZol reagent (Invitrogen, Carlsbad,
CA, USA; 10503-027), Dynabeads M-280 streptavidin
(Invitorgen; 112-05D), End-It DNA End Repair Kit
(Epicentre; ER0720), human Cot-1 DNA (Invitrogen;
15279-011), MAXIscript Kit (Ambion, Austin, TX,
USA; AM1312), MinElute Reaction Cleanup Kit (Qia-
gen, Valencia, CA, USA; 28204), pCR4-TOPO-TA vec-
tor (Invitrogen; K4575-01), QIAquick Gel Extraction
Kit (Qiagen; 28704), QIAquick PCR Purification Kit
(Qiagen; 28104), QuickExtrac t FFPE DNA Extraction
Kit (Epicentre; QEF81805), QuickExtract FFPE RNA
Extraction Kit (Epicentre; QFR82805), Quick Ligation
Kit (NEB, Ipswich, MA, USA; M2200S), SuperScript III
Reverse Transcriptase (Invitrogen; 18080-093), TaKaRa
Ex Taq DNA Polymerase (Takara, Otsu, Shiga, Japan;
TAK RR001A), Taq DNA Polymerase (Roche;
11146165001), TRIzol (Invitrogen; 15596-026), and
TURBO DNase (Ambion; AM2238).
Cell lines
K562 cells (CCL-243) and KU812 cells (CRL-2099) were
purchased from ATCC and cultured according to
ATCC instructions.
Patient samples
Genomic DNA from peripheral blood mononuclear cells
were kindly provided by Dr Brian Druker (Oregon Health
and Science Univers ity). Ph+ or Ph- patient samples were
obtained with informed consent and under the approval
of the Oregon Health and Science University Institutional
Review Board. Mononuclear cells were isolated by
separation on a Ficoll gradient (GE Healthcare, Piscat-
away, NJ, USA), followed by purification of genomic
DNA using the Dneasy Blood and Tissue kit (Qiagen).
PCR primers
PCR primers used for this study are in listed in Table S1
in Additional file 1.
ChromPET library construction
All chromPET libraries were constructed according to
the protocol supplied by Illumina with minor modifica-
tions. Genomic DNA was extracted with DNAZol
reagent and 2 μg of DNA was s heared by a Neb ulizer
for 5 minutes by c ompressed air at 32 to 35 psi. After
purifying the sample with a QIAquick PCR purification
kit, fragmented DNA was run in 2.0% agarose gel, and
0.5-kb fragments were excised from the gel and
extracted with a QIAquick Gel Extraction Kit. The ends
of DNA fragments were polished by an End-It DNA
End Repair Kit and A-tail added to the 3’ end by 0.25
units of Taq DNA polymerase. The Y-shaped adapter
containing the bar-code was ligated to both ends of
Shibata et al. Genome Medicine 2010, 2:70
/>Page 2 of 13
DNA fragments by a Quick Ligation Kit and purified
again by 2.0% agarose gel electrophoresis and a
QIAquick Gel Extraction Kit. Y-shaped adapter ligated
DNA was amplified by PCR primer PE1.0 and 2.0 for 15
cycles and the amplified frag ment was again purified by
2.0% agarose gel electrophoresis and a QIAquick Gel
Extraction Kit. The sequences of adapters and primers
are given in Table S1 in Additional file 1.
RNA bait preparation
We amplified 6.6 kb DNA containing the M-Bcr region
from normal lung genomic DNA using PCR primer pair
M-BCR-F1 and R1. Amplified DNA (2 μg) was s heared
in a Nebulizer for 8 minutes by compressed air at 32 to
35 psi to obtain 0.3-kb fragments, overhanging ends
blunted by 2 units of T4 DNA polymerase, the 5’ end
dephosphorylated by 1 μl of APex Heat-Labile Alkaline
Phosphatase, and an A base overhang added to the 3’
end by 0.25 units of Taq DNA polymerase. Following
each step, the sample was cleaned up by a MinElute
Reaction Cleanup Kit. The DNA was cloned into the
pCR4-TOPO-TA vector and the resulting construct
used to transform Escherichia coli competent cells
(TOP10). Plasmid DNA was purified from pooled colo-
nies and inserts were amplified by PCR (M13 forward
and reverse primer). A 100 μl reaction volume was pre-
pared using 10 ng plasmid DNA, 10 μl 10× Ex Taq Buf-
fer (contains 20 mM MgCl
2
), 2.4 μl25mMdNTP
solution, 0.6 μl of 100 μM M13 forward and reverse pri-
mer sets, 5 U TaKaRa Ex Taq DNA Polymerase and dis-
tilled, deionized H
2
O. Repeat-rich DNA (100 ng; human
Cot-1 DNA) was also included in the reaction mixture
to eliminate repetitive sequences by interfering with
extension of the probe across repetitive sequences [19].
The tempe rature-time cycling profile was as follows: 95°
C for 5 minutes followed by 20 cycles of 94°C for 1
minute, 55°C for 20 s and 72°C for 30 s. This was fol-
lowedby5minutesat72°Candaholdat4°Cuntil
tubes were removed. T he DNA was then converted into
RNA bait for selection by in vitro transcription reaction
with Biotin-16-UTP (MAXIscript Kit), following which
the DNA template was eliminated by TURBO DNase.
Anchored ChromPET library preparation
We hybridized 500 ng of biotin-labeled unique single-
stranded RNA from the bait to 500 ng of heat-denatured
chromPET library in 26 μl of hybridization mixture (5×
SSPE, 5× Denhardts’ ,5mMEDTA,0.1%SDS,20U
SUPERase-In), including 2.5 μg of heat-denatured human
Cot-1 DNA and salmon sperm DNA at 65°C for 3 days.
RNA-DNA hybrid was captured on Dynabeads M-280
streptavidin that had been washed three times and resus-
pended in 200 μl of 1 M NaCl, 10 mM Tris-HCl (pH 7.5),
1 mM EDT A and 100 μg/ml salmon sperm DNA. RNA-
DNA hybrid capture beads were washed with 0.5 ml of 1×
SSC/0.1% SDS once for 15 minutes at 20°C and then with
0.5 ml of 0.1× SSC/0.1% SDS for 15 minutes at 65°C three
times. The annealed DNA was eluted by 50 μlof0.1M
NaOH, neutralized by 70 μl of 1 M tris-HCl (pH 7.5) and
converted to double-stranded DNA by paired-end PCR
primer PE1.0 and 2.0. DNA fragments were purified by
2.0% agarose gel electrophoresis and high-throughput
sequencing was performed according to the manufac-
turer’sprotocol(Illumina).
Bioinformatics pipeline
To identify the sample for each individual chromPET in
the multiplexed sequenc ing runs, we used a 4-bp bar-
code that was included in the sample- specific Y-primers
and was appended to the 5’ end of each sequence.
Allowing a 1-bp mismatch (only in degenerate positions)
the chromPET was assigned to one of the samples or
left unassigned. The 38-bp PET reads obtained from the
sequencer were mapped to the targeted regions using
Novocraft Novoalign program (version 2.05) [20]. We
extracted the sequence of the mBCR locus and the
sequence of the ABL1 gene and indexed them using the
Novoindex program (a part of the NovoAlign package).
The mapping was done using default mapping para-
meters (novoalign -rAll- e50). We then used the pipe-
line as described in [14] to identify chromPETs that
have both tags mapping back uniquely to the target
regions. The chromPETs were then classified into nor-
mal chromPETs (mapping BCR-BCR and ABL1-ABL1)
and junctional chromPETs (BCR-ABL1 or ABL1-BCR).
The data discussed in thi s publication have been depos-
ited in NCBI’s Short Read Archive with accession num-
ber [SRA023490.1].
Algorithm for breakpoint prediction
The algorithm for breakpoint detection is based on a
voting procedure. We allow each junctional chromPET
to vote on the location of the actual b reakpoint (Figure
S2 in Additional file 1). First, the normal chromPETs
for all samples are used to estimate the average and
standard deviation of fragment lengths. Using these esti-
mates, each tag of a junctional chromPET votes on the
likely location of the breakpoint: vote of 3 to the interval
that is the average fragment length downstream of the
start of the tag; vote of 2 to the interval one standard
deviation down from the end of the 3 zone; and vote of
1 to the interval another standard deviation downstream
from the 2 zone. All votes are totaled and plotted over
the BCR (or ABL) locus, and the region with the maxi-
mum votes contains the predicted breakpoint. The DNA
primers to amplify the junctional fragment (for sequen-
cing across the junction) are designed to encompass thi s
predicted breakpoint-containing region.
Shibata et al. Genome Medicine 2010, 2:70
/>Page 3 of 13
DNA and RNA extraction
DNA and RNA from freshly prepared cell lines, formalin
fixed cells, and culture medium were extracted with
DNAzol, Trizol, QuickExtract FFPE DNA Extraction
Kit, or QuickExtract FFPE RNA Extraction Kit accord-
ing to the manufacturer’s protocol.
Results
Effective capture of the target regions and sample
multiplexing
The chromPET library was constructed according to the
manufacturer’s protocol with a slight modification. We
used Y-shaped adapters that encoded the bar-code
sequence immediately after the sequencing primer and
before the insert t o be sequenced (Figure 1a). Approxi-
mately 6.6 kb including the M-bcr region was obtained
by PCR from normal lung genomic DNA and converted
into a biotinylated RNA bait as described in the meth-
ods (Figure 1b). The chromPET library was then hybri-
dized to the RNA bait and purified on strept avidin
beads (Figure 1c). We verified that the selection method
successfully enriched DNA annealing to the M-bcr
region by quantitative real time PCR using primers
(M-BCR-F2 and R2) mapping to the 5’ region of the
M-bcr. The patient samples showed 5,800- to 17,000-
fold enrichment of BCR DNA by the selection proce-
dure (Figure S1 in Additional file 1).
Identification of junctional chromPETs
We multiplexed the bar-coded libraries from two leuke-
mia cell lines, K562 and KU812, into one lane and that
from three patient samples, PS1, PS2 and PS3, into
another lane of the Illumina Genome Analyzer. We per-
formed 38 cycles of paired end sequencing using the
protocols provided by the manufacturer.
As shown in Tables 1 and 2, we sequenced 3.2 million
38-bp paired-end reads from the lane with cell lines and
approximately 0.5 million 38-bp paired-end reads from
the lane with patient samples. The sequenced reads
obtained from the Illumina Genome Analyzer were pro-
cessed through the bioinformatics pipeline as shown in
Figure 1d (described in Materials and methods). The
resulting chromPETs from the pipeline were classified
into two categories: chromPETs that map normally to
the BCR or the ABL region; and junctional chromPETs
that map across the junction between BCR and ABL1.
Using the criteria on identification of bar-codes
described in the Materials and methods, the percentage
of chromPETs assigned to each sample was approxi-
mately 5% for the K562 cell line and approximately 45%
for the KU812 cell line. For the patient samples, the per-
centages were 15%, 45% and 6% for PS1, PS2 and PS3,
respectively. The numbers point to a low efficiency of
bar-coding for two of the samples (K562 and PS3), and
more study is needed on how to choose uniformly
efficient barcodes.
Using default mapping parameters (described in the
Materials and methods), we obtained a large but variable
number of chromPETs (Tables 1 and 2) anchored in the
BCR locus (ranging from 21,798 to 403 chromPETs).
However, the variable number of sequences mapping to
the BCR region allowed us to empirically demonstrate
how few sequences were required to use Anchored
ChromPET to identify the chromosomal translocation
breakpoints. Of the BCR-anchored chromPETs, 2 to
4.6% were junctional chromPETs that mapped between
the BCR and ABL loci.
We next devised an algorit hm that utilizes the map-
ping coordinates of each end of a junctional chromPET
together with the distribution of sizes of normal chrom-
PETs to predict the most likely position for the break-
point between the BCR and ABL1 loci (Figure S2 in
Additional file 1; Materials and methods).
Figure S3 in Additional file 1 shows the profile of
breakpoint predictions over the M-bcr and ABL1 loci
for each sample. For the two cell lines and PS1 and PS2,
we have well-defined peaks in the breakpoint profile in
both the M-bcr and ABL1 loci. The locations of these
peaks are considered the predicted breakpoints. In con-
trast, for PS3 the breakpoint predictions are dispersed
and do not yield a single peak. The genome coordinates
of the predicted breakpoints are shown in Table 3.
Prediction and validation of translocation breakpoints in
CML cell lines
The bioinformatics prediction of breakpoints i n K562
cells (Table 3 and Figure 2a) agreed well with the break-
point reported in the literature [21]. To reconfirm this
breakpoint, we designed primers flanking these sites and
could amplify the junctional fragment from K562 geno-
mic DNA but not from normal lung g enomic DNA
(Figure 3a). The sequence of the amplified pro duct
(Figure 3b) confirmed the reported breakpoint and our
bioinformatics prediction.
In a similar fashion we predicted the BCR-ABL1 junc-
tion in KU812 cells (Figure 2a) and confirmed the pre-
diction by amplifying the junctional fragment and
sequencing (Figure 3b). Again, our predi cted and
observedbreakpointagreedwiththatreportedinthe
literature [21]. We also identified the ABL1-BCR reci-
procal translocation in KU812 cells: sequence tags
mapped to chr9:133,642,604-133,643,072 in the ABL1
gene were linked to chr2 2:23,632 ,613-23, 633,084 in the
M-bcr (Figure 2a). Again, the predicted ABL1-BCR junc-
tion was confirmed experimentally and found to match
exactly with the observed junction (Figure 3b). These
Shibata et al. Genome Medicine 2010, 2:70
/>Page 4 of 13
data suggest that Anchored ChromPET is capable of
identifying gene rearrangements in a targeted region of
the genome.
Prediction and validation of translocation breakpoints in
patient samples
We next examined the ability of Anchored ChromPET
to identify aberrant translocations in patient samples.
To this end, we tested this approach on DNA from
blasts in blood samples from Ph+ patients 1 and 2. As
anegativecontrol,wealsotestedthistechniquein
Ph- patient 3. The predicted breakpoints for PS1 and
PS2 are reported in Table 3 and Figure 2b.
Based on these results, we designed primer sets,
amplified the junctio nal fragments and confirmed the
BCR-ABL1 and ABL1-BCR translocations in both these
patients. As shown in Figure 4a, predicted junctional
fragments were re producibly amplified from the geno-
mic DNA of patients’ blast cells but not from normal
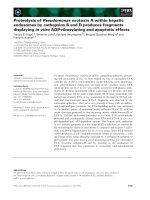
Figure 1 Outline of Anchored Chr omPET method. Details are in Materials and methods. (a) Y-primers containing the sequencing primer and
the bar code (1, 2 or 3) ligated to sized genomic fragments. (b) RNA bait for anchoring the targeted region prepared by cloning the fragments
in a TOPO-TA vector and in vitro transcription. (c) Y-primed library is selected on the RNA bait, eluted and amplified with paired-end primers to
create the bar-coded libraries for paired-end sequencing. (d) Bioinformatics pipeline with sequence data.
Table 1 Sequencing and mapping numbers for cell lines
out of 3,249,760 total reads
Cell line
K562 KU812
Barcoded reads 161,365 1,468,876
Mapped
First tag 24,385 243,684
Second tag 25,310 246,861
Percent mapped
First tag 15% 17%
Second tag 16% 17%
Mapped uniquely
First tag 12,800 125,795
Second tag 13,321 122,665
Total anchored chromPETs 2,839 21,798
Junctional chromPETs 131 427
Percent breakpoint 4.6% 2.0%
The number of chromPETs sequenced, mapped, anchored to BCR and that
were junctional for each cell line.
Shibata et al. Genome Medicine 2010, 2:70
/>Page 5 of 13
lung genomic DNA. Sequencing data for amplified frag-
ments clearly showed the BCR-ABL1 or ABL1-BCR
junctions in each of these patients (Figure 4b).
A few M-bcr-anchored chromPETs were also linked to
the ABL1 locus in patient 3, but the predicted break-
points were dispersed and a unique breakpoint was not
predicted using our algorithm. Indeed, PCR with primers
spanning the sites that had even the minor peaks (Figure
S3C,D in Additional file 1) did not amplify any junctional
fragments from the blast cells from patient 3. This
suggests that the junctional chromPETs detected were
probably due to contamination with PS1 or PS2 DNA
during Anchored ChromPET library construct ion. A ret-
rospective analysis of our protocol indicates that two dis-
pensable steps, both involving gel electrophoresis for size
selecting the chromPET library, are the most likely
source for this contamination because all three patient
libraries were processed simultaneously on the same gel.
Of course, we cannot completely exclude the possibility
of an atypical BCR-ABL translocation in patient 3
because the region we have tested i s only the 6.6-kb
M-bcr. In the future we will expand our anchored area to
include the entire BCR gene to definitively eliminate the
possibility of a BCR-ABL translocation.
Comparison of sensitivity: DNA or RNA
Because a clinical sample is not uniformly composed of
malignant cells, we next evaluated the sensitivity of
detection of the DNA-based biomarkers identified by
Anchored ChromPET. A dilution series of K562 cells
was created by combining them with HCT116 colon
cancer cells without the BCR-ABL1 translocation. As
shown in Figure 5a, we detected the BCR-ABL1 junc-
tional DNA in 100 ng total DNA even when only
0.01% of the cells carried the BCR-ABL1 gene and this
sensitivity is equivalent to the det ection of the fusion
transcript in 100 ng RNA by RT-PCR. The sensitivity
of the RNA-based RT-PCR methods for detecting
BCR-ABL1 transcripts is similar to that reported in the
literature [22].
The most important benefit of Anchored ChromPET
is the precise identification of the breakpoints on DNA,
Table 2 Sequencing and mapping numbers for patient samples out of 592,785 total reads
Cell line
Patient sample 1 Patient sample 2 Patient sample 3
Barcoded reads 89,316 258,239 37,538
Mapped
First tag 8,952 30,586 3,782
Second tag 8,861 32,275 3,966
Percent mapped
First tag 10.0% 11.8% 10.1%
Second tag 9.9% 12.5% 10.6%
Mapped uniquely
First tag 4,824 16,456 2,186
Second tag 4,828 17,248 2,232
Total anchored chromPETs 994 3,753 403
Junctional chromPETs 23 92 10
Percent breakpoint 2.3% 2.5% 2.5%
Number of chromPETs sequenced, mapped, anchored to BCR and junctional for each sample for patient samples.
Table 3 Predicted and actual breakpoints from each sample
Prediction Break point Actual Difference (bp)
Sample M-BCR ABL1 M-BCR ABL1 M-BCR ABL1
K562 110,194-110,207 27,762-27,909 BCR-ABL1 110,191-110,192 27,878-27,879 3 0
KU812 110,241-110,242 63,843-63,853 BCR-ABL1 110,299-110,300 63,929-63,930 57 76
ABL1-BCR 110,096-110,097 63,804-63,805 144 38
Patient 1 109,790-109,830 125,280-125,623 BCR-ABL1 109,781-109,782 125,326-125,327 8 0
ABL1-BCR 109,670-109,671 149,445-149,446 119
a
23,822
Patient 2 109,702-109,867 102,484-102,653 BCR-ABL1 109,834-109,835 102,524-102,525 0 0
ABL1-BCR 109,869-109,870 102,526-102,527 2 0
Predicted and actual breakpoints for each sample. The absolute difference (in base pairs) between predicted breakpoint site and sequenced breakpoint site is
shown in the last two columns. All M-bcr coordinates are relative to chr22:23,522,552 (start position of BCR gene). All ABL1 coordinates are relative to
chr9:133,586,268 (start position of ABL1 gene).
a
We had a secondary peak at this locus in the patient 1 ABL1 breakpoint profile (Figure S3D in Additional file 1).
Shibata et al. Genome Medicine 2010, 2:70
/>Page 6 of 13
which allows for optimal design o f PCR primers for a
DNA-based biomarker of the translocation junction. It
is well known that RNA is less stable than DNA because
the 2’-OH group of a ribonucleotide is more reactive
than the 2’-H of a deoxyribonucleotide, causing RNA to
break more easily, and because RNAses are present on
body surfaces and in body fluids. Formalin-fixed, paraf-
fin-embedded (FFPE) tissue is one of the most com-
monly archived forms for clinical samples. DNA and
RNA from FFPE samples are highly fragmented and, in
general, the recovery efficiency of DNA is better than
that of RNA. Therefore, we evaluated the sensitivity of
detection of DNA- or RNA-based junctional biomarkers
in samples extracted from formalin-fixed cells. After
extraction of DNA or RNA from 10,000 cells, we mea-
sured the yield of D NA or RNA junctions by quantita-
tive real-time PCR and normalized the result to the
yield from 1,000 fresh cells. As shown in Figure 5b, five-
fold more DNA biomarker than RNA biomarker was
detected from formalin-fixed cells.
Finally, as cells die they release their DNA and RNA
into the body fluids and the ideal biomarker will be
stable in serum at body temp erature. We therefore mea-
sured the amount of DNA or RNA biomarkers that
survive in serum-containing cell culture medium at 37°C
following the growth of K562 cells (Figure 5c). After fil-
tration of medium to remove cells, we isolated DNA or
RNA from 100 μl of medium and measured the amount
of junctional biomarker as above. Junctional DNA was
detected nearly 10,000 times more efficiently than junc-
tional RNA (Figure 5c), stro ngly suggesting that the
DNA biomarkers identified by Anchored ChromPET
will be of great utility for detection of the cancer-
derived aberrant DNA in body fluids.
Discussion
Advantages of Anchored ChromPET
Anchored ChromPET makes it possible to dete ct gene
rearrangement s in a targeted region in a short time and
provides a personalized DNA-based biomarker for
following a patient’s disease. This technique has the
advantages of both karyotyping and RT-PCR. Twenty-
five to 30 metaphase cells are usually examined during
karyotyping so that the sensitivity of detecting a
Ph-positive cell is 3 to 4%. Interphase FISH can be
applied to nondividing cells isolated from peripheral
blood to detect the juxtaposition of BCR and ABL
signals created by a translocation. In this case, about
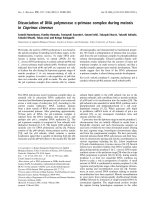
Figure 2 Predicted junctions between chromosomes 9 and 22. (a, b) Only the BCR-ABL translocat ion was detected in K562, but bot h BCR-
ABL1 and ABL1-BCR translocations were detected in the KU812 cells and two patient samples. Details of the junctions are in Figure S4 in
Additional file 1.
Shibata et al. Genome Medicine 2010, 2:70
/>Page 7 of 13
200 to 500 nuclei are studied, giving a sensitivity of
detection of 0.2 to 0.5%. However, the percentage of
BCR-ABL1-positive cells in peripheral blood is lower
than that in bone marrow, and the protei n digestion
step necessary to remove chromatin proteins before
FISH affects the signals, making them difficult to inter-
pret. As shown in Table 2, we identified 23 junctional
chromPETs from 89,316 reads in PS1, giving an appar-
ent sensitivity of 0.03% for the primary detection of a
BCR-ABL fusion.
We also evaluated the sensitivity of detection of the
PCR product spanning the c hromosome junction f or
molecular follow-up of the disease (Figure 5a). The sen-
sitivity of detection of the DNA junction is at least
0.01%andisalmostequivalenttothatofdetectingthe
RNA fusion. Whereas RNA degradation during sample
preparation and silencing of BCR-ABL1 affect the sensi-
tivity of detection of the fusion RNA [12], the DNA
junction is relatively free from these problems.
With G banding, approximately 400 to 800 bands per
haploid set can be detected by a trained cytogeneticist.
The haploid human genome occupies about 3 × 10
9
bp.
Thus, the resolution of karyotyping is 5 Mb and the
resolution of interphase FISH is 50 to 100 kb. The reso-
lution of RT-PCR for detecting fusion transcripts is not
comparable to that obtained here because the chimeric
RNA merely indicates the two exons that are fused
to each other, with the DNA breakpoints localized
anywhere within the adjoining introns. In comparison,
we identify the exact DNA junction at the base-pair
level by Anchored ChromPET, suggesting that the
sequencing-based approach gives the best resolution of
the DNA junction.
Anchored ChromPET therefore provides a high-
resolution digital karyotype with better sensitivity than
comparable methods for detecting the DNA transloca-
tion. Note that there is no detectable signal saturation
and so the sequencing step can be scaled up by sequen-
cing more DNA to sample even rarer DNA fusion
events. About 5 to 10% of CML patients are Ph-negative
by karyotyping, but the BCR- ABL1 transcript is detect-
able by RT-PCR in half of these cases. In some cases
the ABL1 gene is inserted in the BCR locus and results
in the BCR-ABL1 fusion in a cytogenetically normal
chromosome 22 and vice versa [23]. Thus, a significant
advantage to DNA sequencing is that we can identify
the specific base-pair location of even these chromo-
some rearrangements. While there is no doubt that
CML is caused by the expression of the BC R-ABL1
fusion transcript, genetic heterogenity of the fusion
junction might influence disease progression [13].
Therefore, by giving higher re solution information on
the breakpoint compared to an RNA-based method like
RT-PCR, Anchored ChromPET may be more useful for
future studies correlating the DNA breakpoint with
disease progression.
Nondividing cells isolated from peripher al blood,
which cannot be used for karyotyping, can be used for
Anchored ChromPET. There are reports in the litera-
ture of successful isolation of 0.5- to 1-kb DNA frag-
ments from blood smears and formalin fixed paraffin
embedded tissue. Therefore, Anchored ChromPET and
subsequent PCR detection of junctional DNA can be
especially useful for retrospective analysis of patient
material for both identificatio n of the translocation and
detection of minimal residual disease.
How do we expect this technology to be used in the
diagnosis and management of new cases of CML? Most
patients present in the chronic phase of CML, character-
ized by leukocytosis with the presence of p recursor cells
K562
KU812
normal
KU812
KU812
normal
normal
100 bp ladder
BCR-ABL1 ABL1-BCR
(a)
GGAGTGTTTGTGCTGGTTGATGCCTTCTGGGTGTGGAATTGTTTTTCCCGGAGTGGCCTC
TGCCCTCTCCCCTAGCCTGTCTCAGATCCTGGGAGCTGGTGAGCTGCCCCCTGCTTAAAC
AGAAATGGCCACCTGCATTTGAGAAAATAAAGTTTCATGCAGAAGAAAGTGACATGTTAA
BCR-ABL1 junction in KU812
chr22:23,632,850 - chr9:133,643,198
ATTACAGGCAGGAGCCACTGTGCCCGGCCTGACCTCATATTTGAATACCGAGTTTTAGTT
CTGGAGGAGCTGCAGGTTTTATTTGGGGAGGAGGGTTGCAGCGGCCGAGCCAGGGTCTCC
ACCCAGGAAGGACTAATCGGGCAGGGTGTGGGGAAACAGGGAGGTTGTTCAGATGACCAC
ABL1-BCR junction in KU812
chr9:133,643,072 - chr22:23,632,613
GCAGCGGCCGAGCCAGGGTCTCCACCCAGGAAGGACTCATCGGGCAGGGTGTGGGGAAAC
AGGGAGGTTGTTCAGATGACCACGGGACACCTTTGACCCTGGCCGCTGTGGAGTGGGTTT
TATCAGCTTCCATACCCAAACAGAAATACCCTTAAGGATTTTCTTCTCTGATTGCACTAA
BCR-ABL1 junction in K562
chr22:23,632,742 - chr9:133,607,147
(b)
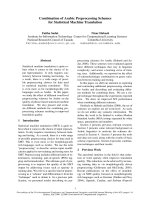
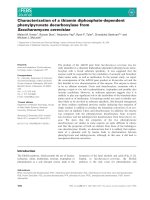
Figure 3 Validation of predicted breakpoints in cell lines by
PCR and Sanger sequencing. (a) Confirmation of chromosome
rearrangements by PCR. A primer pair (K562DF1 and R1) yielded a
junctional DNA fragment using genomic DNA from K562 (lane 2)
but not from normal lung tissues (lane 4). This primer set failed to
amplify a DNA fragment using genomic DNA from KU812. PCR
primer sets (KU812DF1, R1 and DF2, R2) amplified junctional DNA
fragments using genomic DNA prepared from KU812 (lanes 5 and
7) but not from normal lung tissues (lanes 6 and 8). (b) Each PCR
amplified junctional DNA fragment was cloned into a plasmid
vector and Sanger sequencing performed. Solid lines enclose the
BCR region and broken lines enclose the ABL1 region. In K562, a
microhomology (GAGTG) exists on the BCR and ABL1 sides of the
breakpoint, so we assume that the ligation point was somewhere in
this GAGTG sequence.
Shibata et al. Genome Medicine 2010, 2:70
/>Page 8 of 13
of the myeloid lineage. There are normally between
4×10
9
and 1.1 × 10
10
white blood cells in a liter of
bloo d, but this number is significantly increased, with up
to 10% blast cells and promyelocytes in the blood in
chronicphaseCML.InacutephaseCMLmorethan70
to 80% of white blood cells in the peripheral blood can
be blasts. RT-PCR seems to be the easiest and most sen-
sitive molecular method for detection of the BCR-ABL
transcript in both these situations. Despite this, karyotyp-
ing of the bone marrow (or at least interphase FISH of
peripheral blood) to detect the fusion at the DNA level is
considered the gold standard for diagnosis. We propose
Anchored ChromPET as an alternative for detecting the
DNA fusion. One milliliter of blood is enough to con-
struct a chromPET library for the identification of the
breakpoint, and once a breakpoint is identified PCR will
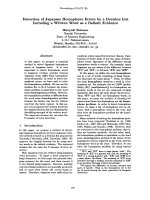
Figure 4 Validation of predicted breakpoints in patient samples by PCR and Sanger sequencing. (a) Amplified junctional DNA fragments
using CML DNA from patients 1, 2, or 3 as template. PCR with primer sets (PhS1F9, R9 and PhS1F2.2, R2.2) successfully amplified a DNA
fragment from patient 1 DNA (lanes 2 and 4) but not from patient 3 (lanes 10 and 11). Primer sets (PhS2F1.1, R1.2 and PhS2F2.2, R2.2) gave a
product from patient 2 DNA (lanes 6 and 8). The junctional DNA fragment was not detected using genomic DNA from normal lung tissue (lanes
3, 5, 7, and 9). Asterisks indicate unique fragments observed in patients’ samples. (b) Each PCR-amplified DNA fragment was cloned into a
plasmid vector and sequenced. Solid lines enclose the BCR region and broken lines enclose the ABL1 region.
Shibata et al. Genome Medicine 2010, 2:70
/>Page 9 of 13
be able to detect gene rearrangements with the same
volume of blood. The whole 135 kb of the BCR gene can
be used as bait, and the resulting 21-fold in crease in
sequencing is still well within the capability of one-tenth
of a lane of a Solexa sequencer, which yields 10 to 20 mil-
lion reads per lane. An alternative strategy is to use the
results of the RT-PCR to define exactly which exon of
BCR flanks the DNA fusion, and then design a smaller
bait that will capture the adjoining intron and junctional
DNA fragments to sequence the DNA breakpoint.
A major advantage of Anchored ChromPET is that we
do not have to grow the cells in culture and so the
method is expected to find wide application in searching
for specific translocations for solid cancers where it is
difficult to grow all the cancer cells in culture. In addi-
tion, since the sensitivity of the method can be increased
by sequencing more DNA fragments, we expect it to
reliably detect translocations carried by even a small
fraction of the cells in a sample. Finally, for transloca-
tions (unlike BCR-ABL) where methods have not been
standardized to detect the various alternative fusion
transcripts by RT-PCR, Anchored ChromPET can
become the method of choice for detecting the DNA
fusion that defines the translocation.
Only future experiments will define whether the DNA
fusion or the RNA fusion will be the better marker for
Figure 5 Sensitivity of detection of DNA junctional fragment. (a) All six samples contained 1 × 1 0
6
cells each, but with a ten-fold serial
dilution of K562 cells mixed with an appropriate number of HCT116 cells. The numbers of K562 were 10
6
(no dilution), 10
5
(1:10), 10
4
(1:100),
10
3
(1:1,000), 10
2
(1:10,000) and 0. Total genomic DNA (100 ng) was used as a template for RT-PCR using PCR primer set K562DF3 and R3. The
quantitative PCR signal was normalized to PCR product from the PCNA locus. Simultaneously, we isolated total RNA with TRIzol. cDNA reverse
transcribed by SuperScript III from 100 ng of total RNA was used as a template for RT-PCR. (b) Genomic DNA and RNA were extracted from 10
6
formalin fixed KU812 cells. RT-PCR (primer sets KU812DF3, R3 and BCRe13F1, ABL1a2R1) was performed using DNA or cDNA from 10
4
cells and
normalized to DNA or cDNA from 10
3
freshly prepared cells. (c) DNA and RNA were prepared from KU812 cell culture medium. DNA or cDNA
from 100 μl medium was used for the assay and normalized as above.
Shibata et al. Genome Medicine 2010, 2:70
/>Page 10 of 13
minimal residual diseases or early recurrence. However,
since the detection of the DNA fusion does not need
reverse transcription and is not as susceptible to the fac-
torsthatdegradeRNA,weanticipatethattheDNA
fusion fragment may be a more sensitive biomarker
than the RNA fusion fragment. We c ould easily detect
the DNA junctional fragment in filtered cell culture
medium,suggestingthatDNAderivedfromdeadcells
survives in serum at 37°C for an extended period of
time. In contrast, it is hard to detect the RNA fusion
transcript in the same cell culture med ium. This o bser-
vation suggests that another potential advantage of
using the DNA junctional fragment as a biomarker is
that it may survive as free nucleic acid in body fluids
like blood or even urine. This, again, is something that
we are interested in testing in the future.
The decrease in sequencing achieved by anchoring, by
sampling only the ends of the fragments and by multi-
plexing multiple s amples in the same lane of a sequen-
cer brings the costs of seque ncing down considerably.
In our estimate, considering the current state of sequen-
cing capabilities and the small number of sequences
necessary to identify the breakpoint, we can reliably
multiplex up to ten samples in a single lane of the Illu-
mina sequencer, making the sequencing costs much
lower than those for whole genome sequencing for iden-
tifying cancer-specific recombination biomarkers.
Computational prediction of breakpoint
Table 3 shows the coordinat es of the predicted break-
points, the coordinates of the sequenced breakpoints
and the difference (in base pairs) between them. For the
BCR breakpoint in patient 2 cells and ABL1 breakpoints
in the K562 cell line and patients 1 and 2, the predic-
tions turned out to match exactly to the sequenced
breakpoint. Even in other cases, the maximum differ-
ence is only 144 bp. In the BCR-ABL1 fusion in patient
1, a >20-kb deletion in the ABL1 lo cus (Figure S4 in
Additional file 1) produced two discrete breakpoint pre-
dictions in the ABL1 locus (Figure S3 D in Additional
file 1) with one corresponding to the BCR-ABL1 fusion
and the other to the ABL1-BCR fusion.
These results de monstrate that the predictions from
our algorithm match reasonably well to the breakpoints
verified by experimental methods. Our results also sug-
gest that breakpoints could be predicted using even a
small number of junctional chromPETs (K562 and PS1).
However, we could not predict a consensus breakpoint
from PS3 and could not identify a junctional fragment
from this DNA using PCR. So even though junctional
chromPETs were assigned to patient 3, these are most
likely the result of contamination during chromPET
library construction. The fact that the contamination
did not lead to a false positive call points to the robust-
ness of the approach.
Other methods for sequencing the DNA translocation
junction
Ligation of a special adapter to the ends of genomic
DNA fragments, PCR c ycles beginning with an exon of
BCR, and nested PCR starting with the adapter have
been used sequentially to clone and sequence several
BCR- ABL junctions [24]. In another approach, six for-
ward primers were used to cover 3 kb of the M-bcr and
302 reverse primers were used to cover 150 kb of the
ABL gene so that PCR could be used to identify poten-
tial junctions with clever adaptations in order to remove
non-specific PCR products [25]. Both these methods,
however, can only be used when we know that the
breakpoint is close (within a distance suitable for PCR)
to a limited part of the BCR gene. In comparison,
Anchored ChromPET was used in this paper to identify
a breakpoint anywhere in the 6 kb M-Bcr region and
can be readily scaled up to screen for breakpoints in the
entire 135 kb BCR gene. The breakpoint on the other
side can be anywhere in the ABL gene (or for that mat-
ter, anywhere else in the genome). Furthermore, as
demonstrated here, the method often yields the rec ipro-
cal ABL-BCR junction.
RNA bait preparation
Well-de signed RNA baits useful for the cap ture of DNA
fragments can be commercially synthesized [26]. How-
ever, such baits are very expensive, and will be even
more expensive if larger parts of the genome need to be
anchored. For example, in this pa per we used the 6.6 kb
region containing M-bcr in chro mosome 22q11 as the
anchoring DNA, because >90% of CML BCR break-
points are in this region. However, breakpoints in the
minor breakpoint cluster region (m-bcr) are seen in
ALLs, and are distributed over a 90-kb region in intron
1oftheBCR gene. The different method of bait pre-
paration described in this paper is cost-efficient and can
be scaled up to cover the whole 135-kb BCR gene,
which will allow us to identify rare breakpoints in the
m-bcr or micro-bcr regions and also to definitively rule
out translocations anywhere in the BCR gene.
Translocation junctions
Detection of both reciprocal translocations in KU812 and
two patient samples allowed us to analyze what happens
to the ends of the chromosomes after the break that initi-
ates the translocation. Some DNA sequence is lost at the
ABL1 locus in all samples and at the BCR1 locus in
patient 2, most likely due to exonuclease activity before
ligation (Figure S4 in Additional file 1).
Shibata et al. Genome Medicine 2010, 2:70
/>Page 11 of 13
In contrast, in KU812 cells and patient 1, some of the
DNA at the BCR locus seems to be d uplicated, so that
the BCR breakpoint in the BCR -ABL fusion is down-
stream of the BCR breakpoint in the ABL-BCR fusion
(Figures S3, S4 a nd S5A in Additional file 1). This kind
of duplication is often observed in balanced chromo-
some rearrangements [27]. DNA mfold [28] predicts
that the DNA around the BCR breakpoints in KU812
forms a stem-loop structure with a Gibbs free energy
(dG) of -88.96 kcal/mol (Figure S5B in Additional file
1). Hairpin- or cruciform-like DNA structures are
strongly associated with genomic instability by their
interference with DNA replication in both prokaryotes
and eukaryotes. It is hypothesized that formation of a
stable secondary DNA structure in this region is respon-
sible for the breakpoint in M-bcr [29-31]. If the cruci-
form breaks at different points on the two strands of
BCR, the r esulting 3’ overhang on each strand could be
blunted by continued polymerase action (Figure 5c),
leading to the duplication of DNA from the BCR locus.
Such a cruciform structure, however, was not detected
around the duplicated region in patient 1, so this may
not be the only mechanism for the duplication.
Conclusions
The detection of the BCR-ABL1 fusion gene is critical
for the diagnosis of chronic myeloid leukemia and for
following the progress of patients after ther apy.
Currently, karyotyping or inter phase FISH is considered
the gold standa rd for diagnosis of specific chromosomal
translocations. Compared to these meth ods, paired-end
sequencing is highly sensitive for detecting c hromoso-
mal translocations, has high resolution, and lends itself
to high throughput automation. However, genome-wide
sequencing to detect BCR-ABL1 translocation is too
expensive. Therefore, we made genomic DNA libraries
with adapters including bar codes and captured the
maj or break cluster region in the BCR gene from whole
genomic DNA. By paired-end sequencing of such
captured libraries we can identify the exact breakpoints
in the BC R and ABL1 genes in two cell lines and two
CML patients. We also show that detection of the DNA
junctional fragment is comparable in sensitivity to the
detection of the RNA fusion transcript by RT-PCR if
the RNA is harvested and stored under carefully con-
trolled laboratory conditions. Under non-ideal condi-
tions, such as from formalin-fixed cells or from cell-free
nucleic acids in serum, the DNA junctional fragment is
more stable and is detected at higher sensitivity. This
Anchored ChromPET approach is an efficient method
for detecting BCR-ABL1 and potentially useful for many
other chromosomal translocations currently identified
by cytogenetics. It has the added advantage of providing
a DNA-based biomarker for the translocation that can
be used for follow-up of the patient.
Additional material
Additional file 1: Figures S1 to S5 and Table S1. Figure S1: evaluation
of capture efficiencies by quantitative RT-PCR. The fold enrichment of the
M-bcr in the libraries prepared from each patient’s DNA. Figure S2: a
depiction of the algorithm for breakpoint prediction. The schematic
illustrates the voting-procedure-based algorithm for breakpoint detection.
Figure S3: predicted and actual breakpoints. The UCSC genome browser
snapshots from the cell lines and patient samples for the M-bcr locus
and ABL1 locus. Figure S4: reciprocal translocation breakpoints. The
schematic illustrates the duplication or deletion observed in the BCR and
ABL1 breakpoint. Figure S5A: duplicated sequence observed in M-bcr in
KU812, showing the 3’ end sequence of the breakpoint in the BCR-ABL1
fusion gene and the 5’ end sequence of the breakpoint in the ABL1-BCR
fusion gene. Figure S5B: secondary DNA structure of the sequence that
was duplicated in KU812 cells. The MFold-predicted secondary structures
of the 638-bp-long sequence, including the duplicated sequence in
KU812 cells. Figure S5C: a model for the hairpin-mediated replication fork
stalling, asymmetric break on the two strands and sequence duplication.
The schematic model of the mechanism of sequence duplication
observed in the BCR- ABL1 breakpoint. Table S1: PCR primers used in this
study.
Abbreviations
B-ALL: B-cell acute lymphoblastic leukemia; BP: base pair; CHROMPET:
chromosomal paired end tag; CML: chronic myeloid leukemia; FFPE:
formalin-fixed: paraffin-embedded; FISH: fluorescent in situ hybridization; M-
BCR: major breakpoint cluster region; PET: paired-end tag; PH: Philadelphia
chromosome; PS: patient sample; RT-PCR: real-time reverse transcription PCR.
Acknowledgements
We are grateful to Dr Brian Druker at Oregon Health and Science University
for providing us with genomic DNA from peripheral blood mononuclear
cells from three patients with CML. We thank members of the Dutta Lab
and Dr Amir Jazaeri for helpful suggestions and Dr Michael Douvas for
reading the manuscript. This work was supported by R01 CA60499 and
CA89406.
Authors’ contributions
All authors contributed to the conception of this project. YS developed
Anchored ChromPET library preparations and validated predicted regions by
PCR. AM designed a strategy of data analysis. AD devised and supervised
the project. All authors contributed to the drafting of the manuscript.
Competing interests
AD in partnership with the University of Virginia has founded a company to
commercialize this technology.
Received: 26 April 2010 Revised: 9 June 2010
Accepted: 22 September 2010 Published: 22 September 2010
References
1. Sessions J: Chronic myeloid leukemia in 2007. Am J Health Syst Pharm
2007, 64:S4-9.
2. Quintas-Cardama A, Cortes J: Molecular biology of bcr-abl1-positive
chronic myeloid leukemia. Blood 2009, 113:1619-1630.
3. Wong S, Witte ON: The BCR-ABL story: bench to bedside and back. Annu
Rev Immunol 2004, 22:247-306.
4. Druker BJ: Translation of the Philadelphia chromosome into therapy for
CML. Blood 2008, 112:4808-4817.
5. Goldman JM, Melo JV: BCR-ABL in chronic myelogenous leukemia - how
does it work? Acta Haematol 2008, 119:212-217.
Shibata et al. Genome Medicine 2010, 2:70
/>Page 12 of 13
6. Hughes T, Deininger M, Hochhaus A, Branford S, Radich J, Kaeda J,
Baccarani M, Cortes J, Cross NC, Druker BJ, Gabert J, Grimwade D,
Hehlmann R, Kamel-Reid S, Lipton JH, Longtine J, Martinelli G, Saglio G,
Soverini S, Stock W, Goldman JM: Monitoring CML patients responding to
treatment with tyrosine kinase inhibitors: review and recommendations
for harmonizing current methodology for detecting BCR-ABL transcripts
and kinase domain mutations and for expressing results. Blood 2006,
108:28-37.
7. Costa D, Espinet B, Queralt R, Carrio A, Sole F, Colomer D, Cervantes F,
Hernandez JA, Besses C, Campo E: Chimeric BCR/ABL gene detected by
fluorescence in situ hybridization in three new cases of Philadelphia
chromosome-negative chronic myelocytic leukemia. Cancer Genet
Cytogenet 2003, 141:114-119.
8. Fugazza G, Garuti A, Marchelli S, Miglino M, Bruzzone R, Gatti AM,
Castello S, Sessarego M: Masked Philadelphia chromosome due to
atypical BCR/ABL localization on the 9q34 band and duplication of the
der(9) in a case of chronic myelogenous leukemia. Cancer Genet
Cytogenet 2005, 163:173-175.
9. Mark HF, Sokolic RA, Mark Y: Conventional cytogenetics and FISH in the
detection of BCR/ABL fusion in chronic myeloid leukemia (CML). Exp Mol
Pathol 2006, 81:1-7.
10. Virgili A, Brazma D, Reid AG, Howard-Reeves J, Valganon M, Chanalaris A,
De Melo VA, Marin D, Apperley JF, Grace C, Nacheva EP: FISH mapping of
Philadelphia negative BCR/ABL1 positive CML. Mol Cytogenet 2008, 1:14.
11. Foroni L, Gerrard G, Nna E, Khorashad JS, Stevens D, Swale B, Milojkovic D,
Reid A, Goldman J, Marin D: Technical aspects and clinical applications of
measuring BCR-ABL1 transcripts number in chronic myeloid leukemia.
Am J Hematol 2009, 84:517-522.
12. Mattarucchi E, Spinelli O, Rambaldi A, Pasquali F, Lo Curto F, Campiotti L,
Porta G: Molecular monitoring of residual disease in chronic myeloid
leukemia by genomic DNA compared with conventional mRNA analysis.
J Mol Diagn 2009, 11:482-487.
13. Sinclair PB, Nacheva EP, Leversha M, Telford N, Chang J, Reid A, Bench A,
Champion K, Huntly B, Green AR: Large deletions at the t(9;22) breakpoint
are common and may identify a poor-prognosis subgroup of patients
with chronic myeloid leukemia. Blood 2000, 95:738-743.
14. Shibata Y, Malhotra A, Bekiranov S, Dutta A: Yeast genome analysis
identifies chromosomal translocation, gene conversion events and
several sites of Ty element insertion. Nucleic Acids Res 2009, 37:6454-6465.
15. Stephens PJ, McBride DJ, Lin ML, Varela I, Pleasance ED, Simpson JT,
Stebbings LA, Leroy C, Edkins S, Mudie LJ, Greenman CD, Jia M, Latimer C,
Teague JW, Lau KW, Burton J, Quail MA, Swerdlow H, Churcher C,
Natrajan R, Sieuwerts AM, Martens JW, Silver DP, Langerod A, Russnes HE,
Foekens JA, Reis-Filho JS, van ‘t Veer L, Richardson AL, Borresen-Dale AL,
et al: Complex landscapes of somatic rearrangement in human breast
cancer genomes. Nature 2009, 462:1005-1010.
16. Maher CA, Palanisamy N, Brenner JC, Cao X, Kalyana-Sundaram S, Luo S,
Khrebtukova I, Barrette TR, Grasso C, Yu J, Lonigro RJ, Schroth G, Kumar-
Sinha C, Chinnaiyan AM: Chimeric transcript discovery by paired-end
transcriptome sequencing. Proc Natl Acad Sci USA 2009, 106:12353-12358.
17. Fullwood MJ, Wei CL, Liu ET, Ruan Y: Next-generation DNA sequencing of
paired-end tags (PET) for transcriptome and genome analyses. Genome
Res 2009, 19:521-532.
18. Ng P, Wei CL, Ruan Y: Paired-end diTagging for transcriptome and
genome analysis. Curr Protoc Mol Biol 2007, Chapter 21:Unit 21.12.
19. Dugan LC, Pattee MS, Williams J, Eklund M, Sorensen K, Bedford JS,
Christian AT: Polymerase chain reaction-based suppression of repetitive
sequences in whole chromosome painting probes for FISH. Chromosome
Res 2005, 13:27-32.
20. Novocraft.com. [].
21. Ross DM, Schafranek L, Hughes TP, Nicola M, Branford S, Score J: Genomic
translocation breakpoint sequences are conserved in BCR-ABL1 cell lines
despite the presence of amplification. Cancer Genet Cytogenet 2009,
189:138-139.
22. Zhang JG, Lin F, Chase A, Goldman JM, Cross NC: Comparison of genomic
DNA and cDNA for detection of residual disease after treatment of
chronic myeloid leukemia with allogeneic bone marrow transplantation.
Blood 1996, 87:2588-2593.
23. Nacheva E, Holloway T, Brown K, Bloxham D, Green AR: Philadelphia-
negative chronic myeloid leukaemia: detection by FISH of BCR-ABL
fusion gene localized either to chromosome 9 or chromosome 22. Br J
Haematol 1994, 87:409-412.
24. Mattarucchi E, Guerini V, Rambaldi A, Campiotti L, Venco A, Pasquali F, Lo
Curto F, Porta G: Microhomologies and interspersed repeat elements at
genomic breakpoints in chronic myeloid leukemia. Genes Chromosomes
Cancer 2008, 47:625-632.
25. Bartley PA, Martin-Harris MH, Budgen BJ, Ross DM, Morley AA: Rapid
isolation of translocation breakpoints in chronic myeloid and acute
promyelocytic leukaemia. Br J Haematol 2010, 149:231-236.
26. Gnirke A, Melnikov A, Maguire J, Rogov P, LeProust EM, Brockman W,
Fennell T, Giannoukos G, Fisher S, Russ C, Gabriel S, Jaffe DB, Lander ES,
Nusbaum C: Solution hybrid selection with ultra-long oligonucleotides
for massively parallel targeted sequencing. Nat Biotechnol 2009,
27:182-189.
27. Chen W, Ullmann R, Langnick C, Menzel C, Wotschofsky Z, Hu H, Doring A,
Hu Y, Kang H, Tzschach A, Hoeltzenbein M, Neitzel H, Markus S,
Wiedersberg E, Kistner G, van Ravenswaaij-Arts CM, Kleefstra T,
Kalscheuer VM, Ropers HH: Breakpoint analysis of balanced chromosome
rearrangements by next-generation paired-end sequencing. Eur J Hum
Genet 2009, 18:539-543.
28. Zuker M: Mfold web server for nucleic acid folding and hybridization
prediction. Nucleic Acids Res 2003, 31:3406-3415.
29. Voineagu I, Narayanan V, Lobachev KS, Mirkin SM: Replication stalling at
unstable inverted repeats: interplay between DNA hairpins and fork
stabilizing proteins. Proc Natl Acad Sci USA 2008, 105:9936-9941.
30. Inagaki H, Ohye T, Kogo H, Kato T, Bolor H, Taniguchi M, Shaikh TH,
Emanuel BS, Kurahashi H: Chromosomal instability mediated by non-B
DNA: cruciform conformation and not DNA sequence is responsible for
recurrent translocation in humans. Genome Res 2009, 19:191-198.
31. Leach DR: Long DNA palindromes, cruciform structures, genetic
instability and secondary structure repair. Bioessays 1994, 16:893-900.
doi:10.1186/gm191
Cite this article as: Shibata et al.: Detection of DNA fusion junctions for
BCR-ABL translocations by Anchored ChromPET. Genome Medicine 2010
2:70.
Submit your next manuscript to BioMed Central
and take full advantage of:
• Convenient online submission
• Thorough peer review
• No space constraints or color figure charges
• Immediate publication on acceptance
• Inclusion in PubMed, CAS, Scopus and Google Scholar
• Research which is freely available for redistribution
Submit your manuscript at
www.biomedcentral.com/submit
Shibata et al. Genome Medicine 2010, 2:70
/>Page 13 of 13