Báo cáo khoa hoc:" Preprandial ghrelin is not affected by macronutrient intake, energy intake or energy expenditure" docx
Bạn đang xem bản rút gọn của tài liệu. Xem và tải ngay bản đầy đủ của tài liệu tại đây (300.41 KB, 8 trang )
BioMed Central
Page 1 of 8
(page number not for citation purposes)
Journal of Negative Results in
BioMedicine
Open Access
Research
Preprandial ghrelin is not affected by macronutrient intake, energy
intake or energy expenditure
David R Paul*, Matthew Kramer, Donna G Rhodes and William V Rumpler
Address: U.S. Department of Agriculture, Agricultural Research Service, Diet and Human Performance Laboratory, Beltsville Human Nutrition
Research Center, Beltsville, MD 20705, USA
Email: David R Paul* - ; Matthew Kramer - ; Donna G Rhodes - ;
William V Rumpler -
* Corresponding author
Abstract
Background: Ghrelin, a peptide secreted by endocrine cells in the gastrointestinal tract, is a
hormone purported to have a significant effect on food intake and energy balance in humans. The
influence of factors related to energy balance on ghrelin, such as daily energy expenditure, energy
intake, and macronutrient intake, have not been reported. Secondly, the effect of ghrelin on food
intake has not been quantified under free-living conditions over a prolonged period of time. To
investigate these effects, 12 men were provided with an ad libitum cafeteria-style diet for 16 weeks.
The macronutrient composition of the diets were covertly modified with drinks containing 2.1 MJ
of predominantly carbohydrate (Hi-CHO), protein (Hi-PRO), or fat (Hi-FAT). Total energy
expenditure was measured for seven days on two separate occasions (doubly labeled water and
physical activity logs).
Results: Preprandial ghrelin concentrations were not affected by macronutrient intake, energy
expenditure or energy intake (all P > 0.05). In turn, daily energy intake was significantly influenced
by energy expenditure, but not ghrelin.
Conclusion: Preprandial ghrelin does not appear to be influenced by macronutrient composition,
energy intake, or energy expenditure. Similarly, ghrelin does not appear to affect acute or chronic
energy intake under free-living conditions.
Background
Ghrelin, a peptide secreted by endocrine cells in the gas-
trointestinal tract, is thought to play a significant role in
the regulation of energy balance due to its effects on the
stimulation of food intake [1,2] and weight gain [1-3] in
rodents. It has been suggested that ghrelin may also play
a role in meal initiation in humans, since the concentra-
tion of ghrelin increases immediately prior to a meal [4]
and decreases after eating [4-6]. Furthermore, ghrelin
infusions are associated with feelings of hunger and
increased energy intake during a buffet-style lunch [7].
Despite the evidence indicating a role in acute food
intake, little is known about the factors regulating ghrelin
and its effects on long-term energy balance in humans.
One hypothesis is that ghrelin secretion is up-regulated in
periods of negative energy balance and down-regulated in
periods of positive energy balance [8]. Since energy bal-
ance is a function of both energy intake and expenditure,
Published: 03 March 2005
Journal of Negative Results in BioMedicine 2005, 4:2 doi:10.1186/1477-5751-4-2
Received: 20 October 2004
Accepted: 03 March 2005
This article is available from: />© 2005 Paul et al; licensee BioMed Central Ltd.
This is an Open Access article distributed under the terms of the Creative Commons Attribution License ( />),
which permits unrestricted use, distribution, and reproduction in any medium, provided the original work is properly cited.
Journal of Negative Results in BioMedicine 2005, 4:2 />Page 2 of 8
(page number not for citation purposes)
ghrelin concentrations should increase or decrease with
fluctuations in food intake (macronutrient composition
and/or energy intake) and/or energy expenditure. In turn,
increased ghrelin concentrations should be associated
with higher food intake. However, the effects of daily fluc-
tuations in food intake and energy expenditure on ghrelin
have not been investigated in humans.
The purpose of the present study was to determine how
changes in macronutrient composition, energy intake,
and energy expenditure affect preprandial ghrelin concen-
trations, and ghrelin's subsequent effects on food intake.
Results
Body weight and composition
Ghrelin was negatively related to body fat percentage (r =
-0.46, P < 0.05) and BMI (r = -0.18, P < 0.02), but not
body weight (r = -0.16, P > 0.45). There were no signifi-
cant body weight changes during the seven day observa-
tion periods (2)(data not shown, P > 0.40).
Effect of treatment on macronutrient and energy intake
The composition of the treatment beverages and their
contribution to daily food intake is listed in Table 1. Over-
all, macronutrient intake during the seven day observa-
tion periods was primarily determined by the
composition of the treatment beverages (Table 2).
Table 1: Macronutrient composition of treatment beverages for one day, and their proportion of total daily macronutrient and energy
intake during the seven day treatment periods.
Hi-CHO Hi-PRO Hi-FAT
Composition of Treatment
Energy (MJ/d) 2.13 2.11 2.11
Carbohydrate 113 83 8
Protein (g/d) 6 34 7
Fat (g/d) 4 4 50
Percentage of Total Daily Intake
Energy (%) 17.5 ± 4.0 17.1 ± 3.2 17.8 ± 3.4
Carbohydrate (%) 25.8 ± 4.4 20.2 ± 4.3 2.5 ± 0.7
Protein (%) 4.5 ± 12.9 28.3 ± 4.8 7.7 ± 2.3
Fat (%) 5.1 ± 2.4 5.0 ± 1.8 41.5 ± 9.9
presented as means ± SD
Hi-CHO = carbohydrate treatment beverage
Hi-PRO = protein/carbohydrate treatment beverage
Hi-FAT = fat treatment beverage
Table 2: Effect of the treatment beverages on macronutrient and energy intake
Hi-CHO Hi-PRO Hi-FAT
Macronutrient Intake (% of daily total)
Carbohydrate (%) 60.4 ± 6.1
a
56.4 ± 6.9
b
47.0 ± 8.3
c
Protein (%) 13.5 ± 2.3
a,c
16.6 ± 3.2
b
13.5 ± 3.3
c
Fat (%) 26.3 ± 5.7
a
26.0 ± 5.6
a
39.1 ± 6.3
b
Macronutrient (g/day) and Energy (MJ/d) Intake
Carbohydrate (g) 450.9 ± 80.4
a
427.3 ± 83.3
b
347.3 ± 102.3
c
Protein (g) 100.6 ± 22.0
a,c
123.4 ± 19.4
b
97.5 ± 22.3
c
Fat (g) 91.0 ± 34.2
a
88.8 ± 27.6
a
126.9 ± 29.8
b
Energy (MJ/d) 12.6 ± 2.7 12.7 ± 2.3 12.2 ± 2.5
presented as means ± SD
different letters in the row denote statistical significance (mixed model ANOVA)
Hi-CHO = carbohydrate treatment beverage
Hi-PRO = protein/carbohydrate treatment beverage
Hi-FAT = fat treatment beverage
Journal of Negative Results in BioMedicine 2005, 4:2 />Page 3 of 8
(page number not for citation purposes)
Energy expenditure and macronutrient intake effects on
preprandial ghrelin
Average 24 hour energy expenditure (24EE; uncorrected
activity log alone) was 13.9 ± 1.9 MJ/d compared to 12.6
± 1.6 MJ/d for total energy expenditure (TEE; doubly
labeled water), which is an average over-reporting of
energy expenditure of 11%. Thus, our assumption that
subjects would likely misreport energy expenditure and
the values would require adjustment was valid.
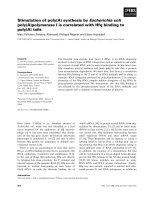
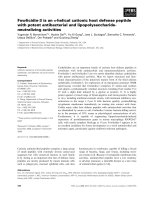
The mean preprandial ghrelin concentrations during the
last week of each treatment period were 2501.4 ± 438.0
pg·mL
-1
for Hi-CHO, 2869.5 ± 817.3 pg·mL
-1
for Hi-
PRO, and 2688.2 ± 755.5 pg·mL
-1
for Hi-FAT (Figure 1).
These values are higher than reported in similar investiga-
tions. This discrepancy is explained by the use of the Linco
Research Total Ghrelin RIA kit, which produces values
that are approximately 10-fold higher than the most com-
monly used kit (Phoenix Pharmaceuticals)[9]. In a side-
by-side comparison, both kits have been found to be
analytically acceptable despite the differences in values
obtained [9]. Furthermore, the ghrelin concentrations of
at least two studies using the same kit were very similar to
those we measured [10,11]. The within- and between-sub-
ject coefficients of variation for the two observation
periods (seven days per period) were 12.9% and 23.0%,
respectively.
Preprandial ghrelin was not influenced by treatment,
24EE, macronutrient composition, and selected (without
treatment beverages) and total (including treatment bev-
erages) energy intake (breakfast or entire day), or the
interactions between these variables (previous or same
day)(all P between 0.40 to 0.80). As a further test, we
included energy intake for seven days prior to- and two
days after each ghrelin value. None of these days were sig-
nificant (all P between 0.40 to 0.90). Individual day and
mean 24EE up to the prior 4 four days before each ghrelin
measurement was also not significant (all P between 0.10
to 0.90).
Effect of ghrelin and energy expenditure on macronutrient
and energy intake
Selected and total energy intake for the entire day were sig-
nificantly influenced by treatment period (P < 0.02),
Monday/Friday effect (P < 0.003), Sunday effect (P <
0.03), and 24EE (P < 0.008) (Table 3a). Classifying energy
intake into the three macronutrients, the only macronutri-
ent influenced by 24EE was total and selected carbohy-
drate intake (P < 0.03, and P < 0.02, respectively) (Table
3b). There was no significant effect of ghrelin on total or
selected energy intake for breakfast or entire day (all P
between 0.80 to 0.90).
Effect of covert manipulation of macronutrient intake on pre-prandial ghrelin over the course of one weekFigure 1
Effect of covert manipulation of macronutrient intake on pre-
prandial ghrelin over the course of one week. Hi-CHO =
carbohydrate treatment beverage Hi-PRO = protein/carbo-
hydrate treatment beverage Hi-FAT = fat treatment bever-
age 1 = Monday 2 = Tuesday 3 = Wednesday 4 = Thursday 5
= Friday 6 = Saturday 7 = Sunday There were no significant
treatment effects (mixed model ANOVA). Data are shown
on the original scale (see text for details)
Table 3: Determinants of total energy intake (log
10
) (A) and
carbohydrate intake (log
10
) (B)
A Independant Variable Slope SE P
Intercept -0.04 0.23 0.85
Treatment Period 0.13 0.05 <0.02
Sunday effect 0.18 0.08 <0.02
Monday/ Friday effect -0.18 0.06 <0.003
24EE (log
10
) 1.53 0.57 <0.001
B Independant Variable Slope SE P
Intercept 3.94 0.09 <0.0001
Treatment Period 0.10 0.03 <0.003
24EE (log
10
) 0.53 0.23 <0.03
Treatment Period = first 8 wk treatment vs. second 8 wk treatment
period
Sunday effect = Sunday vs. other days of the week
Monday/ Friday effect = Monday and Friday vs. the other days of the
week
24EE = daily energy expenditure
Journal of Negative Results in BioMedicine 2005, 4:2 />Page 4 of 8
(page number not for citation purposes)
Power analyses
The partial correlation between breakfast energy intake
and ghrelin was 0.07. At 80% power, we could have
detected a ghrelin effect if the true partial correlation was
a small as 0.36. For powers of 90% and 95%, the true par-
tial correlations would have had to be 0.40 and 0.43,
respectively. The partial correlation between total energy
intake and ghrelin was even lower than that with breakfast
energy intake (r = 0.003). Note that, for a partial correla-
tion of 0.40, ghrelin would have only been explaining
about 16% (0.40
2
) of the variation in energy intake, still a
relatively small percentage of explained variation for a
hormone purported to exert a large influence on intake.
Discussion
Of the variables related to energy balance measured in this
study (daily macronutrient and energy intake, energy
expenditure, and body weight and composition), none
appear to play a role in preprandial ghrelin regulation.
Similarly, ghrelin did not significantly predict
macronutrient or energy intake, despite a power analysis
indicating that we would have detected even a moderate
effect of ghrelin on intake.
Most of the evidence linking food intake and ghrelin
comes from single meal, short-term studies. The ingestion
of amino acids or a protein meal results in a post-prandial
increase in ghrelin [12-14], whereas high- [14,15] or mod-
erate carbohydrate [4,5,16], and fat [14] meals decrease
ghrelin. Carbohydrate meals may result in a greater post-
prandial suppression of ghrelin than fat [16,17]. How-
ever, it has been reported that preprandial ghrelin is unre-
lated to macronutrient intake in a large (118 subjects)
cross-sectional study [18] and a 12 week longitudinal
study [19]. Similarly, three weeks of a high fat diet has
been shown to have no effect on fasting ghrelin [20].
Based on the results of the current study and others [18-
20], it appears that macronutrient intake does not affect
preprandial ghrelin, and any macronutrient-specific
effects are limited to the post-prandial period.
Wren et al.[7] were the first investigators to demonstrate
that the infusion of ghrelin acutely results in an increase
energy intake in humans. The lack of an energy-intake
stimulating effect of ghrelin on food intake in the present
study when compared to Wren et al.[7] may be related to
the amount of ghrelin that was infused (resulting in con-
centrations twice that under fasted conditions), and the
non-free living nature of the subjects. However, other
studies have also failed to detect an increase in hunger
after ghrelin infusion [21,22]. Ghrelin concentrations do
not predict the timing of a meal request or meal size [23],
and are unaffected by energy-restricted diets [10,18,24]
and when appetite is increased [10]. Interestingly, it has
also been shown that fasting ghrelin is negatively
associated with energy intake [25]. In this same study
[25], Caucasians had ghrelin concentrations that were
approximately double that of Pima Indians, yet there was
no difference in food intake between the groups.
Although body weight typically increases by ≈ 4.5 kg in
men and ≈ 7.3 kg in women over the course of 30 years
[26], the human body regulates energy balance rather well
(within 1% over the course of 20 years)[27]. The strength
of the relationship between total energy intake and 24EE
measured in this study reflects this regulation, but our
data indicate that 24EE does not influence ghrelin. One
other study has shown that ghrelin does not appear to be
influenced by exercise, regardless of exercise intensity
[28]. This longitudinal study (three months) of normal
weight young women indicated that ghrelin increases in
response to an exercise regimen, but only when exercise
induces weight loss. Therefore, it appears that ghrelin is
not influenced by changes in energy expenditure alone.
Conclusion
In conclusion, it appears that macronutrient and energy
intake, and energy expenditure have no effect on
preprandial ghrelin. None of the variables measured in
this study explain the high daily variability in preprandial
ghrelin observed over the course of two-seven day peri-
ods. In turn, this study fails to detect the energy intake-
stimulating effect of ghrelin, despite carefully measured
food intake that lasted more than a week and a study pow-
ered to detect even a moderate effect of ghrelin.
Methods
Subjects
Twelve healthy, non-smoking men were recruited from
the Beltsville, MD area to participate in this study (Table
4). All subjects were weight-stable, and not using any
medications known to affect food intake, appetite or
water balance. The John Hopkins Bloomberg School of
Public Health Committee on Human Research approved
the study protocol. Subjects provided written informed
consent and received a medical evaluation by a physician
that included measurement of blood pressure and analy-
Table 4: Characteristics of the subjects (n = 12)
Mean SD
Age (yr) 39 9
Height (m) 1.81 0.07
Weight (kg) 79.9 8.3
Body Mass Index
(kg·m
-2
)
24.1 1.4
Body Fat (%) 18.1 1.7
Journal of Negative Results in BioMedicine 2005, 4:2 />Page 5 of 8
(page number not for citation purposes)
sis of fasting blood and urine samples to screen for
presence of metabolic disease.
Ad libitum feedings
Voluntary food intake was studied continuously for 16
weeks, whereby subjects consumed only foods provided
by the Human Studies Facility (HSF) at the Beltsville
Human Nutrition Research Center (BHNRC). Subjects
choose foods ad libitum from the menus, and could
consume any part or all of a food item, then return the
remaining portion to be weighed. BHNRC staff that came
into contact with the subjects provided no guidance as to
the quantities and/or types of food items chosen. During
weekdays, subjects reported to the BHNRC in the morn-
ing to eat breakfast, pack selected food items for lunch,
then return again in the evening for dinner. Any food
taken from the HSF that was subsequently not eaten (all
or partial quantities), was returned the next day, and
weighed and recorded. On Friday evenings, subjects were
provided with coolers packed with a large amount of food
for weekend meals. The weekend coolers provided a wide
variety of foods in excess quantities, and subjects were
allowed to request additional food items be included.
Weekend food could be consumed on either day as long
as the subjects logged which day each food item was
eaten. All uneaten weekend food was returned on Mon-
day, and weighed and recorded. Although subjects were
instructed to consume only food items provided by HSF,
they were allowed free access to beverages including
caloric, noncaloric and alcoholic beverages. Detailed
records of the amount, composition and name brand of
beverages was submitted daily. In addition to beverages
provided on the menu (milk and juice), both regular and
decaffeinated coffee and tea were available at meals.
Menus
Food items offered in the morning (breakfast and lunch)
were presented in a cafeteria-style setting as three different
rotating menus, each lasting seven days (Table 5). Some
food items remained on all three menus (e.g. milk and
orange juice). In the evening, breakfast and lunch items
were also available. A typical dinner was presented cafete-
ria-style as one or two entrée selections with optional
gravies or sauces, and a minimum of three vegetables and
side dishes. A garden salad with a variety of additional
toppings and dressings was also available. Fifteen differ-
ent dinner menus were rotated daily (Table 5).
The goals of the menu design were to allow detection of
macronutrient selection by offering a wide range of carbo-
hydrate, fat- and/or protein-rich foods, and to provide a
variety of commonly available foods typical of what many
Americans eat. In a research setting it is impossible to
duplicate the degree of food choice available in real life.
However, more than 300 food items were used to develop
menus for this study, and specific requests for food items
were incorporated into the menus whenever possible.
Recording and tracking of food intake
After each subject selected his desired foods, he presented
them to a staff member that recorded the identity and
weight of each food item by hand and on a computer
(combination of bar code recognition of the food item
and hand-entering of the weight). Upon termination of
feeding, each subject presented his tray to a staff member
Table 5: Representative food offerings during breakfast and lunch (one of three weekly rotations), and one dinner (1 of 15 daily
rotations).
BREAKFAST AND LUNCH DINNER
Beverages Cereals Bread Meat, Dairy, Eggs Snack Packaged Foods Produce #15
2 % milk Hot (6) English muffin Ham Fig bars Vegetable soup Apple Turkey
Skim milk Cold (10) Waffle Chicken salad Granola bar (LF) Beef w/veg soup Orange Chicken gravy
Orange juice Honey bun Salami Popcorn Clam chowder Banana Mashed potatoes
Apple juice Bread (4) Provolone cheese Short bread cookies Noodle soup Grapes Mixed
Vegetable juice Pita bread American cheese Brownie Pizza Peaches Citrus salad
Buttery cracker Scrambled egg Strawberry twist Pocket sandwhich Dates Cranberry sauce
Saltine cracker Bacon Chocolate bar (2) Sausage biscuit Garden salad Sourdough bread
Yogurt (FF) Peanuts Lettuce Macaroni & cheese
Cottage cheese Peanut butter Tomato
Parmesan chesse Carrots
Cucumber
Celery
(#) = number of items available in a category
LF = low fat
FF = fat free
Journal of Negative Results in BioMedicine 2005, 4:2 />Page 6 of 8
(page number not for citation purposes)
that weighed any uneaten food. The accuracy of the food
item recording process was verified by comparing the
information on the computer with the hand-entered logs.
This verification procedure was followed daily, and
repeated at the end of the study with all food records.
Energy and macronutrient composition were determined
by consultation with the USDA Nutrient Database for
Standard Reference [29].
Covert manipulation of macronutrient composition
During the 16 weeks of ad libitum intake, subjects were
randomly assigned to two of three treatments. Each treat-
ment lasted 8 weeks with no break between the periods.
The treatments consisted of a daily beverage that con-
tained ≈ 2 MJ/day of predominantly carbohydrate (Hi-
CHO), fat (Hi-FAT), or a combination of protein and car-
bohydrate (Hi-PRO) (Table 1). The daily beverage was
divided into three equal portions, and subjects consumed
them with each of the three primary meals. The protein
drink was designed to provide half the daily Recom-
mended Daily Allowance (RDA) [30] of protein, with the
balance carbohydrate. The drinks were formulated using
sucrose, heavy whipping cream, and egg white as the prin-
ciple source of carbohydrate, fat, and protein, respectively.
Water, fat free non-dairy creamer, and aspartame were
used to provide volume, adjust texture and add sweetness.
Cocoa was added to all drinks to provide a uniform taste
and appearance. Subjects were blinded to the treatments
and the three drinks were judged to be indistinguishable
by a taste panel conducted in our laboratory.
Ghrelin analysis
Each morning for the last seven days of each treatment
period, subjects reported to the laboratory after a 10–12
hr fast, provided a blood sample, then reported to the HSF
to eat breakfast. Blood was collected in tubes containing
EDTA, centrifuged, and stored at -80°C until analysis.
Plasma ghrelin was analyzed using a commercially availa-
ble radioimmunoassay kit (Total Ghrelin, Linco Research,
Inc.). The intra- and interassay coefficients of variation
(CV) were 5.6% and 7.3%, respectively.
Body weight and composition
Before breakfast and after voiding, body weight was deter-
mined weekly on an electronic balance to the nearest 0.01
kg. Body composition was measured by Dual-energy X-ray
Absorptiometry (DEXA; QDR 4500, Hologic, Inc,
Waltham, MA).
Total and 24 hr energy expenditure (24EE)
To "capture" daily variations in energy expenditure, we
combined a self-reported activity log [31] and doubly
labeled water measurements. Although doubly labeled
water is the "gold standard" measure of free-living energy
expenditure, its use is limited by the production of a single
value that is assumed to represent average energy expend-
iture over the course of the dosing period (seven days in
this study). This seven day value for energy expenditure is
not useful to compare with daily variation in ghrelin and
food intake (macronutrient composition and energy
intake). Since self-reported measures of energy expendi-
ture (that can provide a daily energy expenditure value)
may be misreported by subjects [32,33], we adjusted the
daily numbers using doubly labeled water measurements
(see below).
Twenty-four hour energy expenditure (24EE) was esti-
mated using a daily recording log method, modified from
Bouchard et al. [31]. Briefly, subjects recorded their daily
activities in a log every 15 min over the course of the last
seven days of each treatment period. Activities were
entered in as a number (1–9), corresponding to example
activities listed in the log. Each activity assumed a pre-
determined energy expenditure score, thus energy expend-
iture was calculated as time spent in that activity times the
energy expenditure rate.
Total energy expenditure (TEE) was concurrently meas-
ured by the doubly labeled water method as described by
Speakman [34], which provided an estimate of energy
expenditure during the last seven days of each treatment
period. Subjects reported to the BHNRC between 6:30 and
9:00 a.m., at which time they received an oral dose of H
2
18
O (0.16 g/kg body weight) and
2
H
2
O (0.30 g/kg body
weight). Urine samples were collected immediately before
the dose and on every morning (second void) for the last
seven days of the treatment period. The first sample was
collected approximately 24 hr after the dose. Enrichments
of
2
H and
18
O in urine samples were measured by infrared
spectroscopy and isotope ratio mass spectrometry, respec-
tively. TEE was calculated using the equations of Weir
[35].
Individual daily 24EE values were corrected using the
ratio adjustment (notation denoting subjects is
suppressed),
24EE
dayx, corrected
= 24EE
dayx
× (TEE/24EE
day 1–7
), where
24EE
dayx
is the uncorrected daily energy expenditure value
from the activity log for one of the seven days (day X),
TEE is the daily mean energy expenditure estimate using
doubly labeled water. Represents a single value during the
seven days of measurement (of which 24EE
dayx
is one),
and
24EE
day 1–7
is the mean of the seven days of uncorrected
24EE values corresponding to TEE, of which 24EE
dayx
is
one.
Journal of Negative Results in BioMedicine 2005, 4:2 />Page 7 of 8
(page number not for citation purposes)
To simplify the notation, the 24EE
dayx, corrected
value for day
X will subsequently be referred to as 24EE.
Data transformation
To check the assumption of homogeneous variances nec-
essary for valid F-tests and correct P-values, we used the
standard technique of plotting the standard deviations
(SD's) against the means for selected energy intake, group-
ing observations by subject and treatment period. The
results of this scatter plot revealed a strong positive linear
relationship (r = 0.67, P < 0.001). The relationships
between the SD and mean for macronutrient and energy
intake (total and selected), and 24EE were also positive
and significant. This indicated that the SD's (variances)
were a function of the mean and that the data needed to
be transformed. We followed methods described by
Draper and Smith [36], and used a family of transforma-
tions based on logarithms. For selected energy intake, this
transformation was log (b
0
+ b
1
y
i
), where b
0
and b
1
are the
estimated coefficients of the line fit by regressing the SDs
on the means, and y
i
represents the energy intake data.
The other variables were transformed using this same fam-
ily of transformations. This procedure resulted in homo-
geneous variances for all variables once transformed,
satisfying ANOVA assumptions. We present the data on
the original scale in tables and figures for ease of interpre-
tation (unless indicated otherwise).
Due to the free-living nature of the subjects, there were
three observations (of 168) where (for unknown reasons)
a subject's food intake differed greatly from habitual
intake due to a skipped meal or meals with low energy
intake. For this reason, these observations were not used
in the analyses. Additionally, a preliminary sensitivity
analysis and residual diagnostics (e.g., restricted likeli-
hood distance, Cook's D; optional output of Proc Mixed,
new in version 9.1, in [37]) suggested they were outliers.
Statistical analysis
The experimental design was an incomplete block crosso-
ver design, with two of the three drink treatments given
sequentially to each subject. Data were analyzed in the
mixed linear models framework, using the Proc Mixed
procedure in SAS (version 9.1)[37]. Subject-to-subject var-
iation was modelled as a random effect. Repeatedly meas-
uring each subject over the seven days induced an
autoregressive covariance structure we modelled as AR(1).
Other design effects we retained in our modelling were a
two level period effect ((first 8 week treatment period (1)
vs. the second 8 week period (2)), and two day-of-the-
week variables, found in a preliminary analysis to account
for day-of-the-week effects. Each of these day-of-the-week
variables classify days into two groups: (1) Sunday (0 vs.
1 for other days of the week) and (2) Monday/Friday (0
vs. 1 for other days of the week). They allow for the major
differences in food intake and energy expenditure due to
day-of-the-week effects. Some subject-specific variables,
such as body weight, were included as covariates as appro-
priate. The treatment effects (Hi-CHO, Hi-PRO, and Hi-
FAT) were included in all models.
For models predicting ghrelin concentration, we included
24EE, energy intake, and the interaction between 24EE
and energy intake. We also considered prior day (up to 7
days) and subsequent day (up to 2 days) values for energy
intake and ghrelin, and their interactions as candidate
covariates. Values for up to 4 prior days for 24EE were
used to predict ghrelin. For models predicting daily energy
intake, we included preprandial ghrelin concentrations,
24EE, the interaction between ghrelin and 24EE, and
additionally considered as candidate covariates the prior
(seven days) and subsequent (two days) days for these
two variables and their interactions. We explored models
that included other variables and interactions, but none of
those variables appeared useful. Data are presented as
total intake (intake including treatment drinks) and/or
selected intake (intake without treatment drinks). Values
are presented as means ± SD unless indicated otherwise.
Since a preliminary analysis suggested that the effect of
ghrelin on energy intake was small or negligible, we con-
ducted a power analysis to determine our ability to detect
an effect of ghrelin if the effect was small. This was accom-
plished by Monte-Carlo simulation (creating simulated
data sets based on the data we collected) and, starting with
no effect of ghrelin (a true coefficient of zero for ghrelin in
a regression context), determining how large the true coef-
ficient needed to be to obtain significance for most of the
simulations, at powers of 80%, 90%, and 95%, with 1000
simulations for each coefficient value. These results are
most easily interpreted as how large a partial correlation
between ghrelin and energy intake (adjusting for all other
fixed and random effects, other than ghrelin) would be
necessary for us to detect it. We conducted this analysis for
both total energy intake and breakfast energy intake (the
latter was the meal most likely to be influenced by pre-
prandial ghrelin because of the timing of the blood draw).
Authors' contributions
MK was responsible for statistical analysis and interpreta-
tion. DR was responsible for supervising the food intake
portion of the study. WR conceived the study, and super-
vised the data collection and analysis. DP was responsible
for ghrelin analysis, data collection, statistical analysis
and manuscript preparation. All authors read and
approved the final manuscript.
References
1. Wren AM, Small CJ, Ward HL, Murphy KG, Dakin CL, Taheri S,
Kennedy AR, Roberts GH, Morgan DGA, Ghatei MA, Bloom SR: The
novel hypothalamic peptide ghrelin stimulates food intake
Publish with BioMed Central and every
scientist can read your work free of charge
"BioMed Central will be the most significant development for
disseminating the results of biomedical research in our lifetime."
Sir Paul Nurse, Cancer Research UK
Your research papers will be:
available free of charge to the entire biomedical community
peer reviewed and published immediately upon acceptance
cited in PubMed and archived on PubMed Central
yours — you keep the copyright
Submit your manuscript here:
/>BioMedcentral
Journal of Negative Results in BioMedicine 2005, 4:2 />Page 8 of 8
(page number not for citation purposes)
and growth hormone secretion. Endocrinology 2000,
141:4325-4328.
2. Wren AM, Small CJ, Abbott CR, Dhillo WS, Seal LJ, Cohen MA, Bat-
terham RL, Taheri S, Stanley SA, Ghatei MA, Bloom SR: Ghrelin
causes hyperphagia and obesity in rats. Diabetes 2001,
50:2540-2547.
3. Tschop M, Smiley DL, Heiman ML: Ghrelin induces adiposity in
rodents. Nature 2000, 407:908-913.
4. Cummings DE, Purnell JQ, Frayo RS, Schmidova K, Wisse BE, Weigle
DS: A preprandial rise in plasma ghrelin level suggests a role
in meal initiation in humans. Diabetes 2001, 50:1714-1719.
5. Tschop M, Wawarta R, Riepl RL, Friedrich S, Bidlingmaier M, Landgraf
R, Folwaczny C: Post-prandial decrease of circulating human
ghrelin levels. J Endocrinol Invest 2001, 24:RC19-RC21.
6. English PJ, Ghatei MA, Malik IA, Bloom SR, Wilding JPH: Food fails
to suppress ghrelin levels in obese humans. J Clin Endocrinol
Metab 2002, 87:2984-2987.
7. Wren AM, Seal LJ, Cohen MA, Brynes AE, Frost GS, Murphy KG,
Dhillo WS, Ghatei MA, Bloom SR: Ghrelin enhances appetite and
increases food intake in humans. J Clin Endocrinol Metab 2001,
86:5992-5995.
8. Shiiya T, Nakazato M, Mizuta A, Date Y, Mondal MS, Tanaka M,
Nozoe SI, Hosada H, Kangawa K, Matsukura S: Plasma ghrelin lev-
els in lean and obese humans and the effect of glucose on
ghrelin secretion. J Clin Endocrinol Metab 2002, 87:240-244.
9. Groschl M, Uhr M, Kraus T: Evaluation of the comparability of
commercial ghrelin assays. Clin Chem 2004, 2:457-458.
10. Doucet E, Pomerleau M, Harper ME: Fasting and postprandial
total ghrelin remain unchanged after short-term energy
restriction. J Clin Endocrinol Metab 2004, 89:1727-1732.
11. Choi KM, Lee J, Lee KW, Seo JA, Oh JH, Kim SG, Kim NH, Choi DS,
Baik SH: The associations between plasma adiponectin, ghre-
lin levels and cardiovascular risk factors. Eur J Endocrinol 2004,
150:715-718.
12. Groschl M, Knerr I, Topf HG, Schmid P, Rascher W, Rauh M: Endo-
crine responses to the oral ingestion of a physiological dose
of essential amino acids in humans. J Endocrinol 2003,
179:237-244.
13. Knerr I, Groschl M, Rascher W, Rauh M: Endocrine effects of food
intake: insulin, ghrelin, and leptin responses to a single bolus
of essential amino acids in humans. Ann Nutr Metab 2003,
47:312-318.
14. Erdmann J, Lippl F, Schusdziarra V: Differential effect of protein
and fat on plasma ghrelin levels in man. Regul Pept 2003,
116:101-107.
15. Caixas A, Bashore C, Nash W, Pi-Sunyer FX, Laferrere B: Insulin,
unlike food intake, does not suppress ghrelin in human
subjects. J Clin Endocrinol Metab 2002, 87:1902-1906.
16. Greenman Y, Golani N, Gilad S, Yaron M, Limor R, Stern N: Ghrelin
secretion is modulated in a nutrient- and gender-specific
manner. Clin Endocrinol (Oxf) 2004, 60:382-388.
17. Monteleone P, Bencivenga R, Longobardi N, Serritella C, Maj M: Dif-
ferential responses of circulating ghrelin to high-fat or high-
carbohydrate meal in healthy women. J Clin Endocrinol Metab
2003, 88:5510-5514.
18. Chan JL, Bullen J, Lee JH, Yiannakouris N, Mantzoros CS: Ghrelin
levels are not regulated by recombinant leptin administra-
tion and/or three days of fasting in healthy subjects. J Clin Endo-
crinol Metab 2004, 89:335-343.
19. Weigle DS, Cummings DE, Newby PD, Breen PA, Frayo RS, Matthys
CC, Callahan HS, Purnell JQ: Roles of leptin and ghrelin in the
loss of body weight caused by a low fat, high carbohydrate
diet. J Clin Endocrinol Metab 2003, 88:1577-1586.
20. Robertson MD, Henderson RA, Vist GE, Rumsey RDE: Plasma
ghrelin response following a period of acute overfeeding in
normal weight men. Int J Obes Relat Metab Disord 2004,
28:727-733.
21. Akamizu T, Takaya K, Irako T, Hosada H, Teramukai S, Matsuyama A,
Tada H, Miura K, Shimizu A, Fukushima M, Yokode M, Tanaka K, Kan-
gawa K: Pharmacokinetics, safety, endocrine and appetite
effects of ghrelin administration in young healthy subjects.
Eur J Endocrinol 2004, 150:447-455.
22. Weikel JC, Wichniak A, Ising M, Brunner H, Friess E, Held K, Mathias
S, Schmid DA, Uhr M, Steiger A: Ghrelin promotes slow-wave
sleep in humans. Am J Physiol Endocrinol Metab 2003, 284:E407-15.
23. Callahan HS, Cummings DE, Pepe MS, Breen PA, Matthys CC, Weigle
DS: Postprandial suppression of plasma ghrelin level is pro-
portional to ingested caloric load but does not predict inter-
meal interval in humans. J Clin Endocrinol Metab 2004,
89:1319-1324.
24. Ravussin E, Tschop M, Morales S, Bouchard C, Heiman ML: Plasma
ghrelin concentration and energy balance: overfeeding and
negative energy balance studies in twins. J Clin Endocrinol Metab
2001, 86:4547-4551.
25. Salbe AD, Tschop MH, DelParigi A, Venti CA, Tataranni PA: Nega-
tive relationship between fasting plasma ghrelin concentra-
tions and ad libitum food intake. J Clin Endocrinol Metab 2004,
89:2951-2956.
26. Kuczmarski RJ: Prevalence of overweight and weight gain in
the United States. Am J Clin Nutr 1992, 55:495S-502S.
27. Westerterp KR, Donkers JH, Fredrix EW, Boekhoudt P: Energy
intake, physical activity and body weight: a simulation
model. Br J Nutr 1995, 73:337-347.
28. Schmidt A, Maier C, Schaller G, Nowotny P, Bayerle-Eder M, Buranyi
B, Luger A, Wolzt M: Acute exercise has no effect on ghrelin
plasma concentrations. Horm Metab Res 2004, 36:174-177.
29. U.S. Department of Agriculture: USDA Nutrient Database for
Standard Reference, Release 15. [ />foodcomp].
30. National Research Council (U.S.). Subcommittee on the Tenth Edi-
tion of the RDAs.: Recommended dietary allowances. Washing-
ton, D.C., National Academy Press; 1989.
31. Bouchard C, Tremblay A, Leblanc C, Lortie G, Savard R, Theriault G:
A method to assess energy expenditure in children and
adults. Am J Clin Nutr 1983, 37:461-467.
32. Kesaniemi YK, Danforth E, Jensen MD, Kopelman PG, Lefebvre P,
Reeder BA: Dose-response issues concerning physical activity
and health: an evidence-based symposium. Med Sci Sports Exerc
2001, 33:S351-S358.
33. Jebb SA, Moore MS: Contribution of a sedentary lifestyle and
inactivity to the etiology of overweight and obesity: current
evidence and research issues. Med Sci Sports Exerc 1999,
31:S534-S541.
34. Speakman JR: Doubly labelled water: theory and practice. First
edition. London, UK, Chapman and Hall; 1997.
35. Weir JB: New methods for calculating metabolic rate with
special reference to protein metabolism. 1949. Nutrition 1990,
6:213-221.
36. Draper NR, Smith H: Applied regression analysis. 2nd edition.
N.Y., John Wiley and Sons; 1981:709.
37. SAS Institute Inc: . 9.1th edition. Cary, NC, USA, .