Vision Systems - Applications Part 3 pot
Bạn đang xem bản rút gọn của tài liệu. Xem và tải ngay bản đầy đủ của tài liệu tại đây (646.76 KB, 40 trang )
Behavior-Based Perception for Soccer Robots
71
modules and can be called independently. When an algorithm is called it takes a parameter,
indicating e.g. the color of the object (blue/yellow), and the size (far/near). Every cycle,
when the central image processing module is called, it will call a set of image processing
algorithms, dependent on the behavior. In chapter 6 we will show the other advantages we
found by making image processing completely modular.
3.3 Drawbacks of behavior based vision
There are limits and drawbacks to applying multiple sense-think-act loops to the vision
system of robots.
The first thing to consider is that the use of location information in the image processing and
self localization for discarding unexpected objects, gives rise to the chance of entering a local
loop: when the robot would discard information based on a wrong assumption of its own
position, it could happen the robot would not be able to retrieve its correct position. For
avoiding local loops, periodic checking mechanisms on the own position are required (on a
lower pace). Also one could restrict the runtime of behaviors in which much information is
discarded and invoke some relocation behavior to be executed periodically.
The second drawback is, that due to less reusability, and more implementations of
optimized code, the overall size of the system will grow. This influences the time it will take
to port code to a new robot, or to build new robot-software from scratch.
The third drawback is that for every improvement of the system (for every sense-think-act
loop), some knowledge is needed of the principles of image processing, mechanical
engineering, control theory, AI and software engineering. Because of this, behavior-
designers will probably reluctant to use the behavior-specific vision system. Note, however,
that even if behavior designer are not using behavior-dependent vision, the vision system
can still be implemented. In worst case a behavior designer can choose to select the general
version of the vision system for all behaviors, and the performance will be the same as
before.
4. Algorithms in old software
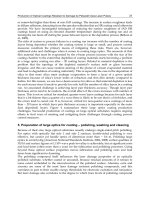
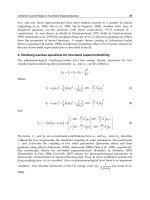
Figure 7. Simplified software architecture for a soccer-playing Aibo robot in the Dutch Aibo
Team
Vision Systems: Applications
72
In this paragraph, an overview will be given of the software architecture of soccer robots
(Sony Aibo ERS-7) in the Dutch Aibo Team (Oomes et al, 2004), which was adapted in 2004
from the code of the German Team of 2003 (Rofer et al, 2003). This software was used as a
starting point for implementing the behavior-based vision system as is described in the next
paragraph. The DT2004 software was also used for testing the performance of new systems.
In Fig 7. A simplified overview of the DT2004 software architecture is depicted. The
architecture can be seen as one big sense-think-act loop. Sensor measurements are processed
by, Image Processing, Self Localisation, Behavior Control and Motion Control sequentially,
in order to plan the motions of the actuators. Note that this simplified architecture only
depicts the modules most essential to our research. Other modules, e.g. for detecting
obstacles or other players, and modules for controlling LEDs and generating sounds, are
omitted from the picture.
4.1 Image Processing
The image processing is the software that generates percepts (such as goals, flags, lines and
the ball) from the sensor input (camera images). In the DT2004 software, the image
processing uses a grid-based state machine (Bruce et al, 2000), with segmentation primarily
done on color and secondarily by shapes of objects.
Using a color table
A camera image consists of 208*160 pixels. Each of these pixels has a three-dimensional
value p(Y,U,V). Y represents the intensity; U and V contain color-information; each having
an integer value between 0 and 254. In order to simplify the image processing problem, all
these 254*254*254 possible pixel-values are mapped onto only 10 possible colors: white,
black, yellow, blue, sky-blue, red, orange, green, grey and pink, the possible colors of objects
in the playing field. This mapping makes use of a color-table, a big 3-dimensional matrix
which stores which pixel-value corresponds to which color. This color-table is calibrated
manually before a game of soccer.
Grid-based image processing
The image processing is grid-based. For every image, first the horizon is calculated from the
known angles of the head of the robot. Then a number of scan-lines is calculated
perpendicular to that horizon. Each scan-line then is then scanned for sequences of colored-
pixels. When a certain sequence of pixels indicates a specific object, the pixel is added to a
cluster for that possible object. Every cluster will be evaluated to finally determine whether
or not an object was detected. This determination step uses shape information, such as the
width and length of the detected cluster, and the position relative to the robot.
Grid-based image processing is useful not only because it processes only a limited number
of pixels, saving CPU cycles, but also that each image is scanned relative to the horizon.
Therefore processing is independent of the position of the robots’ head (which varies widely
for an Aibo Robot).
4.2 Self Localisation
The self localisation is the software that obtains the robot‘s pose (x,y, ø) from output of the
image processing, i.e. the found percepts. The approach used in the Dutch Aibo Team is
particle filtering, or Monte Carlo Localization, a probability-based method (Thrun, 2002);
(Thrun et al, 2001); (Röfer & Jungel, 2003). The self locator keeps tracks of a number of
particles, e.g. 50 or 100.
Behavior-Based Perception for Soccer Robots
73
Each particle basically consists of a possible pose of the robot, and of a probability. Each
processing cycle consists of two steps, updating the particles and re-sampling them. The
updating step starts by moving all particles in the direction that the robot has moved
(odometry), adding a random offset. Next, each particle updates its probability using
information on percepts (flags, goals, lines) generated by the image processing. Also in this
step the pose of the particles can be slightly updated, e.g. using the calculated distance to the
nearest lines. In the second step, all particles are re-sampled. Particles with high
probabilities are multiplied; particles with low probabilities are removed.
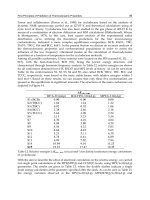
A representation of all 50 particles is depicted in figure 8.
Figure 8. The self localization at initialization; 100 samples are randomly divided over the
field. Each sample has a position x, y, and heading in absolute playing-field coordinates. The
robot‘s pose (yellow robot) is evaluated by averaging over the largest cluster of samples.
4.3 Behavior Control
Figure 9. General simplified layout of the first layers of the behavior Architecture of the
DT2004-soccer agent. The rectangular shapes indicate options; the circular shape indicates a
basic behavior. When the robot is in penalized state and standing, all the dark-blue options
are active
Vision Systems: Applications
74
Behavior control can be seen as the upper command of the robot. As input, behavior control
takes high level information about the world, such as the own pose, the position of the ball
and of other players. Dependent on its state, behavior control will then give commands to
motion control, such as walk with speed x, look to direction y, Behavior control in the
DT2004 software is implemented as one gigantic state machine, written in XABSL (Lötzsch
et al, 2004), an XML based behavior description language. The state machine distinguishes
between options, states and basic behaviors. Each option is a separate XABSL file. Within
one option, the behavior control can be in different states. E.g. in Figure 9, the robot is in the
penalized state of the play soccer option, and therefore calls the penalized option. Basic
behaviors are those behaviors that directly control the low level motion. The stand behavior
in Figure 9 is an example of a basic behavior.
4.4 Motion control
Motion control is the part that calculates the joint-values of the robots joints. Three types of
motion can be identified in the DT2004 software:
• Special actions
A special action is a predefined set of joint-values that is executed sequentially, controlling
both leg and head joints. All kicking motions, get-up actions and other special movements
are special actions.
• Walking engine
All walking motions make use of an inverse kinematics walking engine. The engine takes a
large set of parameters (approx. 20) that result in walking motions. These parameters can be
changed by the designer. The walking engine mainly controls the leg joints.
• Head motion
The head joints are controlled by head control, independently from the leg joints. The head
motions are mainly (combinations of) predefined loops of head joint values. The active head
motion can be controlled by behavior control.
5. Behavior-Based perception for a goalie
This paragraph describes our actual implementation of the behavior-based vision system for
a goalie in the Dutch Aibo Team. It describes the different sense-think-act loops identified,
and the changes made in the image processing and self localisation for each loop. All
changes were implemented starting with the DT2004 algorithms, described in the previous
paragraph.
5.1 Identified behaviors for a goalie.
For the goalkeeper role of the robot we have identified three different mayor behaviors,
which each will be implemented as a separate sense-think-act loops. When the goalie is not
in its goal (Figure 11a), it will return to its goal using the return-to-goal behavior. When there
is no ball in the penalty area (Figure 11b) , the robot will position itself between the ball and
the goal, or in the center of the goal when there is no ball in sight. For this the goalie will call
the position behavior. When there is a ball in the penalty area (Figure 11c), the robot will call
the clear-ball behavior to remove the ball from the penalty area. Figure 10 shows the software
architecture for the goalie, in which different vision and localisation algorithms are called
for the different behaviors. The 3 behaviors are controlled by a meta-behavior (Goalie in
Behavior-Based Perception for Soccer Robots
75
Figure 10) that may invoke them. We will call this meta-behavior the goalie’s governing
behavior.
Figure 10. Cut-out of the hierarchy of behaviors of a soccer robot, with emphasis on the
goalkeeper role. Each behavior (e.g. position) is an independently written sense-think-act loop
a) b) c)
Figure 11. Basic goalie behaviors: a) Goalie-return-to goal, b) Goalie-position, c) Goalie-clear
ball. For each behavior a different vision system is used and a different particle filter setting
5.2 Specific perception used for each behavior.
For each of the 3 behaviors, identified in Figures 10 and 11, we have adapted both the image
processing and self localization algorithms in order to improve localization performance.
• Goalie-return-to-goal. When the goalie is not in his goal area, he has to return to it. The
goalie walks around scanning the horizon. When he has determined his own position on the
field, the goalie tries to walk straight back to goal - avoiding obstacles - keeping an eye on
his own goal. The perception algorithms greatly resemble the ones of the general image
processor, with some minor adjustments.
Image-processing searches for the own goal, line-points, border-points and the two corner
flags near the own goal. The opponent’ goal and flags are ignored.
For localisation, an adjusted version of the old DT2004 particle filter is used, in which a
detected own goal is used twice when updating the particles.
• Goalie- position. The goalie is in the centre of its goal when no ball is near. It sees the
field-lines of the goal area often and at least one of the two nearest corner flags regularly.
Localisation is mainly based of the detection of the goal-lines; the flags are used only to
correct if the estimated orientation is off more than 45
0
off. This is necessary because the
robot has no way (yet) to distinguish between the four lines surrounding the goal.
Vision Systems: Applications
76
Image processing is used to detect the lines of the goal-area and for detecting the flags. The
distance and angle to goal-lines are detected by applying a Hough transform on detected
line-points.
For the detection of the own flags a normal flag detection algorithm is used, with the
adjustment that too small flags are rejected, since the flags are expected relatively near.
For self localization, a special particle filter was used that localized only on the detected
lines and flags. A background process verifies the “in goal” assumption on the average
number of detected lines and flags.
• Goalie-clear-ball. If the ball enters the goal area, the goalie will clear the ball.
The image processing in this behavior is identical to that in the goalie-position behavior. The
goalie searches for the angles and distances to the goal-lines, and detects the flags nearest to
the own goal.
However, the self localization for the clear_ball behavior is different from that of the position
behavior. When the goalie starts clearing the ball, the quality of the perception input will be
very low. We have used this information, both for processing detected lines, and for
processing detected flag.
For flags we have used a lower update rate: it will take longer before the detection of flags at
a different orientation will result in the robot changing its pose. Lines detected at far off
angles or distances, resulting in a far different robot-pose, are ignored. The reason for this
mainly is that while clearing the ball, the goalie could come outside its’ penalty area. In this
case we don’t want the robot to mistake a border line or the middle-line for a line belonging
to the goal area.
When the goalie clears a ball, there is no checking mechanism to check the “in goal”
assumption, as was in the position behavior. When the goalie has finished clearing the ball
and has returned to the position behavior, this assumption will be checked again.
6. Object-Specific Image Processing
In other to enable behavior-dependent image processing, we have split up the vision system
into a separate function per object to detect. We have distinguished between types of objects,
(goals, flags), color of objects (blue/yellow goal), and take a parameter indicating the size of
the objects (far/near flag). In stead of using one general grid and one color table for
detecting all objects (Figure 12 left), we define a specific grid and specific color-table for each
object (Figure 12 right).
For example, for detecting a yellow/pink flag (Figure 13b), the image is scanned only above
the horizon, limiting the used processing power and reducing the chance on an error. For
detecting the lines or the ball, we only can scan the image below the horizon (Figure 13a).
For each object we use a specific color-table (CT). In general, CTs have to be calibrated
(Bruce at al, 2000). Here we only calibrated the CT for the 2 or 3 colors necessary for
segmentation. This procedure greatly reduces the problem of overlapping colors. Especially
in less well lighted conditions, some colors that are supposed to be different appear with
identical Y,U,V values in the camera image. An example of this can be seen in Figures 14a-f.
When using object-specific color tables, we don’t mind that parts of the “green” playing
field have identical values as parts of the “blue” goal. When searching for lines, we define
the whole of the playing field as green (Figure 14e). When searching for blue goals, we
define the whole goal as blue (Figure 14c). A great extra advantage of having object-specific
Behavior-Based Perception for Soccer Robots
77
color-tables is that it takes much less time to calibrate them. Making a color table as in
Figure 14b, which has to work for all algorithms, can take a very long time.
Figure 12. General versus object-specific image processing. Left one can see the general
image processing. A single grid and color-table is used for detecting all candidates for all
objects. In the modular image processing (right), the entire process of image processing is
object specific
a) b) c)
Figure 13. Object-specific image processing: a) for line detection we scan the image below
the horizon, using a green-white color table; b) for yellow flag detection we scan above the
horizon using a yellow-white-pink color table; c) 2 lines and 1 flag detected in the image
Figure 14. a) camera image; b) segmented with a general color-table; c) segmented with a
blue/green color-table; d) segmented with a blue/white/pink color-table for the detection
of a blue flag; e) segmented with a green/white color-table; f) segmented with a
yellow/green color-table for the detection of the yellow goal
Vision Systems: Applications
78
7. Performance Measurements
7.1 General setup of the measurements
In order to prove our hypothesis that a goalie with a behavior-based vision system is more
robust, we have performed measurements on the behavior of our new goalie.
The localisation performance is commonly evaluated in terms of accuracy and/or
reactiveness of localisation in test environments dealing with noisy (Gaussian) sensor-
measurements (Röfer & Jungel, 2003). We, however, are interested mainly in terms of the
system’s reliability when dealing with more serious problems such as large amounts of false
sensor data input, or limited amounts of correct sensor input.
The ultimate test is how much goals does the new goalie prevent under game conditions in
comparison with the old goalie? Due to the hassle and chaotic play around the goal when
there is an attack, the goalie easily loses track of where he is. So our ultimate test is now
twofold:
1. How fast can the new goalie find back his position in the middle of the goal on a
crowded field in comparison with the old goalie
2. How many goals can the new goalie prevent on a crowded field within a certain time
slot in comparison with the old goalie
All algorithms for the new goalie are made object specific, as described in chapter 4. Since
we also want to know the results of using behavior-based perception, results of all real-
world scenarios are compared not only to results obtained with the DT2004 system, but also
with a general vision system that does implement all object-specific algorithms.
The improvements due to object-specific algorithms are also tested offline on sets of images.
7.2 Influence of Object-Specific Image Processing
We have compared the original DT2004 image processing with a general version of our
NEW image processing; meaning that the latter does not (yet) use behavior specific image
processing nor self-localization. In contrast with the DT2004 code, the NEW approach does
use object specific grids and color tables. Our tests consisted of, searching for the 2 goals, the
4 flags, and all possible line- and border-points. The images sequences were captured with
the robot’s camera, under a large variety of lighting conditions (Figure 15). A few images
from all but one of these lighting condition sequences were used to calibrate the Color-
Tables (CTs). For the original DT2004 code, a single general CT was calibrated for all colors
that are meaningful in the scene, i.e.: blue, yellow, white, green, orange and pink. This
calibration took three hours. For the NEW image processing code we calibrated five 3-color
CTs (for the white-on-green lines, blue-goal, blue-flag, yellow-goal, and yellow-flag
respectively). This took only one hour for all tables, so 30% of the original time.
Figure 15. Images taken by the robots camera under different lighting conditions: a) Tube-
light; b) Natural-light; c) Tube-light + 4 floodlights + natural light.
Behavior-Based Perception for Soccer Robots
79
For all image sequences that we had acquired, we have counted the number of objects that
were detected correctly (N true) and detected falsely (N false). We have calculated also the
correctly accepted rate (CAR) being the number of objects that were correctly detected
divided by the number of objects that were in principle visible. Table 1 shows the results on
detecting flags and lines. The old DT2004 image processor uses a general grid and a single
color table, the NEW modular image processor uses object-specific grids and color-tables
per object. The calculation of the correctly accepted rate is based on 120 flags/goals that
were in principle visible in the first 5 image sequences and 360 flags/goals in principle
visible in the set where no calibration settings were made for. The image sequences for line
detection each contained on average 31-33 line-points per frame.
Goals and flags DT2004 NEW DT2004 NEW
N true
CAR
(%)
N false N true
CAR
(%)
N false
Lines
(%)
Lines
(%)
1 flood light 23 19 0 65 54 0 18 94
Tube light 54 45 9 83 83 1 58 103
4 flood lights 86 72 0 99 99 0 42 97
Tube +flood lights 41 34 1 110 92 0 24 91
Tube,flood+natural 39 33 0 82 68 0 42 91
Natural light 47 39 0 68 57 0
Non calibration set 131 44 28 218 73 16
Table 1. The influence of object-specific algorithms for goal, flag and line detection
Table 1 shows that due to using object specific grids and color tables, the performance of the
image processing largely increased. The correctly accepted rate (CAR) goes up from about
45 % to about 75%, while the number of false positives is reduced. Moreover, it takes less
time to calibrate the color-tables. The correctly accepted rate of the line detection even goes
up to over 90%, also when a very limited amount of light is available (1 Flood light).
7.4 Influence of behavior based perception
In the previous tests we have shown the improvement due to the use of object specific grids
and color tables. Below we show the performance improvement due to behavior based
switching of the image processing and the self localization algorithm (the particle filter). We
used the following real-world scenarios.
• Localize in the penalty area. The robot is put into the penalty area and has to return to a
predefined spot as many times as possible within 2 minutes.
• Return to goal. The robot is manually put onto a predefined spot outside the penalty
area and has to return to the return-spot as often as possible within 3 minutes.
• Clear ball. The robot starts in the return spot; the ball is manually put in the penalty
area every time the robot is in the return spot. It has to clear the ball as often as possible
in 2 minutes.
• Clear ball with obstacles on the field. We have repeated the clear ball tests but then with
many strange objects and robots placed in the playing field, to simulate a more natural
playing environment.
Vision Systems: Applications
80
Figure 16. Results for localisation in the penalty area. The number of times the robot can re-
localise in the penalty area within 2 minutes. The old DT2004 vision system cannot localise
when there is little light (TL). The performance of the object specific image processing
(without specific self localisation) is shown by the “flags and lines” bars. In contrast with the
DT2004 code, the striker uses object specific image processing. The goalie uses object specific
image processing, behavior based image processing and behavior based self localisation
In order to be able to distinguish between the performance increase due to object-specific
grids and color-tables, and the performance increase due to behavior-dependent image
processing and self localisation, we used 3 different configurations.
• DT2004: The old image processing code with the old general particle filter.
• Striker: The new object-specific image processing used in combination with the old
general particle filter of which the settings are not altered during the test.
• Goalie: The new object-specific image processing used in combination with object-
specific algorithms for detecting the field lines, and with a particle filter of which the
settings are altered during the test, depending on the behavior that is executed (as
described in chapter 5).
The results can be found in Figures 16-19.
Figure 17. Results of the return to goal test. The robot has to return to its own goal as many
times as possible within 3 minutes. The striker vision systems works significantly better
than the DT2004 vision system. There is not a very significant difference in overall
performance between the striker (no behavior-dependence) and the goalie (behavior
dependence). This shows that the checking mechanism of the “in goal” assumption works
correctly
Behavior-Based Perception for Soccer Robots
81
Figure 18. (left). Results of the clear ball test. The robot has to clear the ball from the goal
area as often as he can in 2 minutes. Both the striker and the goalie vision systems are more
robust in a larger variety of lighting conditions than the DT2004 vision system (that uses a
single color table). The goalie’s self-locator, using detected lines and the yellow flags, works
up to 50 % better than the striker self-locator, which locates on all line-points, all flags and
goals
Figure 18 (right). Results of the clear ball with obstacles on the field test. The goalie vision
system, which uses location information to disregard blue flags/goals and only detects large
yellow flags, is very robust when many unexpected obstacles are visible in or around the
playing field.
8. Results
• The impact of behavior-based perception can be seen from the localization test in the
penalty area (Figure 16) and from the clear-ball tests (Figure 18). The vision system of
the goalie, with behavior based vision and self localisation, performs > 50 % better on
the same task as a striker robot with a vision system without behavior-based perception.
• With object-specific grids and color-tables, the performance of the image processing
(reliability) under variable lighting conditions has increased with 75-100% on sets of off-
line images, while the color calibrating time was reduced to 30%.
• Behavior-based perception and object-specific image processing combined allows for
localization in badly lighted conditions, e.g. with TL tube light only (Figure 16-18).
• The impact of discarding unexpected objects on the reliability of the system can most
clearly be seen from the clear ball behavior test with obstacles on the field (Figure 18,
right). With TL + Floods, the striker apparently sees unexpected objects and is unable to
localize, whereas the goalie can localize in all situations.
• Using all object specific image processing algorithms at the same time requires the same
CPU load as the old general DT2004 image processor. Searching for a limited number of
objects in a specific behavior can therefore reduce the CPU load considerably.
• Due to the new architecture, the code is more clean and understandable; hence better
maintainable and extendable. The main drawback is that one has to educate complete
system engineers instead of sole image processing, software, AI, and mechanical
experts.
Vision Systems: Applications
82
9. References
Arkin, R.C. (1998). Behavior based robotics, MIT press, ISBN 0-262-01165-4
Brooks, R.A. (1991). Intelligence without Representation. Artificial Intelligence, Vol.47, 1991,
pp.139-159.
Bruce, J.; Balch, T. & Veloso, M (2000). Fast and inexpensive color image segmentation for
interactive robots. In Proceedings of the 2000 IEEE/RSJ International Conference on In-
telligent Robots and Systems (IROS '00), volume 3, pages 2061-2066.
Dietterich, T.G (2000). Hierarchical reinforcement learning with the MAXQ value function
decomposition. Journal of Artificial Intelligence Research, 13:227-303, 2000
Jonker, P.P.; Terwijn, B; Kuznetsov, J & van Driel, B (2004). The Algorithmic foundation of
the Clockwork Orange Robot Soccer Team, WAFR '04 (Proc. 6th Int. Workshop on the
Algorithmic Foundations of Robotics, Zeist/Utrecht, July), 2004, 1-10.
Lenser, S; Bruce, J & Veloso (2002). M. A Modular Hierarchical Behavior-Based Architecture,
in RoboCup-2001, Springer Verlag, Berlin, 2002.
Lötzsch, M.; Back, J.; Burkhard H-D & Jüngel, M (2004). Designing agent behavior with the
extensible agent behavior specification language XABSL. In: 7th International Work-
shop on Robocup 2003 (Robot World Cup Soccer Games and Conferences in Artificial
Intelligence, Padova, Italy, 2004.
Mantz, F. (2005). A behavior-based vision system on a legged robot. MSc Thesis, Delft
University of Technology, Delft, the Netherlands.
Mantz, F; Jonker, P; Caarls W (2005); Behavior-based vision on a 4-Legged Soccer Robot.
Robocup 2005, p. 480-487
Oomes, S; Jonker, P.P; Poel, M; Visser, A & Wiering, M (2004). The Dutch AIBO Team 2004,
Proc. Robocup 2004 Symposium (July 4-5, Lisboa, Portugal, Instituto Superior
Tecnico, 2004, 1-5. see also
Parker, L.E. (1996). On the design of behavior-based multi-robot teams. Journal of Advanced
Robotics, 10(6).
Pfeifer, R & Scheier, C (1999). Understanding Intelligence. The MIT Press, Cambridge,
Massechussets, ISBN 0-262-16181-8.
Röfer, T, von Stryk, O, Brunn, R; Kallnik, M and many other (2003). German Team 2003.
Technical report (178 pages, only available online:
http://www. Germanteam.org/GT2003.pdf)
Röfer, T. & Jungel, M. (2003). Vision-based fast and reactive monte-carlo localization. In The
IEEE International Conference on Robotics and Automation, pages 856-861, 2003, Taipei,
Taiwan.
Sutton, R.S & Barto, A.G (1998). Reinforcement learning – an introduction., MIT press, 1998.
ISBN 0-262-19398-1.
Takahashi, Y & Asada, M (2004). Modular Learning Systems for Soccer Robot (Takaha-
shi04d.pdf). 2004, Osaka, Japan.
Thrun, S.; Fox, D.; Burgard, W & Dellaert (2001), F. Robust monte carlo localization for
mobile robots. Journal of Artificial Intelligence, Vol. 128, nr 1-2, page 99-141, 2001,
ISSN:0004-3702
Thrun, S. (2002). Particle filters in robotics. In The 17th Annual Conference on Uncertainty in AI
(UAI), 2002
6
A Real-Time Framework for the Vision
Subsystem in Autonomous Mobile Robots
Paulo Pedreiras
1
, Filipe Teixeira
2
, Nelson Ferreira
2
, Luís Almeida
1
,
Armando Pinho
1
and Frederico Santos
3
1
LSE-IEETA/DETI, Universidade de Aveiro, Aveiro
2
DETI, Universidade de Aveiro, Aveiro
3
DEE, Instituto Politécnico de Coimbra, Coimbra
Portugal
1. Introduction
Interest on using mobile autonomous agents has been growing (Weiss, G., 2000), (K. Kitano;
Asada, M.; Kuniyoshi, Y.; Noda, I. & Osawa E., 1997) due to their capacity to gather
information on their operating environment in diverse situations, from rescue to demining
and security. In many of these applications, the environments are inherently unstructured
and dynamic, and the agents depend mostly on visual information to perceive and interact
with the environment. In this scope, computer vision in a broad sense can be considered as
the key technology for deploying systems with an higher degree of autonomy, since it is the
basis for activities like object recognition, navigation and object tracking.
Gathering information from such type of environments through visual perception is an
extremely processor-demanding activity with hard to predict execution times (Davison, J.,
2005). To further complicate the situation many of the activities carried out by the mobile
agents are subject to real-time requirements with different levels of criticality, importance
and dynamics. For instance, the capability to timely detect obstacles near the agent is a hard
activity, since failures can result in injured people or damaged equipment, while activities
like self-localization, although important for the agent performance, are inherently soft since
extra delays in these activities simply cause performance degradation. Therefore, the
capability to timely process the image at rates high enough to allow visual-guided control or
decision-making, called real-time computer vision (RTCV) (Blake, A; Curwen, R. &
Zisserman, A., 1993), plays a crucial role in the performance of mobile autonomous agents
operating in open and dynamic environments.
This chapter describes a new architectural solution for the vision subsystem of mobile
autonomous agents that substantially improves its reactivity by dynamically assigning
computational resources to the most important tasks. The vision-processing activities are
broken into separated elementary real-time tasks, which are then associated with adequate
real-time properties (e.g. priority, activation rate, precedence constraints). This separation
allows avoiding the blocking of higher priority tasks by lower priority ones as well as to set
independent activation rates, related with the dynamics of the features or objects being
processed, together with offsets that de-phase the activation instants of the tasks to further
Vision Systems: Applications
84
reduce mutual interference. As a consequence it becomes possible to guarantee the
execution of critical activities and privilege the execution of others that, despite not critical,
have large impact on the robot performance.
The framework herein described is supported by three custom services:
• Shared Data Buffer (SDB), allowing different processes to process in parallel a set of
image buffers;
• Process Manager (PMan), which carries out the activation of the vision-dependent real-
time tasks;
• Quality of Service manager (QoS), which dynamically updates the real-time properties
of the tasks.
The SDB service keeps track of the number of processes that are connected to each image
buffer. Buffers may be updated only when there are no processes attached to them, thus
ensuring that processes have consistent data independently of the time required to complete
the image analysis.
The process activation is carried out by a PMan service that keeps, in a database, the process
properties, e.g. priority, period and phase. For each new image frame, the process manager
scans the database, identifies which processes should be activated and sends them wake-up
signals. This framework allows reducing the image processing latency, since processes are
activated immediately upon the arrival of new images. Standard OS services are used to
implement preemption among tasks.
The QoS manager monitors continuously the input data and updates the real-time
properties (e.g. the activation rate) of the real-time tasks. This service permits to adapt the
computational resources granted to each task, assuring that in each instant the most
important ones, i.e. the ones that have a greater value for the particular task being carried
out, receive the best possible QoS.
The performance of the real-time framework herein described is assessed in the scope of the
CAMBADA middle-size robotic soccer team, being developed at the University of Aveiro,
Portugal, and its effectiveness is experimentally proven.
Main
Processor
High bandwidth
sensors
Distributed sensing/
actuation system
External communication
(IEEE 802.11b)
Coordination
layer
Low-level
control layer
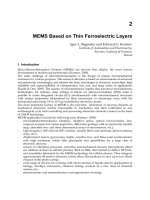
Figure 1. The biomorphic architecture of the CAMBADA robotic agents
The remainder of this chapter is structured as follows: Section 2 presents the generic
computing architecture of the CAMBADA robots. Section 3 shortly describes the working-
principles of the vision-based modules and their initial implementation in the CAMABADA
robots. Section 4 describes the new modular architecture that has been devised to enhance
the temporal behavior of the image-processing activities. Section 5 presents experimental
results and assesses the benefits of the new architecture. Finally, Section 6 concludes the
chapter.
A Real-Time Framework
for the Vision Subsystem in Autonomous Mobile Robots
85
2. The CAMBADA Computing Architecture
2.1 Background
Coordinating several autonomous mobile robotic agents in order to achieve a common goal
is currently a topic of intense research (Weiss, G., 2000), (K. Kitano; Asada, M.; Kuniyoshi,
Y.; Noda, I. & Osawa E., 1997). One initiative to promote research in this field is RoboCup
(K. Kitano; Asada, M.; Kuniyoshi, Y.; Noda, I. & Osawa E., 1997), a competition where
teams of autonomous robots have to play soccer matches.
As for many real-world applications, robotic soccer players are autonomous mobile agents
that must be able to navigate in and interact with their environment, potentially cooperating
with each other. The RoboCup soccer playfield resembles human soccer playfields, though
with some (passive) elements specifically devoted to facilitate the robots navigation. In
particular the goals have solid and distinct colors and color-keyed posts are placed in each
field corner. This type of environment can be classified as a passive information space
(Gibson, J., 1979). Within an environment exhibiting such characteristics, robotic agents are
constrained to rely heavily on visual information to carry out most of the necessary
activities, leading to a framework in which the vision subsystem becomes an integral part of
the close-loop control. In these circumstances the temporal properties of the image-
processing activities (e.g. period, jitter and latency) have a strong impact on the overall
system performance.
2.2 The CAMBADA robots computing architecture
The computing architecture of the robotic agents follows the biomorphic paradigm (Assad,
C.; Hartmann, M. & Lewis, M., 2001), being centered on a main processing unit (the brain)
that is responsible for the higher-level behavior coordination (Figure 1). This main
processing unit handles external communication with other agents and has high bandwidth
sensors (the vision) directly attached to it. Finally, this unit receives low bandwidth sensing
information and sends actuating commands to control the robot attitude by means of a
distributed low-level sensing/actuating system (the nervous system).
The main processing unit is currently implemented on a PC-based computer that delivers
enough raw computing power and offers standard interfaces to connect to other systems,
namely USB. The PC runs the Linux operating system over the RTAI (Real-Time
Applications Interface (RTAI, 2007)) kernel, which provides time-related services, namely
periodic activation of processes, time-stamping and temporal synchronization.
The agents software architecture is developed around the concept of a real-time database
(RTDB), i.e., a distributed entity that contains local images (with local access) of both local
and remote time-sensitive objects with the associated temporal validity status. The local
images of remote objects are automatically updated by an adaptive TDMA transmission
control protocol (Santos, F.; Almeida, L.; Pedreiras, P.; Lopes, S. & Facchinnetti, T., 2004)
based on IEEE 802.11b that reduces the probability of transmission collisions between team
mates thus reducing the communication latency.
The low-level sensing/actuating system follows the fine-grain distributed model (Kopetz,
H., 1997) where most of the elementary functions, e.g. basic reactive behaviors and closed-
loop control of complex actuators, are encapsulated in small microcontroller-based nodes,
interconnected by means of a network. This architecture, which is typical for example in the
automotive industry, favors important properties such as scalability, to allow the future
addition of nodes with new functionalities, composability, to allow building a complex
Vision Systems: Applications
86
system by putting together well defined subsystems, and dependability, by using nodes to
ease the definition of error-containment regions. This architecture relies strongly on the
network, which must support real-time communication. For this purpose, it uses the CAN
(Controller Area Network) protocol (CAN, 1992), which has a deterministic medium access
control, a good bandwidth efficiency with small packets and a high resilience to external
interferences. Currently, the interconnection between CAN and the PC is carried out by
means of a gateway, either through a serial port operating at 115Kbaud or through a serial-
to-USB adapter.
3. The CAMBADA Vision Subsystem
The CAMBADA robots sense the world essentially using two low-cost webcam-type
cameras, one facing forward, and the other pointing the floor, both equipped with wide-
angular lenses (approximately 106 degrees) and installed at approximately 80cm above the
floor. Both cameras are set to deliver 320x240 YUV images at a rate of 20 frames per second.
They may also be configured to deliver higher resolution video frames (640x480), but at a
slower rate (typically 10-15 fps). The possible combinations between resolution and frame-
rate are restricted by the transfer rate allowed by the PC USB interface.
The camera that faces forward is used to track the ball at medium and far distances, as well
as the goals, corner posts and obstacles (e.g. other robots). The other camera, which is
pointing the floor, serves the purpose of local omni-directional vision and is used for mainly
for detecting close obstacles, field lines and the ball when it is in the vicinity of the robot.
Roughly, this omni-directional vision has a range of about one meter around the robot.
All the objects of interest are detected using simple color-based analysis, applied in a color
space obtained from the YUV space by computing phases and modules in the UV plane. We
call this color space the YMP space, where the Y component is the same as in YUV, the M
component is the module and the P component is the phase in the UV plane. Each object
(e.g., the ball, the blue goal, etc.) is searched independently of the other objects. If known,
the last position of the object is used as the starting point for its search. If not known, the
center of the frame is used. The objects are found using region-growing techniques.
Basically, two queues of pixels are maintained, one used for candidate pixels, the other used
for expanding the object. Several validations can be associated to each object, such as
minimum and maximum sizes, surrounding colors, etc.
Two different Linux processes, Frontvision and Omnivision, handle the image frames
associated with each camera. These processes are very similar except for the specific objects
that are tracked. Figure 2 illustrates the actions carried out by the Frontvision process. Upon
system start-up, the process reads the configuration files from disk to collect data regarding
the camera configuration (e.g. white balance, frames-per-second, resolution) as well as object
characterization (e.g. color, size, validation method). This information is then used to
initialize the camera and other data structures, including buffer memory. Afterwards the
process enters in the processing loop. Each new image is sequentially scanned for the
presence of the ball, obstacles, goals and posts. At the end of the loop, information regarding
the diverse objects is placed in a real-time database.
The keyboard, mouse and the video framebuffer are accessed via the Simple DirectMedia
Layer library (SDL) (SDL, 2007). At the end of each loop the keyboard is pooled for the
presence of events, which allows e.g. to quit or dynamically change some operational
parameters
A Real-Time Framework
for the Vision Subsystem in Autonomous Mobile Robots
87
Initializations:
- Read configuration files
(Cameras, Objects)
- Open and set-up camera devices
- Initialize data structures
- Initialize SDL
Sleep
Search Obstacles
Search Ball
Search Goals
Search Posts
Update RTDB
Handle keyboard events
New image
ready
Figure 2. Flowchart of the Frontvision process
0
10
20
30
40
50
60
70
0 5 10 15 20 25 30 35 40
Number of activations (%)
Time (ms)
Process execution time
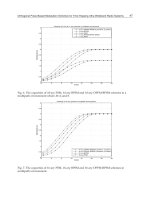
Figure 3. Ball tracking execution time histogram
4. A Modular Architecture for Image Processing: Why and How
As referred to in the previous sections, the CAMBADA robotic soccer players operate in a
dynamic and passive information space, depending mostly on visual information to
perceive and interact with the environment. However, gathering information from such
type of environments is an extremely processing-demanding activity (DeSouza, G & Kak,
A., 2004), with hard to predict execution times. Regarding the algorithms described in
Section 3, it could be intuitively expected to observe a considerable variance in process
Vision Systems: Applications
88
execution times since in some cases the objects may be found almost immediately, when
their position between successive images does not change significantly, or it may be
necessary to explore the whole image and expand a substantial amount of regions of
interest, e.g. when the object disappears from the robot field of vision (Davison, J., 2005).
This expectation is in fact confirmed in reality, as depicted in Figure 3, which presents a
histogram of the execution time of the ball tracking alone. Frequently the ball is located
almost immediately, with 76.1% of the instances taking less than 5ms to complete. However,
a significant amount of instances (13.9%) require between 25ms and 35ms to complete and
the maximum observed execution time was 38,752 ms, which represents 77.5% of the inter-
frame period just to process a single object.
Figure 4. Modular software architecture for the CAMBADA vision subsystem
As described in Section 3, the CAMBADA vision subsystem architecture is monolithic with
respect to each camera, with all the image-processing carried out within two processes
designated Frontvision and Omnivision, associated with the frontal and omnidirectional
cameras, respectively. Each of these processes tracks several objects sequentially. Thus, the
following frame is acquired and analyzed only after tracking all objects in the previous one,
which may take, in the worst case, hundreds of milliseconds, causing a certain number of
consecutive frames to be skipped. These are vacant samples for the robot controllers that
degrade the respective performance and, worse, correspond to black-out periods in which
the robot does not react to the environment. Considering that, as discussed in Section 3,
some activities may have hard deadlines, this situation becomes clearly unacceptable.
Increasing the available processing power, either trough the use of more powerful CPUs or
via specialized co-processor hardware could, to some extent, alleviate the situation (Hirai,
S.; Zakouji, M & Tsuboi, T., 2003). However, the robots are autonomous and operate from
batteries, and thus energy consumption aspects as well as efficiency in resource utilization
render brut-force approaches undesirable.
4.1 Using Real-Time Techniques to Manage the Image Processing
As remarked in Section 1, some of the activities carried out by the robots exhibit real-time
characteristics with different levels of criticality, importance and dynamics. For example, the
latency of obstacle detection limits the robots maximum speed in order to avoid collisions
with the playfield walls. Thus, the obstacle detection process should be executed as soon as
possible, in every image frame, to allow the robot to move as fast as possible in a safe way.
On the other hand, detecting the corner poles for localization is less demanding and can
span across several frames because the robot velocity is limited and thus, if the localization
A Real-Time Framework
for the Vision Subsystem in Autonomous Mobile Robots
89
process takes a couple of frames to execute its output is still meaningful. Furthermore
prediction methods (Iannizzotto, G., La Rosa, F. & Lo Bello, L., 2004) combined with
odometry data may also be effectively used to obtain estimates of object positions between
updates. Another aspect to consider is that the pole localization activity should not block the
more frequent obstacle detection. This set of requirements calls for the encapsulation of each
object tracking activity in different processes as well as for the use of preemption and
appropriate scheduling policies, giving higher priority to most stringent processes. These
are basically the techniques that were applied to the CAMBADA vision subsystem as
described in the following section.
4.2 A Modular Software Architecture
Figure 4 describes the software modular architecture adopted for the CAMBADA vision
subsystem. Standard Linux services are used to implement priority scheduling, preemption
and data sharing.
Associated to each camera there is one process (ReadXC) which transfers the image frame
data to a shared memory region where the image frames are stored. The availability of a
new image is fed to a process manager, which activates the object detection processes. Each
object detection process (e.g. obstacle, ball), generically designated by proc_obj:x, x={1,2,…n}
in Figure 4, is triggered according to the attributes (period, phase) stored in a process
database. Once started, each process gets a link to the most recent image frame available and
starts tracking the respective object. Once finished, the resulting information (e.g. object
detected or not, position, degree of confidence, etc.) is placed in a real-time database
(Almeida, L.; Santos, F.; Facchinetti; Pedreiras, P.; Silva, V. & Lopes, L., 2004), identified by
the label “Object info”, similarly located in a shared memory region. This database may be
accessed by any other processes on the system, e.g. to carry out control actions. A display
process may also be executed, which is useful mainly for debugging purposes.
4.2.1 Process Manager
For process management a custom library called PMan was developed. This library keeps a
database where the relevant process properties are stored. For each new image frame, the
process manager scans the database, identifies which processes should be activated and
sends them pre-defined wake-up signals.
Table 1 shows the information about each process that is stored in the PMan database.
The process name and process pid fields allow a proper process identification, being used to
associate each field with a process and to send OS signals to the processes, respectively. The
period and phase fields are used to trigger the processes at adequate instants. The period is
expressed in number of frames, allowing each process to be triggered every n frames. The
phase field permits de-phasing the process activations in order to balance the CPU load over
time, with potential benefits in terms of process jitter. The deadline field is optional and
permits, when necessary, to carry out sanity checks regarding critical processes, e.g. if the
high-priority obstacle detection does not finish within a given amount of time appropriate
actions may be required to avoid jeopardizing the integrity of the robot. The following
section of the PMan table is devoted to the recollection of statistical data, useful for profiling
purposes. Finally, the status field keeps track of the instantaneous process state (idle,
executing).
Vision Systems: Applications
90
Process identification
PROC_name Process ID string
PROC_pid Process id
Generic temporal properties
PROC_period Period ( frames)
PROC_phase Phase (frames)
PROC_deadline
Deadline (μs)
QoS management
PROC_qosdata QoS attributes
PROC_qosupdateflag QoS change flag
Statistical data
PROC_laststart Activation instant of last instance
PROC_lastfinish Finish instant of last instance
PROC_nact Number of activations
PROC_ndm Number of deadline misses
Process status
PROC_status Process status
Table 1. PMan process data summary
The PMan services are accessed by the following API:
• PMAN_init: allocates resources (shared memory, semaphores, etc) and initializes the
PMan data structures;
• PMAN_close: releases resources used by PMan;
• PMAN_procadd: adds a given process to the PMan table;
• PMAN_procdel: removes one process from the PMan table;
• PMAN_attach: attaches the OS process id to an already registered process, completing
the registration phase;
• PMAN_deattach: clears the process id field from a PMan entry;
• PMAN_QoSupd: changes the QoS attributes of a process already registered in the
PMan table;
• PMAN_TPupd: changes the temporal properties (period, phase or deadline) of a
process already registered in the PMan table;
• PMAN_epilogue: signals that a process has terminated the execution of one instance;
• PMAN_query: allows to retrieve statistical information about one process;
• PMAN_tick: called upon the availability of every new frame, triggering the activation
of processes.
The PMan service should be initialized before use, via the init function. The service uses OS
resources that require proper shutdown procedures, e.g. shared memory and semaphores,
and the close function should be called before terminating the application. To register in the
PMan table, a process should call the add function and afterwards the attach function. This
separation permits a higher flexibility since it becomes possible to have each process
registering itself completely or to have a third process managing the overall properties of
the different processes. During runtime the QoS allocated to each process may be changed
with an appropriate call to QoSupd function. Similarly, the temporal properties of one
A Real-Time Framework
for the Vision Subsystem in Autonomous Mobile Robots
91
process can also be changed dynamically by means of the TPupd function. When a process
terminates executing one instance it should report this event via the epilogue call. This
action permits maintaining the statistical data associated with each process as well as
becoming aware of deadline violations. The query call allows accessing the statistical data of
each process registered in the database. This information can be used by the application for
different purposes like profiling, load management, etc. Finally, the tick call is triggered by
the process that interacts with the camera and signals that a new frame is ready for
processing. As a consequence of this call the PMan database is scanned and the adequate
processes activated.
4.2.2 Shared Data Buffers
As discussed previously, the robot application is composed by several processes which
operate concurrently, each seeking for particular features in a given frame. The complexity
of these activities is very dissimilar and consequently the distinct processes exhibit
distinctive execution times. On the other hand the execution time of each process may also
vary significantly from instance to instance, depending on the particular strategy followed,
on the object dynamics, etc Consequently, the particular activation instants of the processes
cannot be predicted beforehand. To facilitate the sharing of image buffers in this framework
a mechanism called Shared Data Buffers (SDB) was implemented. This mechanism is similar
to the Cyclic Asynchronous Buffers (Buttazzo, G.; Conticelli, F.; Lamastra, G. & Lipari, G.,
1997), and permits an asynchronous non-blocking access to the image buffers. When the
processes request access to an image buffer automatically receive a pointer to the most
recent data. Associated to each buffer there is a link count which accounts for the number of
processes that are attached to each buffer. This mechanism ensures that the buffers are only
recycled when there are no processes attached to them, and so the processes have no
practical limit to the time during which they can hold a buffer.
The access to the SDB library is made trough the following calls:
• SDB_init: reserves and initializes the diverse data structures (shared memory,
semaphores, etc);
• SDB_close: releases resources associated with the SDB;
• SDB_reserve: returns a pointer to a free buffer;
• SDB_update: signals that a given buffer was updated with new data;
• SDB_getbuf: requests a buffer for reading;
• SDB_unlink: access to the buffer is no longer necessary.
The init function allocates the necessary resources (shared memory, semaphores) and
initializes the internal data structures of the SDB service. The close function releases the
resources allocated by the init call, and should be executed before terminating the
application. When the camera process wants to publish a new image it should first request a
pointer to a free buffer, via the reserve call, copy the data and then issue the update call to
signal that a new frame is available. Reader processes should get a pointer to a buffer with
fresh data via the getbuf call, which increments the link count, and signal that the buffer is
no longer necessary via the unlink call, which decrements the buffer link count.
4.2.3 Dynamic QoS management
As in many other autonomous agent applications, the robotic soccer players have to deal
with an open and dynamic environment that cannot be accurately characterized at pre-
Vision Systems: Applications
92
runtime. Coping efficiently with this kind of ambiance requires support for dynamic
reconfiguration and on-line QoS management (Burns, A; Jeffay, K.; Jones, M. et al, 1996).
These features are generally useful to increase the efficiency in the utilization of system
resources (Buttazzo, G.; Lipari, G., Caccamo, M. & Abeni. L., 2002) since typically there is a
direct relationship between resource utilization and delivered QoS. In several applications,
assigning higher CPU to tasks increases the QoS delivered to the application. This is true, for
example, in control applications (Buttazzo, G. & Abeni, L., 2000), at least within certain
ranges (Marti, P., 2002), and in multimedia applications (Lee, C.; Rajkumar, R. & Mercer, C.,
1996). Therefore, managing the resources assigned to tasks, e.g. by controlling their
execution rate or priority, allows a dynamic control of the delivered QoS. Efficiency gains
can be achieved in two situations: either maximizing the utilization of system resources to
achieve a best possible QoS for different load scenarios or adjusting the resource utilization
according to the application instantaneous QoS requirements, i.e. using only the resources
required at each instant.
Process
Period
(ms)
Priority
Offset
(ms)
Purpose
Ball_Fr 50 35 0 Ball tracking (front camera)
BGoal / YGoal 200 25 50/150 Blue / Yellow Goal tracking
BPost / YPost 800 15 100/200 Blue / Yellow Post tracking
Avoid_Fr 50 45 0 Obstacle avoidance (front cam.)
Ball_Om 50 40 0 Ball tracking (omni camera)
Avoid_Om 50 45 0 Obstacle avoidance (omni camera)
Line 400 20 0 Line tracking and identification
Table 2. Process properties in the modular architecture
Both situations referred above require an adequate support from the computational
infrastructure so that the relevant parameters of tasks can be dynamically adjusted. Two of
the functions implemented by the PMAN library, namely PMAN_TPupd and
PMAN_QoSupd, allow changing dynamically and without service disruption the temporal
properties of each process (period, phase and deadline) and to manage additional custom
QoS properties (the Linux real-time priority in this case), respectively. The robots decision
level uses this interface to adjust the individual process attributes in order to control the
average CPU load and to adapt the rates and priorities of the diverse processes according to
the particular role that the robots are playing in each instant.
5. Experimental Results
In order to assess the performance of the modular approach and compare it with the initial
monolithic one, several experiments were conducted, using a PC with an Intel Pentium III
CPU, running at 550MHz, with 256MB of RAM. This PC has lower capacity than those
typically used on the robots but allows a better illustration of the problem addressed in this
chapter. The PC runs a Linux 2.4.27 kernel, patched with RTAI 3.0r4. The image-capture
devices are Logitech Quickcams, with a Philips chipset. The cameras were set-up to produce
320*240 images at a rate of 20 frames-per-second (fps). The time instants were measured
accessing the Pentium TSC. To allow a fair comparison all the tests have been executed over
the same pre-recorded image sequence.
A Real-Time Framework
for the Vision Subsystem in Autonomous Mobile Robots
93
5.1 Monolithic Architecture assessment
The code of the Frontvision and Omnivision processes (Section 3) was instrumented to
measure the start and finishing instants of each instance.
Process Max.
(ms)
Min.
(ms)
Avg.
(ms)
St.Dev.
(ms)
FrontVision 143 29 58 24
OmniVision 197 17 69 31
Table 3. FrontVision and OmniVision inter-activation statistical figures
Figure 5 presents the histogram of the inter-activation intervals of both of these processes
while Table 3 presents a summary of the relevant statistical figures.
0
2
4
6
8
10
12
14
16
18
0 50 100 150 200
Number of activations (%)
Time (ms)
Process interactivation time
0
2
4
6
8
10
12
14
16
18
20
0 50 100 150 200
Number of activations (%)
Time (ms)
Process interactivation time
Figure 5. Histogram of the inter-activation time of the FrontVision (top) and OmniVision
(bottom) processes
The response time of both processes exhibits a substantial variance, with inter-activation
times ranging from 17ms to near 200ms and an average inter-activation time of 58ms and
69ms, respectively. Remembering that the image acquisition rate is 20 fps, corresponding to
50ms between frames, these figures indicate a poor performance. In fact the image
processing is part of the control loop and so the high jitter leads to a poor control
performance, a situation further aggravated by the significant amount of dropped frames,
which correspond to time lapses during which the robot is completely non-responsive to the
environment.
5.2 Modular Architecture
The different image-processing activities have been separated and wrapped in different
Linux processes, as described in Section 4. Table 2 shows the periods, offsets and priorities
assigned to each one of the processes.
The obstacle avoidance processes are the most critical ones since they are responsible for
alerting the control software of the presence of any obstacles in the vicinity of the robot,
allowing it to take appropriate measures when necessary, e.g. evasive maneuvers or
immobilization.
Therefore these processes are triggered at a rate equal to the camera frame rate and receive
the highest priority, ensuring a response-time as short as possible. It should be noted that
these processes scan restricted image regions only, looking for specific features, thus their
execution time is bounded and relatively short. In the experiments the measured execution
Vision Systems: Applications
94
time was bellow 5ms for each one of the processes, therefore this architecture allows
ensuring that every frame will be scanned for the presence of obstacles.
0
10
20
30
40
50
60
70
80
40 45 50 55 60
Number of activations (%)
Time (ms)
Process interactivation time
0
5
10
15
20
25
30
35
40 45 50 55 60
Number of activations (%)
Time (ms)
Process interactivation time
Figure 6. Front (left) and omni-directional (right) obstacle detection processes inter-
activation intervals
0
10
20
30
40
50
60
20 30 40 50 60 70 80
Number of activations (%)
Time (ms)
Process interactivation time
0
5
10
15
20
25
30
35
40
20 30 40 50 60 70 80
Number of activations (%)
Time (ms)
Process interactivation time
0
5
10
15
20
25
30
35
40
20 30 40 50 60 70 80
Number of activations (%)
Time (ms)
Process interactivation time
Figure 7. Omni-directional (left) and frontal (right) camera ball tracking processes inter-
activation intervals
0
5
10
15
20
25
200 250 300 350 400 450 500 550 600
Number of activations (%)
Time (ms)
Process interactivation time
0
5
10
15
20
400 500 600 700 800 900 1000 1100 1200
Number of activations (%)
Time (ms)
Process interactivation time
Figure 8. Line (left) and yellow post (right) tracking processes inter-activation intervals
The second level of priority is granted to the Ball_Om process, which tracks the ball in the
omni-directional camera. This information is used when approaching, dribbling and kicking
the ball, activities that require a low latency and high update rate for good performance.
A Real-Time Framework
for the Vision Subsystem in Autonomous Mobile Robots
95
Therefore this process should, if possible, be executed on every image frame, thus its period
was also set to 50ms.
The third level of priority is assigned to the Ball_Fr process, responsible for locating the ball
in the front camera. This information is used mainly to approach the ball when it is at
medium to far distance from the robot. Being able to approach the ball quickly and
smoothly is important for the robot performance but this process is more delay tolerant than
the Ball_Om process, thus it is assigned a lower priority.
Process
Max.
(ms)
Min.
(ms)
Average
(ms)
Standard deviation
(ms)
Avoid_Fr 60.1 48.9 50.0 0.5
Avoid_Om 60.1 45.9 50.0 1.6
Ball_Om 60.1 46.0 50.0 1.6
Ball_Fr 80.0 19.9 50.0 2.1
Ygoal 362.2 61.1 207.9 58.3
BGoal 383.9 60.9 208.4 66.6
Line 564.7 235.6 399.9 71.9
BPost 1055.8 567.9 799.9 87.2
YPost 1156.4 454.4 799.6 114.3
Table 4. Modular architecture statistical data of inter-activation intervals
Some objects are stationary with respect to the play field. Furthermore, the robot localization
includes an odometry subsystem that delivers accurate updates of the robot position during
limited distances. This allows reducing the activation rate and priority of the processes
related with the extraction of these features, without incurring in a relevant performance
penalty. This is the case of BGoal and YGoal processes, which track the position of the blue
and yellow goals, respectively, which were assigned a priority of 25 and a period of 200ms,
i.e., every 4 frames.
The field line detection process (Line) detects and classifies the lines that delimit the play
field, pointing specific places in it. This information is used only for calibration of the
localization information and thus may be run sparsely (400ms). Post detection processes
(BPost and YPost) have a similar purpose. However, since the information extracted from
them is coarser than from the line detection, i.e., it is affected by a bigger uncertainty degree,
it may be run at even a lower rate (800ms) without a relevant performance degradation.
The offsets of the different processes have been set-up to separate their activation as much
as possible. With the offsets presented in Table 2, besides the obstacle and ball detection
processes run every frame, no more than two other processes are triggered simultaneously.
This allows minimizing mutual interference and thus reducing the response-time of lower
priority processes.
Figure 6, Figure 7 and Figure 8 show the inter-activation intervals of selected processes,
namely obstacle, ball, line and yellow post tracking, which clearly illustrate the differences
between the modular and the monolithic architectures regarding the processes temporal
behavior. The processes that receive higher priority (obstacle detection, Figure 6) exhibit a