Encycopedia of Materials Characterization (surfaces_ interfaces_ thin films) - C. Brundle_ et al._ (BH_ 1992) WW Part 9 pps
Bạn đang xem bản rút gọn của tài liệu. Xem và tải ngay bản đầy đủ của tài liệu tại đây (1.51 MB, 60 trang )
13
B.
E.
Koel.
ScanningEkctron Microscopy
1985/N,
1421,1985.
The use
of
HREELS
to
determine molecular structure in adsorbed hydrocarbon
monolayers.
14
J.
L. Erskine.
CRC
Crit.
Rev.
Solid
State Mutez Sci.
13,311, 1987.
Recent
review
of
scattering mechanisms, surfice phonon properties,
and
improved instrumentation.
8.3
HREELS
459
8.4
NMR
Solid State Nuclear Magnetic Resonance
HELLMUT
ECKERT
Contents
Introduction
Basic Principles
Structural and Chemical Information from
Instrumentation
Practical Aspects and Limitations
Quantitative Analysis
Conclusions
Solid State NMR Line Shapes
Introduction
Solid state NMR is a relatively recent spectroscopic technique that can be used to
uniquely identltj, and quantitate crystalline phases in bulk materials and at
s&s
and interfaces. Whiie
NMR
resembles X-ray diffraction in this capacity, it
has
the
additional advantage
of
being element-selective and inherently quantitative. Since
the signal observed is a direct reflection
of
the local environment
of
the element
under study, NMR can
also
provide
structural
insights on a
mokcukzr
level. Thus,
information about coordination numbers,
local
symmetry, and internuclear bond
distances is readily available. This feature is particularly useful in the structural
analysis
of
highly disordered, amorphous, and compositionally complex systems,
where diffraction techniques and other spectroscopies (IR, Raman,
EXAFS)
often
fail.
Due
to
these virtues, solid state NMR is finding increasing
use
in the structural
analysis
of
polymers, ceramics and glasses, composites, catalysts, and
surfaces.
460
VIBRATIONAL SPECTROSCOPIES
Chapter
8
Examples of the unique insights obtained by solid state
NMR
applications to mate-
rials science include: the Si/Al distribution in zeolites,' the hydrogen microstruc-
ture in amorphous films of hydrogenated silicon,* and the mechanism
for
the
zeolite-catalyzed oligomerization of 01efins.~
Basic
Principles
Nuclear Magnetism and Magnetic Resonance
NMR spectroscopy exploits the magnetism
of
certain nuclear isotopes.u Nuclei
with odd mass, odd atomic number,
or
both possess a permanent magnetic
moment, which can be detected by applying an external magnetic field (typical
strength in
NMR
applications:
1-14
Tesla). Quantum mechanics states that the
magnetic moments adopt only certain discrete orientations relative to the field's
direction. The number of such discrere orientations is
21
+1,
where
I,
the nuclear
spin quantum number, is a half-integral or integral constant.
For
the common case
I
=
Yz,
two
distinct orientations (states)
result,
with
quantized components of the
nuclear spin parallel and antiparallel to the field direction. Since the parallel orien-
tations are energetically more hvorable than the antiparallel ones, the populations
of both states are unequal.
As
a consequence, a sample placed in a magnetic field
develops a macroscopic magnetization
Mo.
This magnetization forms the source of
the spectroscopic signal measured.
In NMR spectroscopy the precise energy differences between such nuclear mag-
netic states are of interest. To measure these differences, electromagnetic waves in
the radiofrequency region
(1-600
MHz) are applied, and the frequency at which
transitions occur between the states,
is
measured. At resonance the condition
holds, where
w
is the frequency of the electromagnetic radiation at which absorp-
tion occurs. The strength of the magnetic field present at the nuclei
q,,
is generally
very close to the strength of the externally applied magnetic field
4
but differs
slightly from
it
due to internal fields
kt
arising from surrounding nuclear mag-
netic moments and electronic environments. The factor
y,
the gyromagnetic ratio,
is a characteristic constant for the nuclear isotope studied and
ranges
fiom
lo6
to
lo8
rad/Tesla-s. Thus,
NMR
experiments are always element-selective, since at a
given field strength each nuclear isotope possesses
a
unique range
of
resonance fre-
quencies.
Measurement and Observables
Figure
1
shows the detailed steps of the measurement, from the perspective of
a
coordinate system rotating with the applied radiofrequency
00
=
y&.
The sample is
in the magnetic field, and is placed inside an inductor of a radiofrequency circuit
8.4
NMR
461
equllibriurn
rf
applicatlon
(ps)
90'
fllp
slgnal Induction return
to
equillbrium repeat sequence
and decay
(-ms)
5
times
TI
b
90'
Wlse
Figure
1
Detection
of
NMR
signals (a), shown
in
the rotating coordinate system associ-
ated
with
the oscillating magnetic field component
B,
at the applied radiofre-
quency
cu,
at
various stages
(+t,)
of
the experiment:
to,
spin system
with
magnetization
(fat
arrow)
at
equilibrium;
t,,
irradiation
of
the
B,
field orthog-
onal to the magnetization direction tips the magnetization;
%,
the system
after a
90"
pulse resulting in transverse magnetization
M,;
s,
off-resonance
precession and free induction decay
in
the signal acquisition period following
the pulse; and
t,,
return to
spin
equilibrium after rpinqattice relaxation; tim-
ing diagram
of
the experiment (b), followed by Fourier transformation.
tuned to the resonance frequency of the nucleus under observation. The magnetiza-
tion present at time is then detected by applying a short, intense
(100-1000
W)
radiofrequency pulse (typically
1-10
ps)
in a direction perpendicular to
B,
(tl).
The
oscillating magnetic component
of
the radiofrequency pulse stimulates transitions
between the magnetic states and tips
Mo
into the plane perpendicular
to
the direc-
tion of the magnetic field
(90'
pulse,
5).
Following this pulse, the magnetization
oscillates in this plane at the transition frequency
o
and also decays in time due to
the various internal interactions present
(g).
It thereby induces
an
ac voltage signal
in a coil, which is amplified, digitized, and acquired over a typical period of several
ms
(5).
Fourier transformation of this free induction decay (FID) signal then
results in the
NMR
spectrum,
a
plot of absorption intensity versus frequency. The
position, width, and shape of the spectral peaks reflect the local fields present at the
nuclei due to internal interactions and
allow
various chemical conclusions. The area
under a spectral peak is directly proportional to the number
of
nuclei contributing
to the resonance, and can be used for quantification purposes.
462
VIBRATIONAL SPECTROSCOPIES Chapter
8
x
Y
Figure
2
Schematic illustration of the influence
of
chemical shift upon
NMR
spectra.
See text for further explanation.
Since typical NMR signals are quite weak, extensive signal averaging by repeti-
tive scanning is generally necessary. The pulsing rate at which this
can
occur
depends on the time it takes for the spin system to return into its initial state after
the
90"
pulse, with
Mo
along the magnetic field direction
(t4).
This process can gen-
erally be described by first-order kinetics. The associated time constant
7-1,
the
spin-lattice relaxation time, can vary from a few ms to several hours in solids.
Structural and Chemical Information from Solid State
NMR
Line shapes
Internal Interactions
What makes
NMR
so
usell for addressing structural questions in solids is the fact
that
B1,,,
and
hence the resonance frequency
O,
are influenced by various types of
internal interactions. These are a direct reflection of the local structural and chemi-
cal
bonding environments
of
the nuclei studied, and hence are of central chemical
6
interest. Generally, the observed nuclei experience three types of interactions:
magnetic dipok-dipole interactions
with the magnetic moments from other, nearby
nuclei;
chemical
sbzj
interactions
with the magnetic fields from the electron clouds
that surround the nuclei; and (for nuclei with spin
>
M)
electric
qdrupole
interac-
tions
with electrostatic field gradients generated by the chemical bonding environ-
ment. Each of these interactions is characterized by a few spectroscopic parameters,
which are listed in Table
1.
Typically, these parameters are extracted from experi-
mental spectra by computer-fitting methods
or
are measured by
seiectiVe averaging
techniques.
Due to the simultaneous presence of all three interactions, the resulting solid
state NMR spectra can be quite complex. Fortunately, however, in many cases one
interaction mechanism is dominant, resulting in spectra that yield highly specific
information about local symmetry and bonding. In the following, we will discuss
an application of the chemical
sh&
anisotropy. Figure
2
illustrates that the aniso-
tropic interaction between the molecule and the externally applied magnetic field
8.4
NMR
463
Interaction
Parameters
NMR
measurement
Sd
rignilicance
Chemical
shifi
(isotropic
component)
Chemical shift
anisotropy
Dipoldipole
(homonuclear)
Dipoldipole
(heteronuclear)
Nuda
electric
quadrupole
6i,
Magic-angle spinning
6w?
6Jy3
L
Line-shape analysis
MAS-sidebands
M2(horno)
Spin-echo NMR
(rnean-squared
local
field)
M2(hetero)
Spin-echo double
resonance
(SEDOR)
QCC(quadrupde
Line-shape
analysis,
coupling constant), nutation NMR
(asymmetry
Fa)
Chemical bonding
coordination
number
Coordination
symmetry
Internuclear
distances,
number
of
surrounding nuclei
Coordination
Symmetry
Table
1
Interactions
in
solid
state
NMR.
parameters,
their
selective
measurement
and
their
structural
significance.
induces local magnetic
field
Components
4,
I$,
and
4
along
the
x-,
y,
and
z-
directions of
a
molecular axis system. Quite generally,
4
#
By
z
L&
The vector
sum
of these components produces a resultant
qnt
along the direction of
4,
the
axis
of
quantization, and hence affects the resonance condition.
As
seen in Figure
2,
the
magnitude
of
Bmt
(and hence the resonance frequency) will depend crucially on the
orientation
(0,
@)
of this molecular
axis
system relative to the magnetic field direc-
tion.
In a polycrystalline
or
amorphous material, the orientational statistics lead to a
distribution
of
resonance conditions. Generally, we
can
distinguish three situa-
tions, illustrated in
Figure
3a-c:
The
spectrum
in Figure
3c
is
observed for com-
pounds with asymmetric chemical environments. It shows three distinct features,
which can be identified with the different Cartesian chemical shift components
a,,
aV,
and
6,
in the molecular
axis
system. Figure 3b corresponds
to
the case of cylin-
drical
symmetry,
where
S,
=
f
&,
and hence only
two
distinct line
shape
com-
chemical shift is the same in
all
three directions. Accordingly, the solid state
NMR
spectrum consists
of
only a single peak (see Figure 3a). The values of
6ii
extracted
ponents appear. Finally, for c
Y
emical environments
with
spherical Symmetry the
464
VIBRATIONAL
SPECTROSCOPIES
Chapter
8
a
b
C
Figure
3
Characteristic solid
state
NMR
line shapes, dominated by the chemical
shift
anisotropy. The spatial distribution
of
the chemical shift is assumed to be
spherically symmetric (a), axially symmetric
(b),
and completely asymmetric
(c).
The toptrace
shows
theoretical line shapes, while the bottom trace shows
"real" spectra influenced
by
broadening
effects
due to dipolet-dipole
couplings.
fiom the spectra usually
are
reported
in
ppm relative
to
a
standard reference com-
pound.
By
definition,
An Example: Chemical Shift Anisotropy in Solid Vanadium Compounds
Figure
4
shows representative solid state
51V
NMR
spectra of crystalline vanadates.
Each model compound
typifies
a certain
local
vanadium environment with welt
defined symmetry
as
shown. One
can
see
fiom these representative
data
that the
solid
state
51V
chemical
shii
anisotropies
are
uniquely well
suited
for Merentiat-
ing
between the various
site
symmetries.
V04-3
groups
with
approximate spherical
symmetry
yield
singlepeak spectra, dimeric
V2074
groups (which
possess
a
three-
fold axis and hence cylindrical symmetry) yield spectra resembling Figure
3b,
while
the spectra
of
the completely asymmetric
V021202-
groups are
of
the kind shown
in Figure
3c.
Highly diagnostic line shapes are also observed for vanadium in
dis-
torted octahedral environments (ZnV,O,) and in square-pyramidal environments
(v205)-
An Application: 51V
NMR
of
V oxide
films
on metal oxide
supports
Investigations carried out within
the
past
few years
have revealed that multicompo-
nent metal oxide
systems
may interact
at
interf$ces by having one component form
a two-dimensional metal oxide overlayer
on
the second metal oxide component.
For example,
vanadium
oxide
can
be dispersed on Ti02,
Zr02,
SiO2,
Al203,
and
8.4
NMR
465
n
o+-
J
i___
.
v205
0’-
II,III,III
I,,
I,, I,, I,,
I,,
,,,
200
0
-200
-400
-600
-800
-1000
-1200
-1400
PPM
Figure4 Local microstructures and experimental solid
state
”V
NMR
spectra in
crystalline vanadium oxide compounds.
other
oxide supports by impregnating the latter
with
a liquid molecular precursor
and following with calcination. Many of these systems are potent oxidation cata-
lysts,
with significant inherent advantages
to
bulk
V205.
To
explore a relationship
between the catalytic activity and
structural
properties, extensive
solid
state
51V
NMR
studies
have been carried out on these phases.* These
studies
have benefited
greatly from the chemical
shift
systematics
discussed
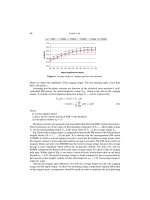
above. Figure
5
shows experi-
mental spectra
of
V
surface
oxide
on
y.Al203
support. In conjunction with the
model compound
work
one can conclude that
two
distinctly different vanadia
spe-
cies
are
present at the surfice: At
low
vanadia contents, a four-coordinated chain-
type species dominates, whereas with increasing surfice coverage
a
new site emerges
whose spectroscopic parameters reveal the presence of a distorted octahedral vana-
dium environment. Similar trends have been seen with other metal oxide supports,
466
VIBRAT:ONAL
SPECTROSCOPIES
Chapter
8
1.0
(0.05)
200
0
-200
-400
-600
-800
-1000
-1200
ppm
Figure 5
Solid state
51V
NMR
spectra
of
Vanadium oxide on ralumina as a function of
vanadium loading
(wt.%)
and surface coverage
0.
Note the gradual emergence
of
the six-coordinated vanadium
site
with increased loading.
although the type of vanadium environment in the overlayer also depends strongly
on the acidity
of
the surface.
Selecthe
Averaging Techniques
In general, the specific information that can be obtained from a simple solid state
NMR experiment depends on the “personality” of the nuclear isotope under study.
In many cases, solid state NMR spectra are not
as
straightforwardly interpretable
as
in the preceding example. Furthermore, disordered materials, such
as
thin
films,
8.4
NMR
467
-300
-400
-500
-600
-700
-800
-900
PPM
Figure
6
Solid
state
51V static and magic-angle spinning
NMR
spectra
of
a-Mg2V20,.
This
compound has two crystallographically distinct vanadium
sites.
While
the
static spectrum is a superposition
of
two powder patterns
of
the kind
shown in Figure
3,
MAS leads to well-resolved sharp resonances.
Weak
peaks
denoted by asterisks are spinning sidebands due to
the
quadrupolar interac-
tion.
glasses,
and
composites, often show only broad
and
unresolved spectra, because in
such samples the spectroscopic parameters are subject to distribution effects. Here,
the diagnostic character of solid state
NMR
can
be enhanced dramatically by selec-
tive averaging techniques. The idea is to simplify the spectra by suppressing certain
interactions while preserving others for analysis. The most popular
and
most widely
applied experiment is to acquire the NMR spectrum while rotating the sample rap-
idly about
an
axis
inclined by
54.7"
(the "magic" angle) relative to the magnetic
field direction.
This
technique, called Magic-Angle Spinning
(MAS),
results in an
average molecular orientation of
0
=
54.7"
relative to the magnetic field over the
rotation period, regardless of the initial molecular orientation. Theory predicts that
at this specific angle the anisotropy of
all
internal interactions (which scale with the
factor
3c0s~e-l)
vanishes. Consequently,
MAS
converts broad powder patterns of
the kind shown in Figure 3a-c into highly resolved sharp resonances that
can
be
straightforwardly assigned
to
individual sites. For example, Figure
6
illustrates the
superior ability
of
MAS
to resolve the crystallographically distinct vanadium sites
in
the model compound a-Mg2V207. The high resolution obtained by
MAS
and the
simplicity
of
the spectra make solid state NMR a particularly useful technique
fbr
identifying crystalline phases in the bulk
or
at surhces and interfaces.
A
number of other, more sophisticated, selective averaging tools (including spin
echo,
double resonance and two-dimensional techniques) are available, both for
spectral editing purposes and for obtaining quantitative information about inter-
468
VIBRATIONAL
SPECTROSCOPIES
Chapter
8
atomic However, among
all
these techniques, the conceptually simple
MAS-NMR experiment has had
by
far the biggest impact in materials science
applications.
Instrumentation
NMR instrumentation consists of three chief components: a magnet, a spectrome-
ter console, and a probe. While in the
past
much solid state
NMR
research was con-
ducted on home-built equipment, the current trend is toward the acquisition of
commercial systems. The magnets used for solid state NMR applications generally
are superconducting solenoids with
a
cylindrical bore of 89-mm diameter. The
most common field strengths available, 4.7,7.0,9.4, and 1 1.7 Tesla, correspond to
proton resonance frequencies near 200,300,400, and
500
MHz, respectively.
The spectrometer console comprises a radiofrequency part for the generation,
amplification, mixing, and detection of radiofrequency and NMR signals, and a
digital electronics part, consisting of a pulse programmer, a digitizer, and an on-line
computer. Equipment normally used for pulsed liquid state NMR applications
often can be modified for solid state experiments by adding high-power amplifiers
(up to 1-kW output power) and fast digitizers (2 MHz or faster).
NMR
probes are used to transfer the radiofrequency pulse to the sample and to
detect the nuclear induction signal after the pulse. They contain radiofrequency cir-
cuitry, which is tunable to the nuclear resonance frequency via variable capacitors
and which is based usually on a single solenoidal coil (diameter 4-25 mm).
MA!3-
NMR experiments require special probes, enabling
fast
sample rotation within the
magnet. Currently,
MAS
is done mostly on powdered samples packed within cylin-
drical containers (rotors) that are machined from single-crystal alumina, zirconia,
or
silicon nitride to precise dimensions. High-pressured
gases
(air, Nz,
or
Ar,
at
40-
60
lb/in2) thrusting on turbine-shaped caps are used to accomplish
fast
rotation.
For
routine experimenrs, typical spinning speeds are 5-10
kHz;
with suitable
equipment up to 20
kHz
can be reached.
Practical Aspects and Limitations
Sample preparation requirements in solid state NMR are strikingly simple because
the
measurement is carried out at ambient temperature and pressure. Wide-line
NMR
experiments can be carried out on solid samples in any form,
as
far
as
the
sample dimensions
fit
those of the coil in the NMR probe.
MA!3
experiments
require the material
to
be uniformly distributed within the rotor.
Compared
to
other spectroscopic methods, NMR spectroscopy is a very insensi-
tive technique.
As
a
general
rule
of
thumb, the sample studied must contain at least
1
0-5
moles of target nuclei. The required sample size thus depends on the percent-
age of the element present in the sample,
as
well
as
on the natural abundance of the
8.4
NMR
469
NMR
isotope measured. For example, for the detection of phosphorus by
31P
NMR in a sample containing
3
wt.%
phosphorus, approximately
10
mg of sample
are required. By contrast, the corresponding detection limit for 29Si in a similar sit-
uation is
22
times higher, due to the much lower natural abundance
(4.7%)
of the
"Si isotope.
Naturally, the low sensitivity poses a particular obstacle to
NMR
studies of thin
films and surfaces. Large surface areas are obviously favorable (the samples in
Figure
5
have
surface
areas around
150
m2/g), but good results can often be
obtained on samples with surfice areas
as
small
as
10
m2/g. Experimentally, the
detection sensitivity
can
be increased by increasing the applied field strength; by
increasing the sample size (although practical considerations often impose a
maxi-
mum sample volume of several cm3); and by using special
NMR
techniques (cross-
polarizationP6) for sensitivity enhancement.
Additional limitations arise from the nuclear electric quadrupole interaction for
nuclei with
I>
M
and fiom the dipolar interaction of nuclei with localized electron
spins in paramagnetic samples. Both interactions tend to interfere with the align-
ment of the nuclear spins in the external magnetic
field,
and to make the observa-
tion of NMR signals difficult. Due to these factors, less than
half
the elements in
the periodic table are conducive to solid state NMR experiments. The following
ranking holds with regard to detection sensitivity and general suitability in the solid
state-highly favorable elements:
H,
Li, Be,
B,
F, Na,
Al,
P,
V,
Sn, Xe, Cs,
Pt,
and
T1;
less well-suited elements, where NMR often suffers from sensitivity restrictions:
C,
N,
Si, Se,
Y,
Rh,
Ag,
Cd, Te,
W,
Hg,
and Pb; and elements whose suitability is
often limited by quadrupolar interactions: N,
0,
C1, Mn, Co, Cu, Ga,
K,
Rb,
Nb,
Mo, In, and Re. Elements not listed here
can
be considered generally unsuitable for
solid state
NMR.
Quantitative Analysis
In contrast to other spectroscopies, such
as
IWRarnan or
VIS/W,
NMR
spec-
troscopy is inherently quantitative. This means that for a given nucleus the propor-
tionality factor relating the
area
of
a
signal
to
the number
of
nuclei giving rise
to
the
signal is not at all sample-dependent. For this reason, NMR spectroscopy has been
used extensively for absolute
and
relative quantitation experiments, using chemi-
cally well-defined model compounds
as
standards.
It is essential, however, to follow a rigorous experimental protocol for such appli-
cations.
To
maintain the quantitative character of NMR spectroscopy, the repeti-
tion rate
of
signal averaging experiments has to be at least five times the longest
spin-lattice relaxation time present
in
the sample. This waiting period is necessary
to ensure that the magnetization is probed in
a
reproducible state, corresponding to
thermodynamic equilibrium.
470
VIBRATIONAL
SPECTROSCOPIES
Chapter
8
Conclusions
To
date,
the simple one-pulse acquisition experiments (with or without
h4AS)
reviewed
here have been the mainstay for the majority of NMR applications in
materials science.
A
current trend is the increasing use
of
NMR for
in
situ
studies,
using
more
sophisticated hardware
arm~gements.~~
For the
near
future,
a
rapid
diffusion
of
NMR know-how and methodology into many areas of solid state sci-
ence can be foreseen, leading to the application of more complicated techniques
that
possess
inherently greater infbrmational content than MAS-NMR Examples
of this kind include multiple pulse techniques,
such
as
one- and two-dimensional
versions
of
spin-echo and double resonance methods, and experiments involving
variable rotation angles?
Also,
new
areas
for applications are opening up.
A
most recent development
has
been the successful demonstration of three-dimensional imaging of ceramic and
polymeric mtds
by
solid state NMR techniques.
This
area
is most likely
to
expand considerably.
Related
Articles
in
the
E
nqdopedia
EXAFS,
FTIR,
XRD
References
1
J.
Klinomki.
hg.
NMRSpectrwsc.
16,237,1984.
A
summary
of
23Si
MAS-NMR applications to zeolites.
2
J.
Baum,
K. K.
Gleason,
A.
Pines,
A.
N. Garroway,
and
J.
A.
Reimer.
Pbys,
Rev-
Lett.
56,1377,1986.
Detection
of
hydrogen clustering in amorphous
hydrogenated silicon by a special technique of dipolar spectroscopy, mul-
tiple-quantum NMR
Am.
Cbem.
SOC.
11
1,2052, 1989.
In
situ
NMR studies of catalytic proper-
ties.
4
T
M. Duncan and
C.
R. Dybowski.
Su$Sci.
Rep.
1,157,1981. An
excel-
lent review of relevant NMR theory, modern techniques, and applications
to
surfices.
5
B.
C.
Gerstein and
C.
R.
Dybowski.
Transient
Ecbniques
in
NMR
of
Sol-
id.
Academic
Press,
1985.
An
in-depth treatment
of
the theoretical
foun-
dations of solid state NMR
6
M. Mehring.
Principles
ofHigh
Resolution
NMR
in
Solia?.
Springer Verlag,
New York,
1983.
An
in-depth treatment
of
the
theoretical
foundations
of
solid state NMR
3
J.
E
Haw, B.
R.
Richardson,
LS.
Oshiro, N.D.
Lam,
and
J.
A.
Speed.
J
0.4
NMR
47
1
7
H.
kkert.
Bet: Bunsenges.
Pbys.
Gem.
94,1062,1990. Arecent
review
of
modern
NMR techniques
as
applied
to
various Materials Science prob-
lems.
B
H.
Eckert and
I.
E.
Wachs.
/.
Pbys.
Cbm.
93,6796, 1989.
51V
NMR
9
J.
E
Stebbins and
I.
Farnan.
Science.
245,257,
1989. Highlights
in situ
studies
of
vanadia-based
catalysts
and model compounds.
NMR applications at ultrahigh temperatures.
472
VIBRATIONAL
SPECTROSCOPIES
Chapter
8
9
ION
SCATTERING TECHNIQUES
9.1
Rutherford Backscattering Spectrometry,
RBS
476
9.2
Elastic Recoil Spectrometry,
ERS
488
9.3
9.4
Ion Scattering Spectroscopy, ISS
514
Medium-Energy Ion Scattering Spectrometry
with
Channeling
and
Blocking,
MEISS
502
9.0
I
NTROD
UCTlO
N
In this chapter three ion-scattering methods for determining composition and geo-
metric structure (for single crystal material) are discussed. They are Rutherford
Backscattering Spectrometry,
RBS,
which typically utilizes high-energy He or
H
ions (usually
1-3.4
MeV energies), Medium-Energy Ion Scattering,
MEIS
(ion
energies from
50
keV to
400
kev), and low-energy ion scattering
(100
eV to
5
kev)
which
is
more commonly
known
as
Ion-Scattering
Spectroscopy,
ISS.
A
fourth
technique, Elastic Recoil Spectrometry,
ERS,
is
an
auxiliary
to
these
methods for
the specific detection of hydrogen.
All
the techniques are performed in vacuum.
For
the three ion-scattering techniques there are differences in information con-
tent that are a consequence of
the
different ion energy regimes involved, plus some
differences in instrumentation. For
RBS,
the most widely used method, the high-
energy ions penetrate well into the sample (up to
2
pn
for He ions;
20
pm for
H
ions). On its way into the sample
an
individual ion
loses
energy in
a
continuous
manner through a series
of
electronic scattering
events.
Occasionally
an
ion under-
goes
a billard ball-like collision with the nucleus of an atom
in
the sample material
and is back scattered
with
a discrete, large energy loss, the value of which is
charac-
teristic of the atom
struck
(momentum transfer). Since this major energy
loss
is
atom specific, whereas the small continuum energy loses depend on
the
depth trav-
eled, the overall energy spectrum
of
the emerging back scattered ions reveals both
the elemental composition and the depth distribution of those elements in a nonde-
structive manner. Since the scattering physics is quantitatively well understood at
473
these high energies (Rutherford Scattering) a standardless depth profile
is
obtain-
able with a few percent accuracy. Other important factors are: the separation in
backscattering energy of adjacent elements in the backscattered spectrum decreases
with increasing
mass
such that Ni and Fe
are
not separable, whereas
C
and
0
are
easily distinguished; the backscattering cross section is essentially proportional to
Z2and therefore heavy elements in light matrices have much better de- tection lim-
its (by about
a
factor of
100)
at
10-100
ppm than vice versa; the depth-resolution
depends on ion energy, angle of incidence, and depth below the surhce such that a
resolution of
20
is achievable (low ion energy, grazing angle, analysis done right
at the surface), but more typical
values
are several hundred angstroms.
For
single crystal materials, aligning the ion beam
with
a crystallographic direc-
tion suppresses the signal from below the first few layers, since the atoms in these
layers shadow bulk atoms below from the incoming ion beam. This technique,
known
as
channeling, is used both to enhance the surface sensitivity and to deter-
mine the extent of crystalline defects, since if atoms are displaced from their correct
positions the degree of shadowing in the channeling mode will be decreased.
MEIS is a more sophisticated form of
RBS
that
uses
lower energy ions (usually
100400
kev) and a higher resolution ion energy analyzer. The lower energies
restrict the probing depth. The better energy resolution improves the depth resolu-
tion down to a few angstroms.
It
also improves the ability to distinguish elements at
high mass. When used for single crystal materials in conjunction with channelling
of the incoming ions, and blocking of the outgoing backscattered ions, the method
provides atomic positions at a surface, or an interface up to
4
or
5
layers below the
surface, to an accuracy of a few hundredths
of
an angstrom. In addition it retains
the standardless quantitation of the
RBS
method with sensitivities to submonolayer
amounts. Both
RBS
and MEIS are extremely expensive, requiring an ion accelera-
tor. The lower energy accelerator of MEIS is cheaper, but this is counteracted by
the greater expense of the more sophisticated ion energy analysis. Both techniques
typically cost around
$1,000,000
and take up large laboratories. Beam diameters
are usually millimeters in size, but microbeam systems with spatial resolution down
to
1
jun
exist. Ion-beam damage can be a problem, particularly for polymers. It can
be mitigated by using low ion doses and
by
rastehng the beam.
ISS
involves the use of ions (usually He
or
Ar)
in the
100-5000
eV range. At
these energies essentially only backscattering from atoms in the outermost atomic
layer produces peaks in the ion energy spectrum due to nearly complete neutraliza-
tion of any ions scattered from below the surfice.
As
with
RBS
and MEIS the abil-
ity to resolve adjacent elements becomes rapidly poorer with increasing
Z
This can
be mitigated, but not solved entirely, by changing the mass
of
the
ion (eg
Ar
for
He), the ion energy, ~d the angle of detection.
All
these variations significantly
affect the scattering cross section and background, however, which complicates
quantitative
use.
Quantitation is not standardless
at
these energies but requires suit-
able standards
to
determine relative cross sections for the set of scattering parame-
474
ION SCATERING TECHNIQUES Chapter
9
ters used.
Cross
sections still depend roughly on
2:
however,
so
the technique is
much more sensitive to high-2 materials. Owing to its extreme surface sensitivity
ISS is usually used in conjunction with sputter profiling over the top
50
A
or
so.
Spatial resolution down
to
about
150
pm is routinely obtained. The technique is
not widely used owing
to
the lack
of
commercial equipment and its poor elemental
resolution. Instrumentation
is
quite cheap, and simple, however, since an ordinary
ion gun replaces the ion accelerator used in
RBS
and MEIS. It can be used
as
an
auxiliary technique on
XPS
or
AES
spectrometers by reversing the voltage on the
analyzer to pass ions instead of electrons.
In
ERS,
also known
as
Forward Recoil Spectrometry,
FRS,
Hydrogen Recoil
Spectrometry, HRS
,
or
Hydrogen Forward Scattering, HFS, hydrogen atoms
present in a sample recoil from He ions striking the sample at grazing angle with
sufficient forward momentum to be ejected.
They
are then separated from any He
that also emerges by using a thin stopping foil that allows energetic
H
to pass but
not He. In this way the hydrogen content can be quantitatively determined. The
technique can be applied in
RBS,
MEIS,
or
ISS spectrometors
and
is used because
a target atom that is lighter than the incident ion is only scattered in the forward
direction;
it
is
never backscattered. Therefore regular
RBS
cannot be used for
H
detection. The depths analyzed and depth-profiling capabilities are similar to those
of
the equivalent backscattering methods, but the depth resolution
is
poor
(2500
A
at 1000-8, depths).
NRA
(Chapter ll), an alternative technique for detecting
hydrogen, has greater sensitivity than ERS. SIMS (Chapter 10) has
far
greater sen-
sitivity
for
hydrogen (down to trace amounts) than either technique and better
depth resolution, but it is a destructive sputter-removal method and
is
difficult to
quantify. Sample damage can also be a problem
with
ERS,
particularly for poly-
mers.
475
9.1
Rutherford Backscattering Spectrometry
SCOTT
M.
BAUMANN
Contents
Introduction
Basic Principles
Channeling
Quantification
Artifacts
Instrumentation
Applications
Conclusions
Introduction
Rutherford Backscattering Spectrometry
(RBS)
is one of the more quantitative
depth-profiling techniques available, with typical accuracies of a few percent. The
depth profiling is done in a nondestructive manner, i.e., not by sputtering away the
surface layers. Results obtained by
RBS
are insensitive to sample matrix and typi-
cally
do not require the use of standards, which makes
RBS
the analysis of choice
for depth profiling of major constituents in thin films. Detection limits range from
a few parts per million (ppm)
for
heavy elements to a few percent for llght elements.
RBS
depth resolution is on the order of 20-30 nm, but can be
as
low
as
2-3
nm
near the
surface
of
a sample. Typical analysis depths are
less
than
2000
nm, but the
use of protons, rather than helium,
as
the probe particle
can
increase the sampling
depth by
as
much
as
an order of magnitude. Lateral resolution for most instruments
is on the order of 1-2 millimeters, but some microbeam systems have a resolution
on the order of 1-10
pm.
476
ION
SCAlTERING
TECHNIQUES
Chapter
9
Three common
uses
of
RBS
analysis exist: quantitative depth profiling,
areal
concentration measurements (atoms/an2), and crystal quality
and
impurity lattice
site
analysis.
Its primary application is quantitative depth profiling of semiconduc-
tor thin films and multilayered structures. It is also used to measure contaminants
and to study crystal structures, also primarily in semiconductor materials. Other
applications include depth profiling of polymersY1 high-Tc superconductors, opti-
cal coatings, and catalyst particles2
Recent advances in accelerator technology have reduced the cost
and
size
of
an
RBS
instrument to equal to or less than
many
other analytical instruments, and the
development
of
dedicated
RBS
systems
has
resulted in increasing application
of
the
technique, especially
in
industry, to areas
of
materials science, chemistry, geology,
and biology, and also
in
the
realm
of
particle physics. However, due to its historical
segregation into physics rather than analytical chemistry,
RBS
still is not
as
readily
available
as
some other techniques and is often overlooked
as
an analytical tool.
Basic Principles
RBS
is based on collisions between atomic nuclei and derives its name from
Lord
Ernest Rutherford who first presented the concept of atoms having nuclei. When a
sample
is
bombarded with a beam
of
high-energy particles, the vast majority of
par-
ticles are implanted into the material and do not escape.
This
is because the diame-
ter
of
an
atomic nucleus is on the order
of
1
O4
a
while the spacing between nuclei
is on
the
order of
1
k
A
small fraction of the incident particles do undergo a direct
collision with a nucleus
of
one of
the
atoms in the upper
fav
pm of the sample. This
“collision” actually is due to the Coulombic force present between
two
nuclei in
close proximity to each other, but can be modeled
as
an elastic collision
using
clas-
sical physics.
The energy
of
a backscattered particle detected at a
given
angle depends upon
two
processes:
the loss
of
energy by the particle due to the transkr
of
momentum to
the target atom during the backscattering event, and the loss of energy by the parti-
cIe during transmission through the sample material (both before and after scatter-
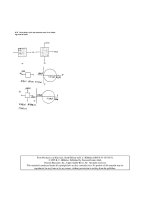
ing). Figure
1
is a schematic showing backscattering events occurring at
the
surface
of a sample and at
a
given depth din the sample.
For
scattering at
the
sample’s sur-
face
the
only energy loss is due to momentum transfer to
the
target atom. The ratio
of the projectile’s energy after a collision to the its energy before a collision
(E,/&)
is d&ned
as
the kinematic factor
IC3,
*
where
MI
is the mass
of
the incident particle (typically
*He);
M,
is
the mass of the
target atom; and
R
is defined
as
the
angle
between the
trajectory
of
the He particle
before and after scattering.
9.1
RES
477
0
INCIDENT
PARTICLES
M
1
0
ATOMS
N
TAR-
M
2
.mmHNERGYLoss
I
1
Figure
1
A
schematic showing the various energy
IOU
processes for backscattering
from a given depth in a sample. Energy is
lost
by momentum transfer
between the probe particle and the target particle, and as the probing particle
traverses the sample material both before and after scattering.
As
shown in Figure
1,
when the probing particles penetrate to some depth in a
sample, energy is lost in glancing collisions with the nuclei of the target atoms
as
well
as
in interactions with electrons. For a 2-MeV
He
atom, the energy loss is in
the range
of
100-800
eV/nm and depends upon the composition
and
density
of
the sample. This
means
that a particle that backscatters from some depth in a sam-
ple will have measurably less energy than a particle that backscatters from the same
element on the sample's
surface.
This
allows
one to use
RBS
in determining the
thickness of layers
and
in depth profiling.
The relative number of particles backscattered from a target atom into a given
solid angle for a given number
of
incident particles is related to the differential
scat-
tering cross section:
2
do
Z~Z~CZ
24(J1
-
((M,/M~)
sine)2+cose)
(2)
where
21
and
2,
are
the atomic numbers
of
the incident atom and the target atom,
Eis
the energy
of
the incident atom immediately behre scattering, and cis the elec-
tronic charge.
A
rule
of
thumb is that the scattering cross section is basically propor-
tional to the square
of
the atomic number
Zof
the target species. This means that
RBS
is more than a hundred times more sensitive for heavy elements than for light
-
1#2
=
(7)
(sine)*,/l-
(
(Ml/M2)
sine12
478
ION SCAITERING TECHNIQUES Chapter
9
a
a-
x
0
incident
He12.275
MeV, Detector Angle-1
60'
5E4
-
;
230nm
TaS12
-
590nm
TaSi.3
I.
0.200
0.600
1.000
1.400
1.800
2.
Backscattering
Energy
(MeV)
00
Figure
2
RBS
spectra from
two
TaSi,films with different Si /Ta ratios and layer thick-
nesses.
elements,
such
as
B
or
C.
There is much greater separation between the energies of
particles backscattered from
light
elements
than
from heavy elements, because a sig-
nificant amount of momentum
is
transferred from an incident particle to a light
target atom.
As
the mass of the target atom increases, less momentum is transferred
to them and the energy of the backscattered particle asymptotically approaches the
incident particle energy (see Equation
1).
This means that
RBS
has good mass res-
olution fbr light elements, but poor mass resolution for heavy elements. For
exam-
ple, it
is
possible to resolve
C
from
0
or
P
from Si but it is not possible to resolve
W
from Ta,
or
Fe from Ni when these elements are present at the same depths in the
sample, even though the difference in mass between the elements in each of these
pairs is roughly
1
amu.
Figure
2
shows how the processes combine to create an
RBS
spectrum by dis-
playing the spectra from
two
TaSi, films on Si substrates. Met4 silicide films are
commonly used
as
interconnects between semiconductor devices because they have
lower resistivity than aluminum
or
polysilicon. The resistivity of the fdm depends
upon the ratio of Si to metal and on the film thickness, both of which can be deter-
mined by
RBS.
The peak in each spectrum at
high
energy
is
due to scattering from
Ta in the TaSi, layers while the peak at lower energy
is
from Si in the TaSi, layer
and the Si substrate. The high-energy edge of the Ta peaks near
2.1
MeV (labeled
A)
corresponds
to
scattering from
Ta
at
the surface of both samples, while the high-
energy edge of the Si peaks (labeled
0)
near
1.3
MeV corresponds to backscattering
from Si at the surfice of the TaSi, layer. By measuring the energy width of the Ta
peak
or
the Si step and dividing by the energy
loss
of He (the incident particle) per
unit depth in a TaSi, matrix, the thickness of the TaSi, layer can be calculated. For
example, the low-energy edge of the Ta peak corresponds to scattering from Ta at
the TaSi,Si interface and the step in the Si peak corresponds to the increase in the
9.1
RBS
479
will
backscatter
from
the first few monolayers of material at the same rate
as
a nonaligned sample, but backscattering from buried atoms in the lattice will be
drastically reduced, since these atoms are shielded from the incident particles by the
atoms in
the
surface layers.
For
example, the backscattering signal
from
a single-
crystal Si sample that is in channeling alignment along the (100) axis will be
approximately
3%
of the backscattering signal from a nonaligned crystal,
or
amor-
phous
or
polycrystalline Si. By measuring the reduction in backscattering when a
sample is channeled it
is
possible to quantitatively measure and profile the crystal
perfection of a sample,
or
to determine its crystal orientation.
Figure
3
shows channeled spectra from a series of Si samples that were implanted
with
1013,
and 1015 arsenic atoms/an2. Only the
As
peaks
for
the
two
high-
est dose implants are shown, but with a longer data acquisition time the concentra-
tion 1013
As
atoms/cm2 could be detected. The damage caused to the Si crystal
lattice by
the
As
implants is reflected in the peaks near 1.25 MeV in
the
aligned
spectra. In the case
of
the
1015-atoms/cm2 implant there is little
or
no single-crystal
structure remaining in the damaged region of the Si,
so
the backscattering signal is
the same height
as
for nonaligned Si. Measuring the energy width of the damage
peak indicates that the damaged layer is approximately 200 nm thick. Integrating
the damage peak and subtracting the backscattering signal obtained for the nonim-
planted reference indicates that approximately 1.0
x
10l8 Si atoms/cm2 were
dis laced by the 10'5-atoms/cm2
As
implant, while
3.4
x
1017
and
1.7
x
As
implants, respectively. In this case
RBS
could be used to measure accurately the
total concentration
of
arsenic atoms implanted in each sample, to profile the
As
implant, to determine the amount ofAs that is substitutional in the Si lattice
and
its
lattice location, to measure
the
number of displaced Si atoms/cm2, and to profile
the damage in the Si crystal.
10
P6
Si atoms/cm2 were displaced by the 10'4-atoms/cm2 and 1013-atoms/cm2
Quantification
As
noted above, the calculation of elemend concentrations and thicknesses by
RBS
depends upon the scattering cross section of
the
element of interest and the
stopping cross section
of
the sample matrix. The scattering and stopping cross sec-
tions for each element have been carellly measured and
43
'
In general,
scattering cross sections fbllow the Rutherford scattering model to within
5%.
It is
difficult
to
accurately describe the stopping cross sections for all elements with
a
single equation,
so
semiempirical values are employed.
A
polynomial equation with
several terms is used
so
that the stopping cross sections
for
each element
can
be cal-
culated over
a
range
of
energies. In general, the calculated stopping cross sections
are
accurate to
10Yo
or
better. The stopping cross section
for
a multi-elemental
sample is calculated by normalizing the stopping
cross
section
of
each element
to
its
concentration in the sample.
9.1
RBS
481
12000
9000
6000
3000
0-
0.600
1.doo l.io0
Si
Substrate
z
?
UI
I.
.
,
i
-
Backscattering Energy
(MeV)
3000
a
.+.
d
b
I!
0
30
Figure
4
RBS
spectra from a sample consisting
of
240
nm
of
Si on
170
nm
of
Si02 on a
Si sub-ate. The spectrum
in
(a) was acquired using a scattering angle
of
leOo
while the spectrum
in
(b) used a detector angle
of
llOo.
This sample was
implanted
with
2.50
x
10"
As
atoms/cm*, but the
As
peak cannot be posi-
tively
identified
from either spectrum alone. Only
As
at
a
depth
of
140
nm
will
produce the correct
peak
in
both spectra.
Due
to
the convoluted
mass
and depth scales present in an
RBS
spectrum, it may
not be possible
to
accurately describe an unknown sample using a single
RBS
spec-
trum.
For
example, Figure 4a
is
an
RBS
spectrum acquired at
a
backscattering angle
of
160'
from a sample implanted with
2.50
x
10l6
atoms/cm2 of& at a depth
of
approximately 140
nm.
If this were
a
totally unknown sample it would not be
pos-
sible
to
determine positively the mass and depth of the implanted species
fiom
this
spectrum alone, since the
peak
in the
RBS
spectrum
also
could have been caused by
a
heavier element
at
greater depth, such
as
Sb at
450
nm,
or
Mo
at
330
nm,
or
by
a
482
ION
SCAlTERlNG
TECHNIQUES
Chapter
9