Practical Design Calculations for Groundwater and Soil Remediation - Chapter 3 potx
Bạn đang xem bản rút gọn của tài liệu. Xem và tải ngay bản đầy đủ của tài liệu tại đây (495.33 KB, 46 trang )
Kuo, Jeff "Plume migration in groundwater and soil"
Practical Design Calculations for Groundwater and Soil Remediation
Boca Raton: CRC Press LLC,1999
©1999 CRC Press LLC
chapter three
Plume migration in
groundwater and soil
In Chapter two we illustrated the necessary calculations for site character-
ization and remedial investigation. Generally, from the RI activities the extent
of the plume in the vadose zone and/or groundwater is defined. If the
contaminants cannot be removed immediately, they will migrate under com-
mon field conditions and the extent of the plume will enlarge.
In the vadose zone, the contaminants will move downward as a free
product or become dissolved in infiltrating water and then move downward
by gravity. The downward-moving liquid may come in contact with the
underlying aquifer and create a dissolved plume. In addition, the VOCs will
volatilize into the air void of the vadose zone and travel under advective
forces (with the air flow) or concentration gradients (through diffusion).
Migration of the vapor can be in any direction, and the contaminants in the
vapor phase, when coming in contact with the groundwater, may also dis-
solve into the groundwater. For site remediation or health risk assessment,
understanding the fate and transport of contaminants in the subsurface is
important. Common questions related to the fate and transport of contami-
nants in the subsurface include
1. How long will it take for the plume in the vadose zone to enter the
aquifer?
2. How far will the vapor contaminants in the vadose zone travel? In
what concentrations?
3. How fast does the groundwater flow? In which direction?
4. How fast will the plume migrate? In which direction?
5. Will the plume migrate at the same speed as the groundwater flow
or at a different speed? If different, what are the factors that would
©1999 CRC Press LLC
make the plume migrate at a different speed from the groundwater
flow?
6. How long has the plume been present in the aquifer?
This chapter illustrates the basic calculations needed to answer most of
the above questions. The first section presents the calculations for ground-
water movement and clarifies some common misconceptions about ground-
water velocity and hydraulic conductivity. Procedures to determine the
groundwater flow gradient and the flow direction are also given. The second
section presents groundwater extraction from confined and unconfined aqui-
fers. Since hydraulic conductivity plays a pivotal role in groundwater move-
ment, several common methodologies of estimating this parameter are cov-
ered, including the aquifer tests. The discussion then moves to the migration
of the dissolved plume in the aquifer and in the vadose zone.
III.1 Groundwater movement
III.1.1 Darcy’s law
Darcy’s Law is commonly used to describe laminar flow in porous media.
For a given medium the flow rate is proportional to the head loss and
inversely proportional to the length of flow path. Flow in typical ground-
water aquifers is laminar, and therefore Darcy’s Law is valid. Darcy’s Law
can be expressed as
[Eq. III.1.1]
where
v
is the Darcy velocity,
Q
is the volumetric flow rate,
A
is the cross-
sectional area of the porous medium perpendicular to the flow,
dh/dl
is the
hydraulic gradient (a dimensionless quantity), and
K
is the hydraulic con-
ductivity.
The hydraulic conductivity tells how permeable the porous medium is
to the flowing fluid. The larger the
K
of a formation, the easier the fluid flows
through it.
Commonly used units for hydraulic conductivity are either in velocity
units such as ft/d, cm/s, or m/d, or in volumetric flow rate per unit area
such as gpd/ft
2
. You may find the unit conversions in Table III.1.A helpful.
Example III.1.1 Estimate the rate of fresh groundwater in contact
with the plume
Leachates from a landfill leaked into the underlying aquifer and created a
contaminated plume. Use the information below to estimate the amount of
fresh groundwater that enters into the contaminated zone per day.
v
Q
A
K
dh
dl
==−
©1999 CRC Press LLC
The maximum cross-sectional area of the plume perpendicular to the
groundwater flow = 1600 ft
2
Groundwater gradient = 0.005
Hydraulic conductivity = 2500 gpd/ft
2
Solution:
Another common form of Darcy’s Law (Eq. III.1.1) is
[Eq. III.1.2]
where
i
is the hydraulic gradient,
dh/dl.
The rate of fresh groundwater entering the plume can be found by
inserting the appropriate values into the above equation:
Q
= (2500 gpd/ft
2
)(0.005)(1600 ft
2
) = 20,000 gpd
Discussion
1. The calculation itself is straightforward and simple. However, we can
get valuable and useful information from this exercise. The rate of 20,000
gal/day represents the rate of uncontaminated groundwater that will
come in contact with the contaminants. This water would become con-
taminated and move downstream or sidestream and, consequently, en-
large the size of the plume. To control the spread of the plume, we have
to extract this amount of water, 20,000 gpd or ~14 gpm, as a minimum.
The actual extraction rate required should be higher than this because
the groundwater drawdown from pumping will increase the flow gra-
dient. This increased gradient will, in turn, increase the rate of ground-
water entering the plume zone as indicated by the equation above.
2. Using the maximum cross-sectional area is a legitimate approach that
represents the “contact face” between the fresh groundwater and the
plume.
III.1.2 Darcy’s velocity vs. seepage velocity
The velocity term in Eq. III.1.1 is called the Darcy velocity (or the discharge
velocity). Does this Darcy velocity represent the groundwater flow velocity?
Table III.1.A
Common Conversion Factors
for Hydraulic Conductivity
m/d cm/s ft/d gpd/ft
2
1 1.16
E
– 3 3.28 2.45
E
+ 1
8.64
E
+ 2 1 2.83
E
+ 3 2.12
E
+ 4
3.05
E
– 1 3.53
E
– 4 1 7.48
4.1
E
– 2 4.73
E
– 5 1.34
E
– 1 1
QKiA=
©1999 CRC Press LLC
The answer is “no.” The Darcy velocity in that equation assumes the flow
occurs through the entire cross-section of the porous medium. In other
words, it is the velocity at which water would move through an aquifer if
the aquifer were an open conduit. Actually, the flow is limited to the available
pore space only (the effective cross-sectional area available for flow is
smaller), so the actual fluid velocity through the porous medium would be
larger than the Darcy velocity. This flow velocity is often called the seepage
velocity or the interstitial velocity. The relationship between the seepage
velocity,
v
s
,
and the Darcy velocity,
v,
is as follows:
[Eq. III.1.3]
where
φ
is the porosity. For example, for an aquifer with a porosity of 33%,
the seepage velocity of groundwater flowing through this aquifer will be
three times the Darcy velocity (i.e.,
v
s
= 3
v
).
Example III.1.2 Determine Darcy velocity and seepage velocity
There is spill of an inert (or a conservative) substance into the subsurface.
The spill infiltrates the unsaturated zone and quickly reaches the underlying
water table aquifer. The aquifer consists mainly of sand and gravel with a
hydraulic conductivity of 2500 gpd/ft
2
and an effective porosity of 0.35. The
water level in a well neighboring the spill lies at an altitude of 560 ft, and
the level in another well 1 mile directly down gradient is 550 ft. Determine
a. The Darcy velocity of the groundwater
b. The seepage velocity of the groundwater
c. The velocity of plume migration
d. How long it will take for the plume to reach the down-gradient well
Solution:
a. We have to determine the gradient of the aquifer first:
i
=
dh/dl
= (560 – 550)/5280 = 1.89
×
10
–3
ft/ft
Darcy velocity =
Ki
b. Seepage velocity =
v
/
φ
0.63/0.35 = 1.81 ft/d
v
Q
A
v
s
==
φφ
( ). (. ). 2500 0 134 1 89 10 0 63
3
gpd/ft
ft/d
gpd/ft
ft/ft ft/d
2
2
×=
−
©1999 CRC Press LLC
c. The pollutant is inert, meaning that it will not react with the aquifer.
(Sodium chloride is a good example of an inert substance and is often
used as a tracer in an aquifer study.) Therefore, the velocity of plume
migration for this case is the same as the seepage velocity, 1.81 ft/d.
d. Time = distance/velocity
5280 ft/(1.81 ft/d) = 2912 days = 8.0 year
Discussion
1. The conversion factor, 1 gpd/ft
2
= 0.134 ft/d, used in (a) is from Table
III.1.A.
2. The calculated plume migration velocity is crude at best and should
only be considered as a rough estimate. Many factors, such as hydro-
dynamic dispersion, are not considered in this equation. The disper-
sion can cause parcels of water to spread transversely to the major
direction of groundwater flow and move longitudinally, down gradi-
ent, at a faster rate. The dispersion is caused by an intermixing of
water particles due to the differences in interstitial velocity induced
by the heterogeneous pore sizes and tortuosity.
3. In addition, the migration of most chemicals will be retarded by
interactions with the geologic formation, especially with clays,
soil–organic matter, and metal oxides and hydroxides. This phenom-
enon will be discussed further in Section III.4.3.
III.1.3 Intrinsic permeability vs. hydraulic conductivity
In the soil venting literature one may encounter a statement such as “the soil
permeability is 4 Darcies,” while in groundwater remediation literature one
may read that “the hydraulic conductivity is equal to 3 cm/s.” Both statements
describe how permeable the formations are. Are they the same? If not, what
is the relationship between the permeability and hydraulic conductivity?
These two terms, permeability and hydraulic conductivity, are sometimes
used interchangeably. However, they do have different meanings. The intrin-
sic permeability of a porous medium (i.e., a rock or soil) defines its ability to
transmit a fluid. It is a property of the medium only and is independent of
the properties of the transmitting fluid. That is why it is called the “intrinsic”
permeability. On the other hand, the hydraulic conductivity of a porous
medium depends on the properties of the fluid flowing through it.
Hydraulic conductivity is conveniently used to describe the ability of an
aquifer to transmit groundwater. A porous medium has a unit hydraulic
conductivity if it will transmit a unit volume of groundwater through a unit
cross-sectional area (perpendicular to the direction of flow) in a unit time at
the prevailing kinematic viscosity and under a unit hydraulic gradient.
The relationship between the intrinsic permeability and hydraulic con-
ductivity is
©1999 CRC Press LLC
[Eq. III.1.4]
where
K
is the hydraulic conductivity,
k
is the intrinsic permeability,
µ
is the
fluid viscosity,
ρ
is the fluid density, and
g
is the gravitational constant
(kinematic viscosity =
µ
/
ρ
). The intrinsic permeability has a unit of area as
shown below:
[Eq. III.1.5]
In petroleum industries the intrinsic permeability of a formation is mea-
sured by a unit termed Darcy. A formation has an intrinsic permeability of
1 Darcy if it can transmit a flow of 1 cm
3
/s with a viscosity of 1 centipoise
under a pressure gradient of 1 atmosphere/cm, that is,
[Eq. III.1.6]
By substitution of appropriate units, it can be shown that
[Eq. III.1.7]
Table III.1.B lists the mass density and viscosity of water under one
atmosphere. As shown in the table, the density of water from 0 to 30°C is
essentially the same, at 1 g/cm
3
; the viscosity of water decreases with increas-
ing temperature. The viscosity of water at 20°C is one centipoise. (This is the
viscosity value of the fluid used in defining the Darcy unit.)
Example III.1.3 Determine hydraulic conductivity from a given
intrinsic permeability
The intrinsic permeability of a soil core sample is 1 Darcy. What is the
hydraulic conductivity of this soil for water at 15°C? How about at 25°C?
Solution:
a. At 15°C, density of water (15°C) = 0.999703 g/cm
3
(from Table III.1.B),
and viscosity of water (15°C) = 0.01139 poise = 0.01139 g/s · cm (from
Table III.1.B).
K
kg
k
K
g
==
ρ
µ
µ
ρ
or
k
K
g
==
⋅
=
µ
ρ
(m/s)(kg/m s)
(kg/m )(m/s )
[m ]
32
2
1 Darcy
(1 g/cm s)(1 cm /s)
1 cm
1 atmosphere/cm
3
2
=
⋅
1 Darcy = 0.987
±
× 10
82
cm
©1999 CRC Press LLC
b. At 25°C, density of water (25°C) = 0.997048 g/cm
3
(from Table III.1.B),
and viscosity of water (25°C) = 0.00890 poise = 0.00890 g/s · cm (from
Table III.1.B).
Discussion.
This example illustrates that a porous medium with an
intrinsic permeability of 1 Darcy has a hydraulic conductivity of 18 gpd/ft
2
at 15°C (23 gpd/ft
2
at 25°C). The unit of gpd/ft
2
is commonly used by
hydrogeologists in the United States. The unit is also named the meinzer
after O. E. Meinzer, a pioneering groundwater hydrogeologist with U.S.
Geological Services.
2
The unit of cm/s is more commonly used in soil
mechanics. (For example, the hydraulic conductivity of clay liners or flexible
membrane liners in landfills is commonly expressed in cm/s.)
From the above example, one can tell that a geologic formation with an
intrinsic permeability of one Darcy has a hydraulic conductivity of approx-
imately 10
–3
cm/s or 20 gpd/ft
2
for transmitting pure water at 20°C. Typical
Table III.1.B
Physical Properties of Water under
One Atmosphere
Temperature (°C) Density (g/cm
3
) Viscosity (cp)
0 0.999842 1.787
3.98 1.000000 1.567
5 0.999967 1.519
10 0.999703 1.307
15 0.999103 1.139
20 0.998207 1.002
25 0.997048 0.890
30 0.995650 0.798
40 0.992219 0.653
Note:
1 g/cm
3
= 1000 kg/m
3
= 62.4 lb/ft
3
. 1 centipoise = 0.01
poise = 0.01 g/cm · s = 0.001 Pa · s = 2.1
×
10
–5
lb · s/ft
2
.
K
kg
==
×
⋅
=×
=× ×= =
−
−
−
ρ
µ
(9.87 10 cm )(0.999703 g/cm )(980 cm/s )
0.01139 g/s cm
8.49 10 cm/s
gpd/ft 18.0 meinzers
92 3 2
4
2
(. )(. ) . 8 49 10 2 12 10 18 0
44
K
kg
==
×
⋅
=×
=× ×=
−
−
−
ρ
µ
(9.87 10 cm )(0.999703 g/cm )(980 cm/s )
0.00890 g/s cm
1.09 10 cm/s
gpd/ft
92 3 2
3
2
(. )(. ) . 1 09 10 2 12 10 23 0
34
©1999 CRC Press LLC
values of intrinsic permeabilities and hydraulic conductivities for different
types of formations are given in Table III.1.C.
III.1.4 Transmissivity, specific yield, and storativity
Transmissivity (
T
) is another concept that is commonly used to describe an
aquifer’s capacity to transmit water. It represents the amount of water that
can be transmitted horizontally by the entire saturated thickness of the
aquifer under a hydraulic gradient of one. It is equal to the multiplication
product of the aquifer thickness (
b
) and the hydraulic conductivity (
K
).
Commonly used units for
T
are m
2
/d and gpd/ft.
[Eq. III.1.8]
An aquifer typically serves two functions: (1) a conduit through which
flow occurs and (2) a storage reservoir. This is accomplished by the openings
in the aquifer matrix. If a unit of saturated formation is allowed to drain by
gravity, not all of the water it contains will be released. The ratio of water
that can be drained by gravity to the entire volume of a saturated soil is
called specific yield, while the part retained is the specific retention. Table
III.1.D lists typical porosity, specific yield, and specific retention of soil, clay,
sand, and gravel. The sum of the specific yield and the specific retention of
a formation is equal to its porosity.
The specific yield and the specific retention are related to the attraction
between water and the formation materials. Clayey formations usually have
a lower hydraulic conductivity. This often leads to an incorrect idea that
clayey formations have a lower porosity. As shown in Table III.1.D, clay has
a much higher porosity than sand, and sand has a higher porosity than
gravel. The porosity of clay can be as high as 50%, but its specific yield is
extremely low at 2%. Porosity determines the total volume of water that a
formation can store, while specific yield defines the amount that is available
to pumping. The low specific yield explains the difficulty of extracting
groundwater from clayey aquifers.
When the head in a saturated aquifer changes, water will be taken into
or released from storage. Storativity or storage coefficient (
S
) describes the
Table III.1.C
Typical Values of Intrinsic Permeabilities
and Hydraulic Conductivities
Intrinsic
permeability
(Darcy)
Hydraulic
conductivity
(cm/s)
Hydraulic
conductivity
(gpd/ft
2
)
Clay 10
–6
–10
–3
10
–9
–10
–6
10
–5
–10
–2
Silt 10
–3
–10
–1
10
–6
–10
–4
10
–2
–1
Silty sands 10
–2
–1 10
–5
–10
–3
10
–1
–10
Sands 1–10
2
10
–3
–10
–1
10–10
3
Gravel 10–10
3
10
–2
–1 10
2
–10
4
TKb=
©1999 CRC Press LLC
quantity of water taken into or released from storage per unit change in head
per unit area. It is a dimensionless quantity. The response of a confined
aquifer to the change of water head is different from that of an unconfined
aquifer. When the head declines, a confined aquifer remains saturated; the
water is released from storage by the expansion of water and compaction of
aquifer. The amount of release is exceedingly small. On the other hand, the
water table rises or falls with change of head in an unconfined aquifer. As
the water level changes, water drains from or enters into the pore spaces.
This storage or release is mainly due to the specific yield. It is also a dimen-
sionless quantity. For unconfined aquifers the storativity is practically equal
to the specific yield and ranges typically between 0.1 and 0.3. The storativity
of confined aquifers is substantially smaller and generally ranges between
0.0001 and 0.00001, and that for leaky confined aquifers is in the range of
0.001. A small storativity implies that it will require a larger pressure change
(or gradient) to extract groundwater at a specific flow rate.
7
The volume of groundwater (
V
) drained from an aquifer can be deter-
mined from the following:
[Eq. III.1.9]
where
S
is the storativity,
A
is the area of the aquifer, and
∆
h
is the change
in head.
Example III.1.4 Estimate loss of storage in aquifers due to change
of head
An unconfined aquifer has an area of 5 square miles. The storativity of this
aquifer is 0.15. The water table falls 0.8 feet during a drought. Estimate the
amount of water lost from storage.
If the aquifer is confined and its storativity is 0.0005, what would be the
amount lost for a decrease of 0.8 feet in head?
Table III.1.D
Typical Porosity, Specific Yield, and
Specific Retention of Selected Materials
Porosity
(%)
Specific yield
(%)
Specific retention
(%)
Soil 55 40 15
Clay 50 2 48
Sands 25 22 3
Gravel 20 19 1
From U.S. EPA,
Ground Water Volume I: Ground Water and Con-
tamination,
EPA/625/6-90/016a, U.S. EPA, Washington, DC,
1990.
VSAh= ()∆
©1999 CRC Press LLC
Solution:
a. Inserting the values into Eq. III.1.9, we obtain the volume of water
drained for the unconfined aquifer:
V = (0.15)[(5)(5280)
2
ft
2
](0.8 ft) = 1.67 × 10
7
ft
3
= 1.25 × 10
8
gal
b. For the confined aquifer:
V = (0.0005)[(5)(5280)
2
ft
2
](0.8 ft) = 5.58 × 10
4
ft
3
= 4.17 × 10
5
gal
Discussion. For the same amount of change in head, the water lost in
the unconfined aquifer is 300 times more, which is the ratio of the two
storativity values (0.15/0.0005 = 300).
III.1.5 Determine groundwater flow gradient and flow direction
Having a good knowledge of the gradient and direction of groundwater
flow is vital to groundwater remediation. The gradient and the direction of
flow have great impacts on selection of remediation schemes to control
plume migration, such as location of the pumping wells and groundwater
extraction rates, etc.
Estimates of the gradient and direction of groundwater flow can be made
with a minimum of three groundwater elevations. The general procedure is
described below and an example follows.
Step 1: Locate the three surveyed points on a map to scale.
Step 2: Connect the three points and mark their water table elevations
on the map.
Step 3: Subdivide each side of the triangle into a number of segments
of equal size. (Each segment represents an increment of eleva-
tion.)
Step 4: Connect the points of equal values of elevation (equipotential
lines), which then form the groundwater contours.
Step 5: Draw a line that passes through and is perpendicular to each
equipotential line. This line marks direction of flow.
Step 6: Calculate the groundwater gradient from the formula, i = dh/dl.
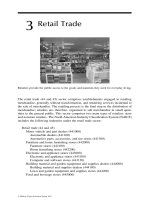
Example III.1.5 Estimate the gradient and direction of
groundwater flow from three groundwater
elevations
Three groundwater monitoring wells were installed at a contaminated site.
Groundwater elevations were determined from a recent survey of these wells
and the values were marked on a map. Estimate the flow gradient and
direction of the groundwater flow in the underlying aquifer.
Solution:
a. Water elevations (36.2’, 35.6’, and 35.4’) were measured at three mon-
itoring wells and marked on the map.
b. These three points are connected by straight lines to form a triangle.
c. Subdivide each side of the triangle into a number of segments of equal
intervals. For example, subdivide the line connecting point A (36.2’)
and point B (35.6’) into three intervals. Each interval represents a 0.2’
increment in elevation.
d. Connect the points of equal values of elevation (equipotential lines),
which then form the groundwater contours. Here, we connect the
elevations of 36.0’ and 35.6’ to form two contour lines.
e. Draw a line that passes through and is perpendicular to each equi-
potential line and mark it as the groundwater flow direction.
f. Measure the distance between two contour lines, 55 feet in this ex-
ample. Calculate the groundwater gradient from the formula, i = dh/dl:
i = (36.0 – 35.6)/(55) = 0.0073
Discussion. The groundwater elevations, especially those of the water
table aquifers, may change with time. Consequently, the groundwater flow
gradient and direction would change. Periodic surveys of the groundwater
elevation may be necessary if fluctuation of the water table is suspected. Off-
site pumping, seasonal change, and recharge are some of the reasons that
may cause the fluctuation of the water table elevation.
III.2 Groundwater pumping
III.2.1 Steady-state flow in a confined aquifer
The equation describing steady-state flow of a confined aquifer (an artesian
aquifer) from a fully penetrating well is shown below. A fully penetrating
Figure E.III.1.5 Determination of groundwater gradient and direction.
©1999 CRC Press LLC
©1999 CRC Press LLC
well means that the groundwater can enter at any level from the top to the
bottom of the aquifer.
[Eq. III.2.1]
where Q = pumping rate or well yield (in gpm, or m
3
/d), h
1
, h
2
= static head
measured from the aquifer bottom (in ft or m), r
1
, r
2
= radial distance from
the pumping well (in ft or m), b = thickness of the aquifer (in ft or m), and
K = hydraulic conductivity of the aquifer (in gpd/ft
2
or m/d).
Many assumptions are made to derive the above equation. The following
references or other groundwater hydrology books provide more detailed
treatment of this subject:
1. Groundwater and Wells, 2nd ed., by F. G. Driscoll, Johnson Division,
St. Paul, MN 55112, 1986.
2. Applied Hydrogeology, by C. W. Fetter, Jr., Charles E. Merrill Publishing,
Columbus, OH, 1980.
3. Groundwater Hydrology, 2nd ed., by D. K. Todd, John Wiley & Sons,
New York, 1980.
4. Groundwater, by R. A. Freeze and J. A. Cherry, Prentice Hall, Engle-
wood Cliffs, NJ, 1979.
Hydraulic conductivity is often determined from aquifer tests (see Sec-
tion III. 3 for details). Eq. III.2.1 can be easily modified to calculate hydraulic
conductivity of a confined aquifer, if two steady-state drawdowns, flow rate,
and aquifer thickness are available.
[Eq. III.2.2]
Another parameter, specific capacity, can also be used to estimate the
hydraulic conductivity of an aquifer. Let us define the specific capacity as
[Eq. III.2.3]
where Q = the well discharge rate (extraction rate), in gpm, and s
w
= draw-
down in the pumping well, in ft.
Q
Kb h h
rr
Kb h h
rr
=
−
=
−
()
log( / )
.( )
log( / )
21
21
21
21
528
273
for American Practical Units
for SI
K
Qrr
bh h
Qrr
bh h
=
−
=
−
528
273
21
21
21
21
log( / )
()
log( / )
.( )
for American Practical Units
for SI
Specific capacity =
Q
s
w
©1999 CRC Press LLC
For example, if a well produced 50 gpm and the drawdown in the well
is 5 ft, the specific capacity of this pumping well is 10 gpm/ft; it will produce
10 gpm for each foot of available drawdown. A rough estimate on transmis-
sivity (in gpd/ft) can be obtained by multiplying the specific yield (in
gpm/ft) by 2000 for confined aquifers and 1550 for unconfined aquifers.
7
The hydraulic conductivity (in gpd/ft
2
) can then be determined by dividing
the transmissivity with the aquifer thickness (in ft).
Example III.2.1A Steady-state drawdown from pumping a
confined aquifer
A confined aquifer 30 ft (9.1 m) thick has a piezometric surface 80 ft (24.4
m) above the bottom confining layer. Groundwater is being extracted out
from a 4-in (0.1 m) diameter fully penetrating well.
The pumping rate is 40 gpm (0.15 m
3
/min). The aquifer is relatively sandy
with a hydraulic conductivity of 200 gpd/ft
2
. Steady-state drawdown of 5 ft (1.5
m) is observed in a monitoring well 10 ft (3.0 m) from the pumping well. Estimate
a. The drawdown 30 ft (9.1 m) away from the well
b. The drawdown in the pumping well
Solutions:
a. First let us determine h
1
(at r
1
= 10 ft):
h
1
= 80 – 5 = 75 ft (or = 24.4 – 1.5 = 22.9 m)
Use Eq. III.2.3:
or
So, drawdown at 30 ft (9.1 m) away = 80 – 76.7 = 3.3 ft (or = 24.4 –
23.4 = 1.0 m).
b. To determine the drawdown at the pumping well, set r at the well =
well radius = (2/12) ft:
40
200 30 75
528 30 10
76 7
2
2
=
−
→=
()()( )
log( / )
.
h
h ft
0 15 1440
2 73 200 0 0410 9 1 22 9
91 30
23 4
2
2
−
→=
.)
log( . / . )
.
h
h(. )( )=
. [( )( . )]( . )(
m
40
200 30 75
528 2 12 10
68 7
2
2
=
−
→=
()()( )
log[( / )/ ]
.
h
h ft
©1999 CRC Press LLC
So, drawdown in the extraction well = 80 – 68.7 = 11.3 ft.
Discussion
1. In (a), the 0.041 is the conversion factor to convert the hydraulic
conductivity from gpd/ft
2
to m/day. The factor was taken from Table
III.1.A.
2. Calculations in (a) have demonstrated that the results would be the
same by using two different systems of units.
3. The (h
1
– h
2
) term can be replaced by (s
2
– s
1
), where s
1
and s
2
are the
drawdown at r
1
and r
2
, respectively.
4. The same equation can also be used to determine the radius of influ-
ence, where drawdown is equal to zero. Discussions on this topic will
be given in Chapter six.
Example III.2.1B Estimate hydraulic conductivity of a confined
aquifer from steady-state drawdown data
Use the following information to estimate the hydraulic conductivity of a
confined aquifer:
Aquifer thickness = 30.0 ft (9.1 m) thick
Well diameter = 4-in (0.1 m) diameter
Well perforation depth = fully penetrating
Groundwater extraction rate = 20 gpm
Steady-state drawdown = 2.0 ft observed in a monitoring well 5 ft from
the pumping well
= 1.2 ft observed in a monitoring well 20 ft from the pumping well
Solutions:
Inserting the data into Eq. III.2.2, we obtain
Discussion. The (h
1
– h
2
) term can be replaced by (s
2
– s
1
), where s
1
and
s
2
are the drawdown at r
1
and r
2
, respectively.
Example III.2.1C Estimate hydraulic conductivity of a confined
aquifer using specific capacity
Use the drawdown data of the pumping well in Example III.2.1A to estimate
the hydraulic conductivity of the aquifer:
K
Qrr
bh h
=
−
=
−
=
528
528 20 20 5
30 20 12
21
21
log( / )
()
( )( )log( / )
()(. .)
397 gpd/ft
2
©1999 CRC Press LLC
Aquifer thickness = 30 ft
Pumping rate = 40 gpm
Steady-state drawdown in the well = 11.3 ft
Solutions:
a. First let us determine the specific capacity of this well. Use Eq. III.2.3:
b. The transmissivity of the aquifer can be estimated as
T = (3.54)(2000) = 7080 gpd/ft
c. The hydraulic conductivity of the aquifer can be estimated as
K = T/b = 7080/30 = 236 gpd/ft
2
Discussion. The calculated hydraulic conductivity, 236 gpd/ft
2
, from
this exercise is not far from the value specified in Example III.2.1A, 200 gpd/ft
2
.
III.2.2 Steady-state flow in an unconfined aquifer
The equation describing steady-state flow of an unconfined aquifer (water-
table aquifer) from a fully penetrating well may be written as follows:
[Eq. III.2.4]
All the terms are as defined for Eq. III.2.1.
Eq. III.2.4 can be easily modified to calculate the hydraulic conductivity
of an unconfined aquifer if data of two steady-state drawdowns and flow
rate are available.
[Eq. III.2.5]
The specific capacity, defined by Eq. III.2.3, can also be used to estimate
the hydraulic conductivity of an unconfined aquifer.
Specific capacity = 3.54 gpm/ft
Q
s
w
==
40
11 3.
Q
Kh h
rr
Kh h
rr
=
−
=
−
()
log( / )
.( )
log( / )
2
2
1
2
21
2
2
1
2
21
1055
1 366
for American Practical Units
for SI
K
Qrr
hh
Qrr
hh
=
−
=
−
1055
1 366
21
2
2
1
2
21
2
2
1
2
log( / )
()
log( / )
.( )
for American Practical Units
for SI
©1999 CRC Press LLC
Example III.2.2A Steady-state drawdown from pumping an
unconfined aquifer
A water-table aquifer is 80 ft (24.4 m) thick. Groundwater is being extracted
out from a 4-in (0.1 m) diameter fully penetrating well.
The pumping rate is 40 gpm (0.15 m
3
/min). The aquifer is relatively
sandy with a hydraulic conductivity of 200 gpd/ft
2
. Steady-state drawdown
of 5 ft (1.5 m) is observed in a monitoring well 10 ft (3.0 m) from the pumping
well. Estimate
a. The drawdown 30 ft (9.1 m) away from the well
b. The drawdown in the pumping well
Solutions:
a. First let us determine h
1
(at r
1
= 10 ft):
h
1
= 80 – 5 = 75 ft (or = 24.4 – 1.5 = 22.9 m)
Use Eq. III.2.1:
So, drawdown at 30 ft (9.1 m) away = 80 – 75.7 = 4.3 ft (or = 24.4 –
23.1 = 1.3 m)
b. To determine the drawdown at the pumping well, set r at the well =
well radius = (2/12) ft
So, drawdown in the extraction well = 80 – 72.5 = 7.5 ft
Discussion.
1. In the equation for confined aquifers, the (h
1
– h
2
) term can be replaced
by (s
2
– s
1
), where s
1
and s
2
are the drawdown at r
1
and r
2
, respectively.
However, no analogy can be made here for unconfined aquifers, that
is, (h
2
2
– h
1
2
) can not be replaced by (s
1
2
– s
2
2
).
40
200 75
1055 30 10
75 7
0 15 1440
22 9
91 30
23 1
2
22
2
2
22
2
=
−
→=
=
−
→=
()( )
log( / )
.
( . )( )
.)
log( . / . )
.
h
h
h
h
ft
or
1.366[(200)(0.0410)](
m
40
200 75
1055 2 12 10
72 5
2
22
2
=
−
→=
()( )
log[( / )/ ]
.
h
h ft
©1999 CRC Press LLC
2. The same equation can also be used to determine the radius of influ-
ence, where drawdown is equal to zero. More discussions on this
topic will be given in Chapter six.
Example III.2.2B Estimate hydraulic conductivity of an
unconfined aquifer from steady-state
drawdown data
Use the following information to estimate the hydraulic conductivity of an
unconfined aquifer:
Aquifer thickness = 30.0 ft (9.1 m) thick
Well diameter = 4-in (0.1 m) diameter
Well perforation depth = fully penetrating
Groundwater extraction rate = 20 gpm
Steady-state drawdown = 2.0 ft observed in a monitoring well 5 ft from
the pumping well
= 1.2 ft observed in a monitoring well 20 ft from the pumping well
Solutions:
First we need to determine h
1
and h
2
:
h
1
= 30.0 – 2.0 = 28.0 ft
h
2
= 30.0 – 1.2 = 28.8 ft
Inserting the data into Eq. III.2.5, we obtain:
Discussion
1. In the equation for confined aquifers, the (h
1
– h
2
) term can be replaced
by (s
2
– s
1
), where s
1
and s
2
are the drawdown at r
1
and r
2
, respectively.
However, no analogy can be made here, that is, (h
2
2
– h
1
2
) cannot be
replaced by (s
1
2
– s
2
2
).
2. Drawdown and flow rate data in Examples III.2.1B and III.2.2B (one
for a confined aquifer and the other for an unconfined aquifer) are
the same; however, the calculated hydraulic conductivity values are
different. In these examples, the hydraulic conductivity of the uncon-
fined aquifer is lower, but it delivers the same flow rate with the same
drawdown because the unconfined aquifer has a larger storage coef-
ficient. Refer to Section III.1.4 for discussions of the storage coefficient.
K =
−
=
( )( ) log( / )
(. )
1055 20 20 5
28 8 28
280
22
gpd/ft
2
©1999 CRC Press LLC
Example III.2.2C Estimate hydraulic conductivity of an
unconfined aquifer using specific capacity
Use the pumping and drawdown data in Example III.2.2A to estimate the
hydraulic conductivity of the aquifer:
Aquifer thickness = 80 ft
Pumping rate = 40 gpm
Steady-state drawdown in the well = 7.5 ft
Solutions:
a. First let us determine the specific capacity of this well. Use Eq. III.2.3,
b. The transmissivity of the aquifer can be estimated as
T = (5.3)(1550) = 8220 gpd/ft
c. The hydraulic conductivity of the aquifer can be estimated as
K = T/b = 8220/80 = 103 gpd/ft
2
Discussion. The calculated hydraulic conductivity, 103 gpd/ft
2
, from
this exercise has the same order of magnitude as the value specified in
Example III.2.2A, 200 gpd/ft
2
.
III.3 Aquifer test
In Section III.2, methods using the steady-state drawdown data (Eqs. III.2.2
and III.2.5) were described to estimate the hydraulic conductivity of aquifers.
For a groundwater remediation project, it is often required to have a good
estimate of the hydraulic conductivity before the full-scale groundwater
extraction. Grain-size analysis of aquifer materials and bench-scale testing
on core samples can provide some limited information. For more accurate
estimates, aquifer tests are often conducted.
Pumping tests and slug tests are two common types of aquifer tests. In
a typical pumping test, groundwater is extracted from a pumping well at a
constant rate. (Other pumping schemes are also feasible, but not as popular.)
The time-dependent drawdowns (or recovery) in the pumping well and/or
in a few monitoring wells are recorded. The data are then analyzed to deter-
mine the hydraulic conductivity and storativity. The pumping test is recom-
mended because it provides information on subsurface hydrogeology over
a large area (the area affected by the pumping) and gives a realistic estimate
of the pumping rate for the full-scale groundwater extraction. Many reme-
Specific capacity gpm/ft== =
Q
s
w
40
75
53
.
.
©1999 CRC Press LLC
diation systems have been incorrectly designed and installed for a flow rate
much higher than the extraction wells could yield for lack of accurate aquifer
information. In addition, analysis of groundwater extracted during a pump
test will give the engineers a more realistic estimation of the contaminant
concentrations for treatment system design than those just based on the data
from sampling of monitoring wells. The disadvantage of a pumping test is
mainly the cost of conducting the test, data analysis, and treatment and
disposal of the extracted water, which is usually contaminated.
A cheaper alternative to a pumping test is a slug test in which a slug of
known volume is injecting into a well. The rate at which the water level falls
is collected and analyzed. The disadvantages of a slug test are (1) it provides
only the hydrological information related to the vicinity of the well and (2)
it provides no additional information for estimates of the contaminant con-
centration as the full-scale remediation program starts. No further discus-
sions on slug tests will be given here.
The flow in the aquifer during a pumping test is considered to be under
unsteady-state conditions. Three common methods are used to analyze the
unsteady-state data: (1) Theis curve matching, (2) the Jacob straight-line
method, and (3) the distance-drawdown method.
III.3.1 Theis Method
The drawdown for confined aquifers under unsteady-state pumping was
first solved by C.V. Theis as
[Eq.III.3.1]
where the argument u is dimensionless and given as
[Eq. III.3.2]
and s = drawdown at time t (in ft or m), Q = constant pumping rate (in gpm
or m
3
/d), r = radial distance from the pumping well to the observation well
(in ft or m), S = aquifer storativity (dimensionless), T = aquifer transmissivity
(in gpd/ft or m
2
/d), and t = time since pumping started (in days).
s
Q
T
uu
uuu
Q
T
uu
uuu
=−−+−
⋅
+
⋅
−
⋅
+…
=− −+−
⋅
+
⋅
−
⋅
+…
114 6
0 5772
22 33 44
4
0 5772
22 33 44
234
234
.
.ln()
!!!
.ln()
!!!
in American Practical Units
in SI
π
u
rS
Tt
rS
Tt
=
=
187
4
2
2
.
in American Practical Units
in SI
©1999 CRC Press LLC
The infinite series term in Eq. III.3.1 (the terms inside the square bracket)
is often called the well function and designated as W(u). Tabulated values of
W(u) as a function of u can be found in most of the groundwater hydrology
books. (The well function tables have become obsolete because of the conve-
nience of hand calculators and personal computers.) A type-curve approach
is often developed to match the time and drawdown data to the curve of
W(u) vs. 1/u. From the match points the transmissivity and storativity can
be determined. There are several computer programs available on the market
for Theis curve matching. This subsection will provide one example of using
the Theis equation, but no examples for curve matching will be given.
Example III.3.1 Estimate unsteady-state drawdown of a confined
aquifer using the Theis equation
A pumping well is installed in a confined aquifer. Use the following infor-
mation to estimate the drawdown at a distance 20 feet away from the well
after one day of pumping:
Aquifer thickness = 30.0 ft
Groundwater extraction rate = 20 gpm
Aquifer hydraulic conductivity = 400 gpd/ft
2
Aquifer storativity = 0.005
Solutions:
a. T = Kb = (400)(30) = 12,000 gpd/ft.
b. Inserting the data into Eq. III.3.2, we obtain
c. Substitute the value of u in the well function to obtain its value:
d. The drawdown can then be determined from Eq. III.3.1:
s = (114.6)(20)(7.50)/(12,000) = 1.43 ft
u
rS
Tt
== =×
−
1 87 1 87 20 0 005
12 000
312 10
22
4
()(.)
(,
.
ft
gpd/ft)(1 day)
Wu() . ln(. ) (. )
(. )
!
(. )
!
(. )
!
.
=− − × + ×
[
−
×
⋅
+
×
⋅
−
×
⋅
+…
=
−−
−
−−
0 5772 3 12 10 3 12 10
312 10
22
312 10
33
312 10
44
750
44
42
43 44
©1999 CRC Press LLC
Discussion. For the small u values, the third and later terms in the
well function can be truncated without causing a significant error.
III.3.2 Cooper–Jacob straight-line method
As shown in the last example, the higher terms in the well function become
negligible for small u values. Cooper and Jacob in 1946 pointed out that, for
small u values, the Theis equation can be modified to the following form
without significant errors:
[Eq. III.3.3]
where the symbols represent the same terms as in Eq. III.3.1.
As shown in Eq. III.3.2, the value of u becomes small as t increases and
r decreases. So Eq. III.3.3 is valid after sufficient pumping time and at a short
distance from the well (u < 0.05). It can be seen from Eq. III.3.3, at any specific
location (r = constant), s varies linearly with log[(constant)t]. The Jacob’s
straight line method is to plot drawdown vs. pumping time data from a
pumping test on semilog paper; most of the data should fall on a straight
line. From the plot, the slope, ∆s (the change in drawdown per one log cycle
of time), and the intercept, t
o
, of the straight line at zero drawdown can be
derived. The following relationships can then be used to determine the
transmissivity and storativity of the aquifer:
[Eq.III.3.4]
[Eq.III.3.5]
where ∆s is in ft or in m, t
o
in days, and the other symbols represent the
same terms as in Eq. III.3.1.
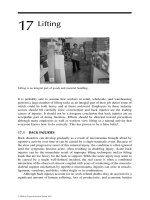
Example III.3.2 Analysis of pumping test data using Cooper-
Jacob’s straight-line method
A pumping test (Q = 120 gpm) was conducted on a confined aquifer (aquifer
thickness = 30.0 ft). The time-drawdown data at a distance 150 ft away from
the well were collected and are shown in the following table.
Use the Cooper–Jacob straight-line method to determine the hydraulic
conductivity and storativity of the aquifer.
s
Q
T
Tt
rS
Q
T
Tt
rS
=
=
264 0 3
0 183 2 25
2
2
log
.
.
log
.
in American Practical Units
in SI
T
Q
s
Q
s
==
264 0 183
∆∆
in American Practical Units in SI
.
S
Tt
r
Tt
r
oo
==
03 225
22
in American Practical Units in SI
©1999 CRC Press LLC
Solutions:
a. The data are first plotted on a semilog scale.
From the plot, we find ∆s = 0.7 ft.
b. Use Eq. III.3.4
c. Hydraulic conductivity can then be found as
K = T/b = (18,860)/(30) = 629 gpd/ft
2
d. From the plot, we find the intercept, t
o
= 4.5 min = 3.1 × 10
–3
day.
Use Eq. III.3.5 to find the storativity:
Discussion. At t = 7 minutes (0.00486 day) and r = 150 ft, u is equal to
Time since pumping started (min) Drawdown, s (ft)
7 0.15
20 0.45
80 0.90
200 1.16
Figure E.III.3.2 Cooper–Jacob straight line method for pumping data analysis.
T
Q
s
== =
264 264 50
07
18 860
∆
()()
.
, gpd/ft
S
Tt
r
o
== =
03
0 3 18 860 0 0031
150
0 00078
22
.
( . )( , )( . )
()
.
©1999 CRC Press LLC
At t = 60 min, u will be smaller than 0.05.
III.3.3 Distance-drawdown method
It can be seen from Eq. III.3.3, at any specific location (r = constant), s varies
linearly with log[(constant)/r
2
]. Based on this relationship and simultaneous
drawdown measurements in at least three observation wells each at a dif-
ferent distance from the pumping well, a semilog distance-drawdown graph
can be constructed. From the plot, the slope, ∆s (the change in drawdown
per one log cycle of distance), and the intercept, r
o
, of the straight line at zero
drawdown can be derived. The following relationships can then be used to
determine the transmissivity and storativity of the aquifer:
[Eq.III.3.6]
[Eq.III.3.7]
where ∆s is in ft or in m, r
o
is in ft or in m, and the other symbols represent
the same terms as in Eq. III.3.1.
The three methods described here for analysis of pumping test data are
mainly for confined aquifers. A well pumping from an unconfined aquifer
is more complicated. The extracted water comes from two mechanisms: (1)
water from the elastic storage due to the decline in pressure, as in the case
of the confined aquifer, and (2) water from drainage of the declining water
table. There are three distinct phases of time-drawdown relations in uncon-
fined aquifers. However, as time progresses, the rate of drawdown decreases
and flow becomes essentially horizontal (when the effects of gravity drainage
become much smaller). The time-drawdown data can then be analyzed using
the three methods described above.
2
A more practical approach is to ensure
that the duration of the pumping test exceeds the suggested guidelines in
Table III.3.A.
5
As shown in the table, the suggested pumping duration
increases with the tightness of the aquifer. A minimum of 7 days pumping
is suggested for silty or clayey aquifers.
Example III.3.3 Analysis of pumping test data using the
distance-drawdown method
A pumping test (Q = 120 gpm) was conducted on a confined aquifer (aquifer
thickness = 30.0 ft). The distance-drawdown (at t = 90 minutes) were col-
lected from three monitoring wells and shown in the following table.
u
rS
Tt
== =
1 87 1 87 150 0 00078
18 860
036
22
()(.)
(,
.
ft
gpd/ft)(0.00486day)
T
Q
s
Q
s
==
528 0 366
∆∆
in American Practical Units in SI
.
S
Tt
r
Tt
r
oo
==
03 225
22
in American Practical Units in S
I
©1999 CRC Press LLC
Use the distance-drawdown method to determine the hydraulic conduc-
tivity and storativity of the aquifer.
Solutions:
a. The data are first plotted on a semilog scale.
From the plot, we find ∆s = 1.4 ft.
b. Use Eq. III.3.6 to find the transmissivity:
c. Hydraulic conductivity can then be found as
K = T/b = (18,860)/(30) = 629 gpd/ft
2
d. From the plot, we find the intercept, r
o
= 650 ft.
e. Use Eq. III.3.7 and t = 90 min = 0.0625 day to find the storativity:
Distance from the
pumping well (ft) Drawdown, s (ft)
50 1.55
150 0.90
300 0.50
Figure E.III.3.3 Distance-drawdown method for pumping data analysis.
T
Q
s
== =
528 528 50
14
18 860
∆
()()
.
, gpd/ft
S
Tt
r
o
== =
03
0 3 18 860 0 0625
650
0 00084
22
.
( . )( , )( . )
()
.