Volume 12 - Fractography Part 4 doc
Bạn đang xem bản rút gọn của tài liệu. Xem và tải ngay bản đầy đủ của tài liệu tại đây (5.15 MB, 60 trang )
Fig. 3
Comparison of light microscope (a and b) and SEM (c and d) fractographs of cleavage of faces in a
coarse-grain Fe-2.5Si alloy broken at -195 °C (-320 °F). (a) Bright-field illumination. (b) Dark-
field illumination. (c)
Secondary electron image. (d) Everhart-Thornley backscattered electron image. All 60×
Fig. 4 Comparison of light microscope (a and b) and SEM (c and d) fractographs of cleavage facets in
a
coarse-grain Fe-2.5Si alloy impact specimen broken at -195 °C (-320 °F). (a) Bright-
field illumination. (b)
Dark-field illumination. (c) Secondary electron image. (d) Everhart-Thornley backscattered electron image. All 60×
Fig. 5 Comparison of light
microscope (a and b) and SEM (c and d) fractographs of cleavage facets in a
coarse-grain Fe-2.5Si alloy impact specimen broken at -195 °C (-320 °F). (a) Bright-
field illumination. (b)
Dark-filled illumination. (c) Secondary electron image. (d) Secondary e
lectron image. (a) and (c) 120×. (b) and (d)
240×
Figure 4 shows similar bright-field and dark-field light fractographs of cleavage facets in the Fe-2.5Si alloy as well as
secondary electron and Everhart-Thornley backscattered electron images of another area. The images shown in Fig. 4 are
similar to those shown in Fig. 3. Figure 5 shows higher-magnification bright-field light fractographs of coarse cleavage
facets in the Fe-2.5Si specimen and SEM secondary electron images at the same magnification. All four fractographs are of
different areas.
Figure 6 shows the interface between the fatigue precrack and test fracture of an X-750 nickel-base superalloy subsize
Charpy rising-load test specimen after testing in pure water at 95 °C (200 °F). The interface region is shown by bright-field
and dark-field light microscopy (same areas) and by secondary electron and Everhart-Thornley backscattered electron
images (different location, same areas). At the magnification used, evidence of fatigue striations in the precracked region is
barely visible in the light microscope images compared to the SEM images. The test fracture region is intergranular, but this
is not obvious in the light fractographs, Figure 7 shows bright-field and dark-field fractographs of the fatigue-precracked
region, in which the striation are more easily observed than in Fig. 6. Figure 8 shows secondary electron SEM fractographs
of the striations in the precrack region at the same magnifications as in Fig. 7. Figure 9 shows bright-field and dark-field
light fractographs of the intergranular region. The intergranular nature of this zone is more obvious in Fig. 9 than in Fig. 6.
Figure 9 also shows corresponding secondary electron and Everhart-Thornley backscattered electron fractographs of the
intergranular test fracture.
Fig. 6
Comparison of light microscope (a and b) and SEM (c and d) fractographs of the interface between the
fatigue-precracked region and the test fracture in an X-750 nickel-base superalloy rising-
load test specimen. The
test was performed in pure water at 95 °C (200 °F). Note the intergranular nature of the fracture. (a) Bright-
field
illumination. (b) Dark-field illumination. (c) Secondary electron image. (d) Everhart-
Thornley backscattered
electron image. All 60×
Fig. 7 Light microscope fractographs of the fatigue-precracked region of an alloy X-
750 rising load test specimen.
(a) Bright-field image. (b) Dark-field image. (c) Bright-field image. (d) Dark-
field image. (a) and (b) 60×. (c) and
(d) 240×.
Fig. 8 Secondary electron images of the fatigue-precracked region of an alloy X-750 test specimen.
(a) 65×. (b)
260×
Fig. 9
Comparison of light microscope (a and b) and SEM (c and d) fractographs of the test fracture in an alloy
X-750 rising-load test specimen. Test was p
erformed in pure water at 95 °C (200 °F). Note the intergranular
appearance of the fracture. (a) Bright-field image. (b) Dark-field image. (c) Secondary electron image.
(d)
Everhart-Thornley backscattered electron image. All 60 ×
For comparison, Fig. 10 shows a similar X-750 rising-load specimen tested in air in which the test fracture is ductile. Figure
10 shows bright-filed and dark-field light fractographs of the interface between the fatigue precrack and the ductile fracture.
A secondary electron fractograph is also included for comparison. Figure 11 shows high-magnification bright-field and
dark-field light fractographs and a secondary electron fractograph of the ductile region of the test fracture at the same
magnification. Microvoid coalescence (dimples) can be observed in all the fractographs, but the limited depth of field of the
light fractographs is obvious.
Fig. 10 Comparison of light microscope (a and b) and SEM (c) images of the interface between the fatigue-
precrack
area (left) and the test fracture region (right) of an alloy X-750 rising-
load test specimen broken in air. The test
fracture is ductile. (a) Bright-field image. (b) Dark-field image. (c) Secondary electron image. All 68×
Fig. 11 Comparison of light microscope (a and b) and SEM (c) images of a ductile fracture in an alloy X-
750
rising-load test specimen broken in air. (a) Bright-field image. (b) Dark-
field image. (c) Secondary electron image.
All 240×
These examples demonstrate that the microscopic aspects of fractures can be assessed with the light microscope. Although
the examination is easier and the results are better with SEM, light microscopy results are adequate in many cases. Such
examination is easiest to accomplish when the fracture is relatively flat. For rougher, more irregular surfaces, SEM is far
superior.
As a further note on the use of the light microscope to examine fractures, Fig. 12 shows a cleavage fracture in a low-carbon
martensitic steel examined by using three direct and three replica procedures. Figure 12(a) shows an example of the
examination of the fracture profile after nickel plating the surface. The flat, angular nature of the fracture surface is
apparent. Figures 12(b) and 12(d) show a light microscope direct view the cleavage surface and a light microscope view of
a replica. Figures 12(c) and 12(e) shows a direct SEM view of the fracture and a view of a replica of the fracture by SEM,
respectively. Lastly, Fig. 12(f) shows a TEM replica of the fracture, but at a much higher magnification. The transmission
electron microscope cannot be used at magnifications below about 2500×.
Fig. 12
Examples of three direct (a to c) and three replication procedures (d to f) for examination of a cleavage
fracture in a low-carbon martensitic steel. (a) Light micr
oscope cross section with nickel plating at top. (b) Direct
light fractograph. (c) Direct SEM fractrograph. (d) Light fractograph of replica. (e) SEM fractrograph of replica. (f)
TEM fractrograph of replica
Replicas for Light Microscopy
In some situations, primarily in failure analysis, the fracture face cannot be sectioned, generally for legal reasons, so that it
can fit within the chamber of the scanning electron microscope. In such cases, the fractographer can use replication
procedures with examination by light microscopy, SEM, or TEM. The replication procedures for light microscopy are
similar to those traditionally used for TEM fractography (Ref 6, 7, 8).
In general, the 0.25-nm (0.01-in) thick cellulose acetate tape used for light microscopy is thicker than that used for TEM.
The tape is moistened on one side with acetone, and this side is then pressed onto the fracture surface and held tightly in
place, without motion, for 1 to 2 min. When thoroughly dry, the tape is carefully stripped from the fracture surface. An
alternate procedure consists of, first, preparing a viscous solution of cellulose acetate tape dissolved in acetone and applying
a thin coating to the fracture. Then, a piece of cellulose acetate tape is placed on top of this layer, pressed into the fracture,
and held in place for 1 to 2 min. After drying, it is stripped from the fracture.
The stripped tape is a negative replica of the fracture and can be viewed as stripped from the fracture, and it can be
photographed to record macroscopic fracture features (Fig. 13). This tape is a permanent record of the fracture for future
examination even if the fracture is sectioned.
Fig. 13
Transparent tape replica of a fracture surface. See the article "Transmission Electron Microscopy" in this
Volume for more information on replication techniques.
Additional contrast can be obtained by shadowing the replica with either carbon or a heavy metal, such as chromium,
molybdenum, gold, or gold-palladium, as is normally done in TEM fractography. Some fractographers also coat the back
side of the replica with a reflective metal, such as aluminum, for reflected-light examination, or they tape the replica to a
mirror surface. With an inverted microscope, some fractographers place the replica over the stage plate and then place a
polished, unetched specimen against the tape to hold it flat and to reflect the light. Others prefer to examine the tape with
transmitted light, but not all metallographers have access to a microscope with transmitted-light capability. Figure 14
illustrates low-power examination procedures for examination of replicas by light microscopy. Figure 14(a) shows the
replica photographed with oblique illumination from a point source lamp, and Fig. 14(b) shows the same area using
transmitted light. Carbon was then vapor deposited onto the replica, and it was photographed again using oblique light from
a point source (Fig. 14c). Figure 14(c) exhibits the best overall contrast and sharpest detail. Figure 12(d) illustrates
examination of a fracture replica by light microscopy using high magnification. This replica was shadowed with
gold-palladium.
Fig. 14 Comparison of replica fractographs of a fatigue fracture in an induction-
hardened 15B28 steel shaft.
Fracture was initiated at the large inclus
ion in the center of the views during rotating bending. (a) Oblique
illumination from a point source lamp. (b) Same area as (a), photographed using transmitted light. (c) Replica
shadowed with a vapor-deposited coating and photographed using oblique illumi
nation from a point source lamp.
All 30×
Fracture Profile Sections
Despite the progress made in direct examination of fracture surfaces, examination of sections perpendicular to the fracture,
particularly those containing the initiation site, is a very powerful tool of the fractographer and is virtually indispensable to
the failure analyst. If the origin of the fracture can be found, the failure analyst must examine the origin site by using
metallographic cross sections. This is the only practical method for characterizing the microstructure at the origin and for
assessing the role that the microstructure may have had in causing or promoting the fracture.
The safest procedure is to cut the sample to one side of the origin, but only after all prior nondestructive examinations have
been completed. Cutting must be done in such a manner that damage is not produced. A water-cooled abrasive cutoff
machine or a low-speed diamond saw is typically used. For optimum edge retention, it is recommended that the surface be
plated, generally with electroless nickel, although some metals cannot be plated in this manner (Ref 9) and require other
plating procedures. Figure 15 demonstrates the excellent edge retention that can be obtained with electroless nickel. A
number of other edge retention procedures can also be used (Ref 9).
Fig. 15
Example of the use of electroless nickel plating to provide edge retention. The micrograph shows wear
damage at the surface of a forged alloy steel Medart roll. Etched with 2% nital. 285×
Examination of fracture profiles yields considerable information about the fracture mode and mechanism and about the
influence of microstructure on crack initiation and propagation. This is accomplished by examining partially fractured (Ref
10, 11, 12, 13, 14, 15) or completely fractured (Ref 16 17, 18, 19, 20, 21, 22, 23, 24, 25, 26) specimens: Quantitative
fractography makes extensive use of fracture profiles (additional information is available in the article "Quantitative
Fractography" in this Volume). One interesting approach defines a fracture path preference index to describe the probability
of a particular microstructural constituent being associated with a particular fracture mode to assess the relationship
between fracture characteristics and microstructure (Ref 24).
In general, it is easier to assess the relationship between crack path and microstructure by using secondary cracks because
both sides of the fracture can be examined. On a completely broken specimen, only one side can be examined; this makes
the analysis more difficult.
Although most light micrographs are taken with bright-field illumination, the analyst should also try other illumination
modes. Fractures should be initially examined on cross sections in the unetched condition and then should be examined after
etching. Naturally, a high-quality polish is required, and the effort extended in achieving a high-quality surface is always
rewarded with improved results and ease of correct interpretation. Errors in interpretation are made when specimens are not
properly prepared.
As-polished samples should be examined first with bright-field illumination and then with dark-filled illumination,
differential interference contrast (DIC) or oblique light, and polarized light, if the specimen will respond to such
illumination. Dark-field illumination is very useful and is highly suited to the examination of cracks and voids. Photography
in dark field is more difficult, but not impossible if an automatic exposure device is available. Oblique light and DIC are
very useful for revealing topographic (relief) effects. For example, Fig. 16 shows a fatigue crack in an aluminum alloy
viewed with bright-field illumination and DIC where the specimen was not etched. Although the second-phase precipitates
can be seen in both views, they are more clearly revealed with DIC (compare these views with the bright-field etched
micrograph of this specimen shown in Fig. 71).
Fig. 16 Comparison of bright-field (a) and Nomarski DIC (b) illumination for examination of a fat
igue crack in an
as-polished aluminum alloy. See also Fig. 71. Both 600×
Another example of the examination of fracture profiles is shown in Fig. 17, which illustrates an impact fracture in an
austenitic weld containing phase. This sample is in the as-polished condition and is shown examined with bright-field,
DIC, and dark-field illumination. It is clear that full use of the light microscope can provide a better description of the
relationship of the crack path to the microstructure.
Fig. 17 Comparison of bright-field (a), DIC (b), and dark-
field (c), illumination for viewing a partially fractured (by
impact) specimen of AISI type 312 weld metal containing substantial phase. All 240×
Examination of properly polished specimens without etching often presents a clearer picture of the extent of fracture
because etched microstructural detail does not obscure the crack detail. Etching presents other dark linear features, such as
grain boundaries, that may be confused with the crack details. Therefore, it is always advisable to examine the specimens
unetched first. Also, inclusions and other hard precipitates are more visible in unetched than in etched specimens. After
careful examination of the as-polished specimen, the sample should be etched and the examination procedure repeated.
Examples of fracture profile sections in the etched condition will be shown later in this article.
Taper Sections
Taper sections are often used to study fractures (Ref 9, 27, 28, 29, 30, 31). In this method, the specimen is sectioned at a
slight angle to the fracture surface. Polishing of this plane produces a magnified view of the structure perpendicular to the
fracture edge. The magnification factor is defined by the cosecant of the sectioning angle; an angle of 57° 43' gives a tenfold
magnification.
Etching Fractures
Zapffe (Ref 2) and others (Ref 32, 33, 34, 35, 36, 37) have etched fracture surfaces in order to gain additional information.
In general, etching is used to reveal the microstructure associated with the fracture surface (Ref 2, 36) or to produce etch pit
attack to reveal the dislocation density and the crystallographic orientation of the fracture surfaces. Figure 18 shows an
example of fracture surface etching of a cleavage fracture in a carbon steel sample. Although the etched fractures can be
examined by light microscopy, SEM is simpler and produces better results.
Fig. 18 Example of the use of etching to produce etch pits (arrows) on a cleavage fracture. (a) As-
fractured. 320×.
(b) Etched 60 s with nital. 320×. (c) Etched 360 s with nital. 320 ×. (d) Etched 360 s with nital. 1280×
Deep-Field Microscopy
The deep-field microscope provides greater depth of field for optical examination and photography of fractures (Ref 38, 39,
40). Its theoretical depth of field is 6 mm at 38× and 600 m at 250× (Ref 39). The instrument uses a very thin beam of light
to illuminate the specimen. The light beam is at a constant distance from the objective of the microscope and is at the focal
plane. During photographic exposure, the specimen is moved at a constant rate up through the light beam. Only the
illuminated portions of the specimen are recorded photographically, and all of the illuminated portions are in focus;
therefore, the resultant photograph is in focus. The use of the deep-field microscope and the problems encountered in
obtaining good fractographs are discussed in Ref 39.
References cited in this section
2. C.A. Zapffe and M. Clogg, Jr., Fractography A New Tool for Metallurgical Research, Trans. ASM,
Vol 34,
1945, p 77-107
3. C.A. Zapffe et al., Fractography: The Study of Fractures at High Magnification, Iron Age,
Vol 161, April
1948, p 76-82
4. C.A. Zapffe and C.O. Worden, Fractographic Registrations of Fatigue, Trans. ASM, Vol 43, 1951, p 958-969
5. C.A. Zapffe et al., Fractography as a Mineralogical Technique, Am. Mineralog.,
36 (No. 3 and 4), 1951, p
202-232
6. K. Kornfeld, Celluloid Replicas Aid Study of Metal Fractures, Met. Prog., Vol 77, Jan 1960, p 131-132
7. P.J.E. Forsyth and D.A. Ryder, Some Results of t
he Examination of Aluminum Alloy Specimen Fracture
Surfaces, Metallurgical, March 1961, p 117-124
8.
K.R.L. Thompson and A.J. Sedriks, The Examination of Replicas of Fracture Surfaces by Transmitted Light,
J. Austral. Inst. Met., Vol 9, Nov 1964, p 269-271
9. G.F. Vander Voort, Metallography: Principles and Practice, McGraw-Hill, 1984
10.
H.C. Rogers, The Tensile Fracture of Ductile Metals, Trans. AIME, Vol 218, June 1960, p 498-506
11.
C. Laird and G.C. Smith, Crack Propagation in High Stress Fatigue, Philos. Mag., Vol 7, 1962, p 847-857
12.
C. Laird, The Influence of Metallurgical Structure on the Mechanism of Fatigue Crack Propagation, in
Fatigue Crack Propagation, STP 415, American Society for Testing and Materials, 1967, p 131-180
13.
D.P. Clausing, The Development of Fibrous Fracture in a Mild Steel, Trans. ASM, Vol 60, 1967, p 504-515
14.
I.E. French and P.F. Weinrich, The Shear Mode of Ductile Fracture in a Spheroidized Steel, Metall. Trans.,
Vol 10A, March 1979, p 297-304
15.
R.H. Van Stone a
nd T.B. Cox, Use of Fractography and Sectioning Techniques to Study Fracture
Mechanisms, in Fractographic-Microscopic Cracking Processes,
STP 600, American Society for Testing and
Materials, 1976, p 5-29
16.
R.W. Staehle et al., Mechanism of Stress Corros
ion of Austenitic Stainless Steels in Chloride Waters,
Corrosion, Vol 15, July 1959, p 51-59 (373t-381t)
17.
K.W. Burns and F.B. Pickering, Deformation and Fracture of Ferrite-Pearlite Structures, J. Iron Steel Inst.,
Vol 202, Nov 1964, p 899-906
18.
J.H. Bucher et al., Tensile Fracture of Three Ultra-High-Strength Steels, Trans. AIME,
Vol 233, May 1965, p
884-889
19.
U. Lindborg, Morphology of Fracture in Pearlite, Trans. ASM, Vol 61, 1968, p 500-504
20.
C.T. Liu and J. Gurland, The Fracture Behavior of Spheroidized Carbon Steels, Trans. ASM,
Vol 61, 1968, p
156-167
21.
D. Eylon and W.R. Kerr, Fractographic and Metallographic Morphology of Fatigue Initiation Sites, in
Fractography in Failure Analysis, STP 645, American Society for Testing and Materials, 1978, p 235-248
22.
W.R. Kerr et al.,
On the Correlation of Specific Fracture Surface and Metallographic Features by Precision
Sectioning in Titanium Alloys, Metall. Trans., Vol 7A, Sept 1976, p 1477-1480
23.
D.E. Passoja and D.J. Amborski, Fracture Profile Analysis by Fourier Transform Methods in
Microstructural
Science, Vol 6, Elsevier, 1978, p 143-158
24.
W.T. Shieh, The Relation of Microstructure and Fracture Properties of Electron Beam Melted, Modified SAE
4620 Steels, Metall. Trans., Vol 5, May 1974, p 1069-1085
25.
J.R. Pickens and J. Gurland, Metallographic Characterization of Fracture Surface Profiles on Sectioning
Planes, in Proceedings of the 4th International Congress for Stereology,
NBS 431, National Bureau of
Standards, 1976, p 269-272
26.
S.M. El-Soudani, Profilometric Analysis of Fractures, Metallography, Vol 11, July 1978, p 247-336
27.
E. Rabinowicz, Taper Sectioning. A Method for the Examination of Metal Surfaces, Met. Ind.,
Vol 76, 3 Feb
1950, p 83-86
28.
L.E. Samuels, An Improved Method for the Taper Sectioning of Metallographic Specimens, Metallurgia,
Vol
51, March 1955, p 161-162
29.
W.A. Wood, Formation of Fatigue Cracks, Philos. Mag., Vol 3 (No. 31), Series 8, July 1958, p 692-699
30.
W.A. Wood and H.M. Bendler, Effect of Su
perimposed Static Tension on the Fatigue Process in Copper
Subjected to Alternating Torsion, Trans. AIME, Vol 224, Feb 1962, p 18-26
31.
W.A. Wood and H.M. Bendler, The Fatigue Process in Copper as Studied by Electron Metallography,
Trans.
AIME, Vol 224, Feb 1962, p 180-186
32.
P.J.E. Forsyth, Some Metallographic Observations on the Fatigue of Metals, J. Inst. Met., Vol 80, 1951-
1952,
p 181-186
33.
K. Kitajima and K. Futagami, Fractographic Studies on the Cleavage Fracture of Single Crystals of Iron, in
Electron Microfractography, SPT 453, American Society for Testing and Materials, 1969, p 33-59
34.
R.M.N. Pelloux, Mechanisms of Formation of Ductile Fatigue Striations, Trans. ASM,
Vol 62, 1969, p
281-285
35.
W.D. Hepfer et al., A Method for Determining
Fracture Planes in Beryllium Sheet by the Use of Etch Pits,
Trans. ASM, Vol 62, 1969, p 926-929
36.
A. Inckle, Etching of Fracture Surfaces, J. Mater. Sci., Vol 5 (No. 1), 1970, p 86-88
37.
Y. Mukai et al., Fractographic Observation of Stress-Corrosion
Cracking of AISI 304 Stainless Steel in
Boiling 42 Percent Magnesium-Chloride Solution, in Fractography in Failure Analysis,
STP 645, American
Society for Testing and Materials, 1978, p 164-175
38.
D. McLachlan, Jr., Extreme Focal Depth in Microscopy, Appl. Opt., Vol 3 (No. 9), 1964, p 1009-1013
39.
M.D. Kelly and J.E. Selle, The Operation and Modification of the Deep Field Microscope, in
Proceedings of
the 2nd Annual Technical Meeting, International Metallographic Society, 1969, p 171-177
40.
J.H. Waddell, Deep-Field Low-Power Microscope, Res. Dev., Vol 19, May 1968, p 34
Visual Examination and Light Microscopy
George F. Vander Voort, Carpenter Technology Corporation
Interpretation of Fractures
The study of fractures has been approached in several ways. One procedure is to categorize fractures on the basis of macro-
or microscopic features, that is, by macro- or microfractography. The fracture path may be classified as transgranular or
intergranular. Another approach is to classify all fractures as either ductile or brittle, with all others, such as fatigue, being
special cases of one or the other. In general, all fractures can be grouped into four categories: ductile, brittle, fatigue, or
creep. After these broad groupings, the fractures can be further classified on the basis of environmental influences, stress
situations, or embrittlement mechanisms. In this section, the macro- and microscopic characteristics of fractures produced
by the more common mechanisms will be described and illustrated, with emphasis on visual and light microscopy
examination. Detailed information on this subject is also available in the article "Modes of Fracture" in this Volume.
Ductile Fractures
Ductile fractures have not received the same attention as other fracture mechanisms because their occurrence results from
overloading under predictable conditions. From the standpoint of failure analysis, ductile failures are relatively uncommon,
because their prevention through proper design is reasonably straightforward. Ductile failures, however, are of considerable
interest in metal-forming operations and in quality control studies, such as materials evaluation.
Ductile failures occur through a mechanism known as microvoid coalescence (Ref 41, 42, 43). The microvoids are
nucleated at any discontinuity where a strain discontinuity exists for example, grain of subgrain boundaries, second-phase
particles, and inclusions. These microvoids, shown in Fig. 10 and 11, are referred to as dimples. Because of the roughness of
the dimples, they are best observed with the scanning electron microscope. On a typical ductile fracture, fine precipitates,
generally inclusions, can usually be observed in nearly half of the dimples (there are two halves of the fracture; therefore, on
any fracture face, only half of the dimples, or fewer, will contain precipitates). Ductile fracture is sometimes referred to as
dimple rupture; such is the case in the article "Modes of Fracture" in this Volume.
Ductile fractures exhibit certain characteristic microscopic features:
• A relatively large amount of plastic deformation precedes the fracture
• Shear lips are usually observed at the fracture termination areas
•
The fracture surface may appear to be fibrous or may have a matte or silky texture, depending on the
material
• The cross section at the fracture is usually reduced by necking
• Crack growth is slow
The macroscopic appearance of a ductile fracture is shown by the controlled laboratory fracture of a spherical steel pressure
vessel measuring 187 mm (7
3
8
in.) outside diameter and 3.2 mm (
1
8
in.) in wall thickness that was made from
quenched-and-tempered AISI 1030 aluminum-killed fine-grain steel with an impact transition temperature below -45 °C
(-50 °F). At room temperature, ductile rupture occurred when the vessel was pressurized to 59 MPa (8500 psig) (Fig. 19).
Figure 20 shows an identical vessel pressurized to failure at -45 °C (-50 °F) at 62 MPa (9000 psig). Greater pressure was
required because the strength of the steel was greater at -45 °C (-50 °F) than at room temperature. Both failures are ductile.
This vessel was designed to contain gas at 31 MPa (4475 psig). Therefore, the failures occurred by overloading.
Fig. 19 Macrograph showing ductile overload fracture of a high-
pressure steel vessel tested at room temperature.
See also Fig. 20.
Fig. 20 Macrograph showing ductile overload fracture of a high-pressure steel vessel tested at -45 °C (-50 °F).
See
also Fig. 19.
From a microscopic viewpoint, a ductile fracture exhibits microvoid coalescence and transgranular fracture. The dimple
orientation will vary with stress orientation. Dimple shapes and orientations on mating fractures as influenced by the
manner of load application are summarized in Ref 44. Dimple shape is a function of stress orientation, with equiaxed
dimples being formed under uniaxial tensile loading conditions. Shear stresses develop elongated, parabolically shaped
dimples that point in opposite directions on the mating fracture surfaces. If tearing occurs, the elongated dimples point in the
same direction on the mating fracture surfaces.
The number of dimples per unit area on the fracture surface depends on the number of nucleation sites and the plasticity of
the material. If many nucleation sites are present, void growth is limited, because the dimples will intersect and link up. This
produces many small, shallow dimples. If very few nucleation sites are present, there will be small number of large dimples
on the fracture surface.
The interface between two ductile phases can act as a nucleation site, but it is much more common for microvoids to form at
interfaces between the matrix phase and inclusions or hard precipitates. Cementite in steel, either spheroidal or lamellar, can
act as an nucleation site. For example, ductile fractures were studied in an iron-chromium alloy, and large dimples were
observed at sulfide inclusions that subsequently merged with much finer voids at chromium carbides (Ref 45).
Ductile fractures in very pure low-strength metals can occur by shear or necking, and they can rupture without any evidence
of microvoid formation. Such fractures can also be observed in sheet specimens in which triaxial stress development is
negligible. Reference 46 discusses the problem of designing an experiment to prove conclusively whether or not ductile
fracture can occur by void formation in the absence of hard particles. Results of the most carefully controlled experiments
indicate that particles are required for void formation. Studies of high-purity metals have shown that ductile fracture occurs
by rupture without void formation.
Markings can be observed within dimples because considerable plastic deformation is occuring. Such marks have been
referred to as serpentine glide, ripples, or stretching.
Although light microscopy has rather limited value for the examination of ductile dimples (as shown in Fig. 10 and 11),
dimples can be easily observed by using metallographic cross sections. Figure 21 compares the appearance of ductile and
brittle fractures of a quenched-and-tempered low-alloy steel using nickel-plated cross sections. The ductile fracture consists
of a series of connected curved surfaces, and it is easy to envision how this surface would appear if viewed directly. Also,
near the fracture surface, small spherical voids, particularly at inclusions, are often seen that have opened during the fracture
process. These should not be interpreted as pre-existing voids. The brittle fracture, by comparison, is much more angular,
and crack intrusions into the matrix on cleavage planes can be observed (Fig. 21). The problems associated with the
measurement of dimples are discussed in the article "Quantitative Fractography" in this Volume.
Fig. 21 Brittle (a) and ductile (b) crack paths in a fractured quenched-and-tempered low-alloy steel.
Both etched
with 2% nital. 800×
Tensile-Test Fractures
Tensile specimens are tested under conditions that favor ductile fracture, that is, room temperature, low strain rate, and a dry
environment. Nevertheless, the relative amount of ductility exhibited by tensile specimens varies considerably. Although
the percent elongation and percent reduction of area (% RA) are not intrinsic mechanical properties like the yield and tensile
strength, they do provide useful comparative data.
The ideal tensile fracture is the classic cup-and-cone type (Fig. 22a). This type of fracture occurs in highly ductile materials.
Pronounced necking is evident in Fig. 22(a). In comparison, in the brittle tensile fracture shown in Fig. 22(b), no necking
has occurred, and the percent elongation and % RA values are nearly zero. In this type of tensile fracture, the yield and
tensile strengths are essentially identical.
Fig. 22 Macroscopic appearance of ductile (a) and brittle (b) tensile fractures
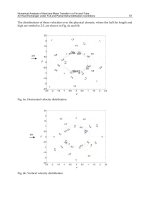
In one investigation, the classic cup-and-cone tensile fracture was studied by optical examination and by etch pitting (Ref
47). Shear-type fracture was found to be present all across the specimen, even in the flat central portion of the fracture. The
approximate magnitude and distributions of longitudinal, radial, and circumferential stresses were determined in
unfractured tensile bars strained at various amounts. The triaxial stresses in the necked section develop the highest shear
stress at the center, not at the surface of the specimen. Shear fracture in cup-and-cone fractures begins at the interior of the
specimen (Fig. 23) and progresses to the surface.
Fig. 23 Initiation of fracture in a tensile-test specimen. Note that the fr
acture initiated at the center of the
specimen 4.75 ×
When a smooth tensile specimen is tested at room temperature, plastic deformation is initially characterized by uniform
elongation. At this stage, voids begin to form randomly at large inclusions and precipitates. With further deformation,
plastic instability arises, producing localized deformation, or necking, and a shift from a uniaxial to a triaxial stress state.
This results in void nucleation, growth, and coalescence at the center of the necked region, forming a central crack.
Continued deformation is concentrated at the crack tips; this produces bands of high shear strain. These bands are oriented
at an angle of 50 to 60° from the transverse plane of the test specimen. Sheets of voids are nucleated in the shear bands, and
these voids grow and link up, producing a serrated pattern as the central crack expands radially. The cup-and-cone walls are
formed when the crack grows to such an extent that the void sheets propagate in one large step to the surface.
Tensile fractures of oxygen-free high-conductivity (OFHC) copper were studied by deforming the specimens in tension
until necking and then halting the test (Ref 10). After radiographic examination, the specimens were sectioned and
examined. This work also showed that ductile tensile fractures begin by void formation, with the voids linking up to form a
central crack. The fracture can be completed either by continued void formation resulting in a cup-and-cone fracture or by
an alternate slip method producing a double-cup fracture. Cup-and-cone fractures are observed in ductile iron-base alloys,
brass, and Duralumin; double-cup fractures are seen in face-centered cubic (fcc) metals, such as copper, nickel, aluminum,
gold, and silver.
Three types of tensile fractures have been observed in tests of fcc metals: chisel-point fractures, double-cup fractures, and
cup-and-cone fractures (Ref 48, 49). The fracture mode changes from chisel-point to double-cup to cup-and-cone as the
precipitate density and alloy content increase.
One investigation studied the influence of particle density and spacing and solute content on tensile fracture of aluminum
alloys (Ref 50). As the particle density increases, there is a large initial decrease in ductility, followed by a gradual loss in
ductility with further increases in particle density. Other studies demonstrated that tensile ductility improves as the volume
fraction of second-phase particles decreases (Ref 51, 52). Particle size and mean interparticle spacing also influence
ductility, but the volume fraction is of greater importance. Dimple size has been shown to increase with increasing particle
size or increasing interparticle spacing, but dimple density increases with increasing particle density (Ref 53). Tensile
ductility in wrought materials is higher in longitudinally oriented specimens (fracture perpendicular to the fiber axis) than in
transversely oriented specimens (fracture parallel to the fiber axis) because of the elongation of inclusions, and some
precipitates, during hot working.
The tensile test is widely used for quality control and material acceptance purposes, and its value is well known to
metallurgists and mechanical engineers. Tensile ductility measurements, although qualitative, are strongly influenced by
microstructure. Transversely oriented tensile specimens have been widely used to assess material quality by evaluation of
the transverse reduction of area (RAT). Numerous studies have demonstrated the structural sensitivity of RAT values (Ref
54, 55, 56, 57, 58, 59, 60).
The macroscopic appearance of tensile fractures is a result of the relative ductility or brittleness of the material being tested.
Consequently, interpretation of macroscopic tensile fracture features is an important skill for the metallurgist. In addition to
the nature of the material, other factors can influence the macroscopic tensile fracture appearance for example, the size and
shape of the test specimen and the product form from which it came, the test temperature and environment, and the manner
of loading.
The classic cup-and-cone tensile fracture exhibits three zones: the inner flat fibrous zone where the fracture begins, an
intermediate radial zone, and the outer shear-lip zone where the fracture terminates. Figure 22(a) shows each of these zones;
the flat brittle fracture shown in Fig. 22(b) has no shear-lip zone.
The fibrous zone is a region of slow crack growth at the fracture origin that is usually at or very close to the tensile axis. The
fibrous zone has either a random fibrous appearance or may exhibit a series of fine circumferential ridges; the latter is
illustrated in Fig. 24. These ridges are normal to the direction of crack propagation from the origin to the surface of the
specimen. The presence of such ridges indicates stable, subcritical crack growth that requires high energy (Ref 61). The
fracture origin is usually located at or near the center of the fracture and on the tensile axis; it can often be observed to
initiate at a hard second-phase constituent, such as an inclusion or a cluster of inclusions. Inspection of tensile fractures at
low magnification for example, with a stereomicroscope will frequently reveal the initiating microstructural constituents
(Ref 62).
Fig. 24 Tensile fracture of a 4340 steel specim
en tested at 120 °C (250 °F). The fracture contains a fibrous zone
and a shear-
lip zone. The steel microstructure consisted of tempered martensite; hardness was 46 HRC. The
fracture started at the center of the fibrous zone, which shows circumferential ridges. The outer ring is the shear-
lip
zone. About 11×
The radial zone results when the crack growth rate becomes rapid or unstable. These marks trace the crack growth direction
from either the edge of the fibrous zone or from the origin itself. In the latter case, it is easy to trace the radial marks
backward to the origin. The radial marks may be fine or coarse, depending on the material being tested and the test
temperature. The radial marks on tensile specimens of high-strength tempered martensite steels are usually rather fine.
Tempering of such samples to lower strengths results in coarser radial marks. Low tensile-test temperatures result in finer
radial marks than those produced with room-temperature tests. In a study of AISI 4340 steel, for example, fine radial marks
were not produced by a shear mechanism but by quasi-cleavage, intergranular fracture, or both (Ref 61). Coarse radial
marks on steel specimens are due to shear, and longitudinally oriented splits can be observed along the ridges or peaks.
Radial marks on tensile fractures are usually straight, but a special form of tensile fracture exhibiting coarse curved radial
marks (the star or rosette pattern) can also occur, as discussed below. If the origin of the tensile fracture is off axis and if the
fibrous zone is very small or absent, some curvature of the radial marks will be observed.
The appearance of the radial marks is partly the result of the ductility of the material. When tensile ductility is low, radial
marks are fine with little relief. If a material is quite brittle with a coarse grain size, the amount of tensile ductility is
extremely low, and the crack path will follow the planes of weakness in directions associated with each grain. Thus,
cracking will be by cleavage, will be intergranular, or a combination of these. Figure 25 illustrates such a fracture in a cast
iron tensile bar.
Fig. 25 Macrograph showing a granular brittle fracture in a cast iron tensile bar.
Note the large cleavage facets. 2
×
The outer shear-lip zone is a smooth, annular area adjacent to the free surface of the specimen. The size of the shear-lip zone
depends on the stress state and the properties of the material tested. Changing the diameter of the test specimen will change
the stress state and alter the nature of the shear lip. In many cases, the shear-lip width will be the same, but the percentage of
the fracture it covers will change. However, exceptions to this have been noted (Ref 63).
An example of the influence of changes in the section size, the presence of notches, and the manner of loading on the
appearance of fractures of round tensile specimens is provided by tests of 25-mm (1-in.) diam, 114-mm (4
1
2
in.) long
ASTM A490 high-strength bolts (Fig. 26 and 27). Bolt 1 was a full-size bolt with a portion of the shank turned to a diameter
just smaller than the thread root diameter. Bolt 4 had a major portion of the shank turned down to a diameter of 9 mm (0.357
in.). Bolt 6 had a major portion of the shank turned down to 13 mm (0.505 in.) in diameter and was then notched (60°) to 9
mm (0.357 in.) in diameter in the center of the turned section. Bolt 7 was a full-size bolt tested with a 10° wedge under the
head. Bolts 1, 4, and 6 were axially loaded. Figure 26 shows side views of the four bolts after testing, and Fig. 27 shows their
fracture surfaces. The fractures for bolts 1 and 4 exhibit the rosette star-type pattern, which is more fully developed in bolt 1.
Bolt 6, which is notched, exhibits a flat brittle fracture with a small split; bolt 7 has a slanted brittle fracture and a large split.
Fig. 26 Side views of four types of ASTM A490 high-strength steel bolt tensile specimens.
See also Fig. 27. Left to
right: bolts 1, 4, 6, and 7
Fig. 27 Macrographs of fracture surfaces of ASTM A490 high-
strength bolt tensile specimens shown in Fig. 26. Top
left to right: bolts 1 and 4; bottom left to right: bolts 6 and 7
The presence of voids, such as microshrinkage cavities, can alter the fracture appearance. Figure 28 shows a tensile fracture
from a carbon steel casting with a slant fracture due to the voids present.
Fig. 28
Three views of an unusual tensile fracture from a carbon steel casting. (a) Macrograph of the fracture
surface. (b) SEM view of voids on the fracture surface. (c)
Light micrograph showing shrinkage cavities. (c) Etched
with 2% nital
Because the shape and size of the tensile specimen influence the stress state, fracture zones will be different for square or
rectangular sections compared to those with the round cross sections discussed previously. For an unnotched, rectangular
test specimen, for example, the fibrous zone may be elliptical in shape, with the major axis parallel to the longer side of the
rectangle. Figure 29 shows a schematic of such a test specimen, as well as two actual fracture faces. The radial zone of the
test fracture is substantially altered by the shape of the specimen, particularly for the example in Fig. 29(c). As shown by the
schematic illustrations in Fig. 30, as the section thickness decreases, the radial zone is suppressed in favor of a larger
shear-lip zone (Ref 72). For very thin specimens (plane-stress conditions), there is no radial zone.
Fig. 29 Appearance of fracture surfaces in rectangular steel tensile specimens. (a) Schematic of
tensile fracture
features in a rectangular specimen. (b) Light fractograph with fracture features conforming to those of the
schematic. (c) Light fractograph of a fracture similar to (b) but having a much narrower shear-lip zone.
Source: Ref
63
Fig. 30
Effect of section thickness on the fracture surface markings of rectangular tensile specimens. Schematics
show the change in size of the radial zone of specimens of progressively decreasing section thickness. The thinnest
of the three examples has a small fibrous zone surrounding the origin and a shear-
lip zone, but no radial zone.
Source: Ref 63
Tensile fractures of specimens machined with a transverse or short-transverse orientation from materials containing aligned
second-phase constituents for example, sulfide inclusions, slag stringers (wrought iron), or segregation often exhibit a
woody fracture appearance (Ref 13). In such fractures, the aligned second phase controls fracture initiation and propagation,
and ductility is usually low or nonexistent.
Another unique macroscopic tensile fracture appearance is the star or rosette fracture, which exhibits a central fibrous zone,
an intermediate region of radial shear, and an outer circumferential shear-lip zone (Ref 64, 65, 66, 67, 68, 69, 70, 71). The
nature and size of these zones can be altered by heat treatment, tensile size, and test temperature. Figure 27 shows two
examples of this type of tensile fracture.
Rosette star-type tensile fractures are observed only in tensile bars taken parallel to the hot-working direction of round bar
stock (Ref 65). The radial zone is the zone most characteristic of such fractures, and it exhibits longitudinally oriented
cracks. The surfaces of these cracks exhibit quasi-cleavage, which is formed before final rupture. Rosette, fractures have
frequently been observed in temper-embrittled steels (Ref 64), but are also seen in nonembrittled steels.
Certain tensile strength ranges appear to favor rosette, fracture formation in specimens machined from round bars. To
illustrate this effect, Fig. 31 shows tensile fractures and test data for seven tensile specimens of heat-treated AISI 4142 alloy
steel machined from a 28.6-mm (1
1
8
-in.) diam bar. Specimens 1 and 2 were oil quenched and tempered at 205 and 315 °C
(400 and 600 °F) and exhibit classic cup-and-cone fractures. Specimens 3 to 7, which were tempered at 455, 510, 565, and
675 °C (850, 950, 1050, and 1250 °F), respectively, all exhibit rosette star-type tensile fractures; specimens 4 and 7 exhibit
the best examples of such fractures. Specimens 3 to 7 exhibit longitudinal splitting. Shear lips are well developed on
specimen 3, but are poorly developed on specimens 4 and 7 and are essentially absent on specimens 5 and 6. The testing
temperature can also influence formation of the rosette star-type fracture. The texture produced when round bars are hot
rolled appears to be an important criterion for the formation of such fractures (Ref 65).
Tempe
r
Tensile
strengt
h
0.2%
yield
strength
Specim
en
°
C
°F M
Pa
k
si
M
Pa
ks
i
Elongation,
%
%R
A
1 2
0
5
40
0
19
70
2
8
5
169
0
24
5
10
39
2 3
1
5
60
0
17
30
2
5
1
155
0
22
5
10
43
3 4
5
5
85
0
14
10
2
0
4
131
0
19
0
12.5
47
4 5
1
0
95
0
12
50
1
8
1
117
0
16
9
15
54
5 5
6
5
10
50
11
30
1
6
4
103
0
15
0
16
58
6 6
2
0
11
50
94
5
1
3
7
850
12
3
20
63
7 6
7
5
12
50
77
0
1
1
2
670
97
24.5 66
Fig. 31 Macrographs of quenched-and-
tempered AISI 4142 steel tensile specimens showing splitting parallel to the
hot-working axis in specimens tempered at 455 °C (850 °F) or higher
Splitting also has been observed in ordinary cup-and-cone tensile fractures of specimens machined from plates (Ref 72). As
with the rosette star-type tensile fracture, cup-and-cone fractures have been observed in quenched-and-tempered (205 to
650 °C, or 400 to 1200 °F) alloy steels. One study showed that the occurrence of splitting and the tensile fracture appearance
varied with test temperature (Ref 72). Tests at 65 °C (150 °F) produced the cup-and-cone fracture, but lower test
temperatures resulted in one or more longitudinally oriented splits. The splits were perpendicular to the plate surface and ran
in the hot-working direction. The crack surfaces exhibited quasi-cleavage. When the same material was rolled to produce
round bars, the tensile fracture exhibited rosette star-type fractures. Therefore, the split, layered cup-and-cone, fracture was
concluded to be a two-dimensional (plate) analog of the rosette, star fracture observed in heat-treated tensiles from round
bars.
Splitting of fracture surfaces of both tensile specimens and Charpy V-notch impact specimens has been frequently observed
in specimens machined from controlled-rolled plate (Ref 73, 74, 75, 76, 77, 78, 79, 80, 81, 82, 83, 84, 85) and line pipe
steels (Ref 86, 87, 88, 89, 90). The splits, which are also referred to as delaminations, are fissures that propagate in the
hot-rolling direction.
Various factors have been suggested as causes for these delaminations (Ref 82):
• Elongated ferrite grains produced by low finishing temperatures that promote grain-
boundary decohesion
• Residual stress concentration
• Grain-boundary segregation
• Grain-boundary carbides
• Ferrite/pearlite banding
• Nonmetallic inclusions
• Cleavage on <100> planes
• Mechanical fibering
• Duplex ferrite grain size
• Increased amounts of deformed ferrite
• Prior-austenite grain boundaries
In a study of a relatively pure Fe-1Mn alloy that was essentially free of carbides and inclusions, delaminations were
observed along grain boundaries; splitting occurred when the ferrite grains were deformed beyond a certain degree by
controlled rolling (Ref 83). Examples of splitting in 12.7-mm
2
(0.02-in.
2
) tensile specimens from this study are shown in
Fig. 32, which illustrates splitting on longitudinal and transverse tensile specimens where the hot-rolling finishing
temperatures were 315 and 150 °C (600 and 300 °F). Splitting was observed in transverse and longitudinal specimens when
the plates were finish rolled at 480 °C (895 °F) and below and at 370 °C (700 °F) and below, respectively. The splits were in
the hot-rolling direction, and the frequency of splitting increased as the finishing temperature was lowered below the
temperatures mentioned previously.
Fig. 32 Macrographs of fractured longitudinal and transverse tensile specimens from plates finish-
rolled at two
temperatures. (a) Longitudinal specimen finished at 315 °C (600 °F). (b) Transverse specimen finished at the same
temperature. (c) Longitudinal specimen finished at 150 °C (300 °F)
. (d) Transverse specimen finished at the same
temperature. Source: Ref 83
This study revealed that splitting followed the ferrite grain boundaries (Ref 83). The aspect ratio of the deformed ferrite
grains was found to be related to the occurrence of splitting. Material that was susceptible to splitting continued to exhibit
splitting after annealing until the ferrite grains were almost completely recrystallized.
As a final note on tensile fractures, numerous studies have used metallographic cross sections to assess the influence of
second-phase constituents on fracture initiation and tensile properties. Many studies have shown void formation at the
interface between hard constituents (carbides, intermetallics, and inclusions) and the matrix (Ref 20, 91, 92, 93, 94, 95);
other studies have demonstrated quantitative relationships between inclusion parameters and tensile ductility (Ref 51, 96,
97, 98, 99, 100 101, 102). The use of light microscopy has been of great importance in such studies.
Brittle Fractures
Brittle fractures can occur in body-centered cubic (bcc) and hexagonal close-packed (hcp) metals but not in fcc metals
(except in certain specific cases). Brittle fractures are promoted by low service temperatures, high strain rates, the presence
of stress concentrators, and certain environmental conditions. The ductile-to-brittle transition over a range of temperatures
is a well-known characteristic behavior of steels and is influenced by such factors as strain rate, stress state, composition,
microstructure, grain size, and specimen size. Macroscopic examination and light microscopy, as well as electron
metallographic procedures, have played an important role in gaining an understanding of brittle fracture, and these analysis
techniques are basic failure analysis tools.
Most metals, except fcc metals, exhibit a temperature-dependent brittleness behavior that has been studied by using a wide
variety of impact-type tests. The Charpy V-notch impact test has had the greatest overall usage, and macroscopic
examination of the fracture surfaces is used to assess the percentages of ductile and brittle fracture on the specimens as a
function of test temperature. Figure 33 shows fractures of six Charpy V-notch impact specimens of a low-carbon steel tested
between -18 and 95 °C (0 and 200 °F), along with the test data (absorbed energy, lateral expansion, and percent ductile, or
fibrous, fracture). Figure 33 also shows SEM views of the fractures resulting from testing at -18 and 95 °C (0 and 200 °F)
that illustrate cleavage and microvoid coalescence, respectively.
Fig. 33 SEM fractographs of ductile (D) and brittle (B) fractures in Charpy V-
notch impact specimens shown at top.
Both 400×
Another example of the macroscopic appearance of Charpy V-notch impact specimens is given in Fig. 34, which shows four
specimens of heat-treated AISI 4340 tested between -196 and 40 °C (-321 and 104 °F), as well as plots of the test data (Ref
63). The test specimen at -80 °C (-112 °F), which is near the ductile-to-brittle transition temperature, shows a well-defined
ductile zone surrounding an inner brittle zone. Such clear delineation between the ductile and brittle zones is not always
obtained, as was the case with the samples shown in Fig. 33.
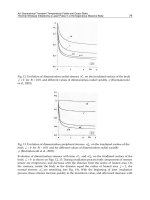
Fig. 34 Transition curves for fracture
appearance and impact energy versus test temperature for specimens of
4340 steel. Light fractographs at top show impact specimens tested at various temperatures. Linear measurements
were made parallel to the notch for the shear-lip zones, perpendicular to
the notch for the fibrous zone, and
perpendicular to the notch for the radial zone. The measurements yielded the three curves shown in (a). The curve
of percentage of fibrousness of fracture (b) was constructed from visual estimates of the fibrous-plus-shear-
lip
zones. This curve, together with the impact energy curve shown in (b), shows that the transition temperature for
fracture appearance is essentially the same as for impact energy. Source: Ref 63
Splitting has been observed in Charpy V-notch specimens, as well as on tensile specimens, as discussed previously. One
investigation (Ref 83) has shown that the orientation of the splits is always parallel to the rolling plane of plate in the
longitudinal direction (Fig. 35). Therefore, splitting is always associated with planes of weakness in the rolling direction.
Fig. 35 Macrograph illustrating the influence of specimen orientation (with respect to the hot-
working direction) on
splitting observed in Charpy V-notch impact specimens. A, notch parallel to
the plate surface; B, notch
perpendicular to the plate surface; C, notch 45° to the plate surface. Source: Ref 83
Figure 36 shows Charpy V-notch absorbed-energy curves for Fe-1Mn steel that was finish rolled at temperatures for 960 to
316 °C (1760 to 600 °F) from the study discussed in Ref 83. As the finishing temperature decreased, the absorbed-energy
transition temperature (temperature for a certain level of absorbed energy, for example, 20 or 34 J, or 15 or 25 ft · lb)
decreased, but the upper shelf energy also decreased. Figure 37 shows the fracture appearance of Charpy V-notch
specimens used to produce the curves in Fig. 36. This demonstrates that the occurrence of splitting increased as the finishing
temperature decreased. In general, lowering the test temperature for a given finishing temperature increased the number of
splits unless the test temperature was low enough to produce a completely brittle cleavage fracture, for example, the -73- °C
(-100- °F) samples of the plates finish rolled at 707 and 538 °C (1305 and 1000 °F).