Applications of the DFT
Bạn đang xem bản rút gọn của tài liệu. Xem và tải ngay bản đầy đủ của tài liệu tại đây (423.47 KB, 16 trang )
169
CHAPTER
9
Applications of the DFT
The Discrete Fourier Transform (DFT) is one of the most important tools in Digital Signal
Processing. This chapter discusses three common ways it is used. First, the DFT can calculate
a signal's frequency spectrum. This is a direct examination of information encoded in the
frequency, phase, and amplitude of the component sinusoids. For example, human speech and
hearing use signals with this type of encoding. Second, the DFT can find a system's frequency
response from the system's impulse response, and vice versa. This allows systems to be analyzed
in the frequency domain, just as convolution allows systems to be analyzed in the time domain.
Third, the DFT can be used as an intermediate step in more elaborate signal processing
techniques. The classic example of this is FFT convolution, an algorithm for convolving signals
that is hundreds of times faster than conventional methods.
Spectral Analysis of Signals
It is very common for information to be encoded in the sinusoids that form
a signal. This is true of naturally occurring signals, as well as those that
have been created by humans. Many things oscillate in our universe. For
example, speech is a result of vibration of the human vocal cords; stars
and planets change their brightness as they rotate on their axes and revolve
around each other; ship's propellers generate periodic displacement of the
water, and so on. The shape of the time domain waveform is not important
in these signals; the key information is in the frequency, phase and
amplitude of the component sinusoids. The DFT is used to extract this
information.
An example will show how this works. Suppose we want to investigate the
sounds that travel through the ocean. To begin, a microphone is placed in the
water and the resulting electronic signal amplified to a reasonable level, say a
few volts. An analog low-pass filter is then used to remove all frequencies
above 80 hertz, so that the signal can be digitized at 160 samples per second.
After acquiring and storing several thousand samples, what next?
The Scientist and Engineer's Guide to Digital Signal Processing170
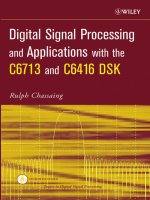
The first thing is to simply look at the data. Figure 9-1a shows 256 samples
from our imaginary experiment. All that can be seen is a noisy waveform that
conveys little information to the human eye. For reasons explained shortly, the
next step is to multiply this signal by a smooth curve called a Hamming
window, shown in (b). (Chapter 16 provides the equations for the Hamming
and other windows; see Eqs. 16-1 and 16-2, and Fig. 16-2a). This results in
a 256 point signal where the samples near the ends have been reduced in
amplitude, as shown in (c).
Taking the DFT, and converting to polar notation, results in the 129 point
frequency spectrum in (d). Unfortunately, this also looks like a noisy mess.
This is because there is not enough information in the original 256 points to
obtain a well behaved curve. Using a longer DFT does nothing to help this
problem. For example, if a 2048 point DFT is used, the frequency spectrum
becomes 1025 samples long. Even though the original 2048 points contain
more information, the greater number of samples in the spectrum dilutes the
information by the same factor. Longer DFTs provide better frequency
resolution, but the same noise level.
The answer is to use more of the original signal in a way that doesn't
increase the number of points in the frequency spectrum. This can be done
by breaking the input signal into many 256 point segments. Each of these
segments is multiplied by the Hamming window, run through a 256 point
DFT, and converted to polar notation. The resulting frequency spectra are
then averaged to form a single 129 point frequency spectrum. Figure (e)
shows an example of averaging 100 of the frequency spectra typified by (d).
The improvement is obvious; the noise has been reduced to a level that
allows interesting features of the signal to be observed. Only the
magnitude of the frequency domain is averaged in this manner; the phase
is usually discarded because it doesn't contain useful information. The
random noise reduces in proportion to the square-root of the number of
segments. While 100 segments is typical, some applications might average
millions of segments to bring out weak features.
There is also a second method for reducing spectral noise. Start by taking a
very long DFT, say 16,384 points. The resulting frequency spectrum is high
resolution (8193 samples), but very noisy. A low-pass digital filter is then
used to smooth the spectrum, reducing the noise at the expense of the
resolution. For example, the simplest digital filter might average 64 adjacent
samples in the original spectrum to produce each sample in the filtered
spectrum. Going through the calculations, this provides about the same noise
and resolution as the first method, where the 16,384 points would be broken
into 64 segments of 256 points each.
Which method should you use? The first method is easier, because the
digital filter isn't needed. The second method has the potential of better
performance, because the digital filter can be tailored to optimize the trade-
off between noise and resolution. However, this improved performance is
seldom worth the trouble. This is because both noise and resolution can
be improved by using more data from the input signal. For example,
Chapter 9- Applications of the DFT 171
Sample number
0 32 64 96 128 160 192 224 256
-0.5
0.0
0.5
1.0
1.5
255
b. Hamming window
Sample number
0 32 64 96 128 160 192 224 256
-1.0
-0.5
0.0
0.5
1.0
255
c. Windowed signal
Frequency
0 0.1 0.2 0.3 0.4 0.5
0
1
2
3
4
5
6
7
8
9
10
d. Single spectrum
Frequency
0 0.1 0.2 0.3 0.4 0.5
0
1
2
3
4
5
6
7
8
9
10
e. Averaged spectrum
FIGURE 9-1
An example of spectral analysis. Figure (a) shows
256 samples taken from a (simulated) undersea
microphone at a rate of 160 samples per second.
This signal is multiplied by the Hamming window
shown in (b), resulting in the windowed signal in
(c). The frequency spectrum of the windowed
signal is found using the DFT, and is displayed in
(d) (magnitude only). Averaging 100 of these
spectra reduces the random noise, resulting in the
averaged frequency spectrum shown in (e).
Sample number
0 32 64 96 128 160 192 224 256
-1.0
-0.5
0.0
0.5
1.0
255
a. Measured signal
DFT
Amplitude
Amplitude
AmplitudeAmplitude
Amplitude
Time Domain Frequency Domain
The Scientist and Engineer's Guide to Digital Signal Processing172
imagine breaking the acquired data into 10,000 segments of 16,384 samples
each. This resulting frequency spectrum is high resolution (8193 points) and
low noise (10,000 averages). Problem solved! For this reason, we will only
look at the averaged segment method in this discussion.
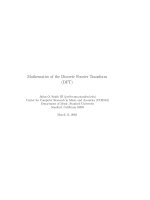
Figure 9-2 shows an example spectrum from our undersea microphone,
illustrating the features that commonly appear in the frequency spectra of
acquired signals. Ignore the sharp peaks for a moment. Between 10 and 70
hertz, the signal consists of a relatively flat region. This is called white noise
because it contains an equal amount of all frequencies, the same as white light.
It results from the noise on the time domain waveform being uncorrelated from
sample-to-sample. That is, knowing the noise value present on any one sample
provides no information on the noise value present on any other sample. For
example, the random motion of electrons in electronic circuits produces white
noise. As a more familiar example, the sound of the water spray hitting the
shower floor is white noise. The white noise shown in Fig. 9-2 could be
originating from any of several sources, including the analog electronics, or the
ocean itself.
Above 70 hertz, the white noise rapidly decreases in amplitude. This is a result
of the roll-off of the antialias filter. An ideal filter would pass all frequencies
below 80 hertz, and block all frequencies above. In practice, a perfectly sharp
cutoff isn't possible, and you should expect to see this gradual drop. If you
don't, suspect that an aliasing problem is present.
Below about 10 hertz, the noise rapidly increases due to a curiosity called 1/f
noise (one-over-f noise). 1/f noise is a mystery. It has been measured in very
diverse systems, such as traffic density on freeways and electronic noise in
transistors. It probably could be measured in all systems, if you look low
enough in frequency. In spite of its wide occurrence, a general theory and
understanding of 1/f noise has eluded researchers. The cause of this noise can
be identified in some specific systems; however, this doesn't answer the
question of why 1/f noise is everywhere. For common analog electronics and
most physical systems, the transition between white noise and 1/f noise occurs
between about 1 and 100 hertz.
Now we come to the sharp peaks in Fig. 9-2. The easiest to explain is at 60
hertz, a result of electromagnetic interference from commercial electrical
power. Also expect to see smaller peaks at multiples of this frequency (120,
180, 240 hertz, etc.) since the power line waveform is not a perfect sinusoid.
It is also common to find interfering peaks between 25-40 kHz, a favorite for
designers of switching power supplies. Nearby radio and television stations
produce interfering peaks in the megahertz range. Low frequency peaks can be
caused by components in the system vibrating when shaken. This is called
microphonics, and typically creates peaks at 10 to 100 hertz.
Now we come to the actual signals. There is a strong peak at 13 hertz, with
weaker peaks at 26 and 39 hertz. As discussed in the next chapter, this is the
frequency spectrum of a nonsinusoidal periodic waveform. The peak at 13
hertz is called the fundamental frequency, while the peaks at 26 and 39
Chapter 9- Applications of the DFT 173
Frequency (hertz)
0 10 20 30 40 50 60 70 80
0
1
2
3
4
5
6
7
8
9
10
1/f noise
13 Hz.
26 Hz.
39 Hz.
60 Hz.
white noise
antialias filter roll-off
FIGURE 9-2
Example frequency spectrum. Three types of
features appear in the spectra of acquired
signals: (1) random noise, such as white noise
and 1/f noise, (2) interfering signals from power
lines, switching power supplies, radio and TV
stations, microphonics, etc., and (3) real signals,
usually appearing as a fundamental plus
harmonics. This example spectrum (magnitude
only) shows several of these features.
Amplitude
Frequency
0 0.1 0.2 0.3 0.4 0.5
0
20
40
60
80
100
a. N = 128
Frequency
0 0.1 0.2 0.3 0.4 0.5
0
80
160
240
320
b. N = 512
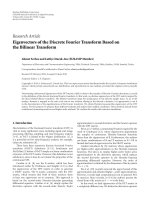
FIGURE 9-3
Frequency spectrum resolution. The longer the DFT, the better the ability to separate closely spaced features. In
these example magnitudes, a 128 point DFT cannot resolve the two peaks, while a 512 point DFT can.
Amplitude
Amplitude
hertz are referred to as the second and third harmonic respectively. You
would also expect to find peaks at other multiples of 13 hertz, such as 52,
65, 78 hertz, etc. You don't see these in Fig. 9-2 because they are buried
in the white noise. This 13 hertz signal might be generated, for example,
by a submarines's three bladed propeller turning at 4.33 revolutions per
second. This is the basis of passive sonar, identifying undersea sounds by
their frequency and harmonic content.
Suppose there are peaks very close together, such as shown in Fig. 9-3. There
are two factors that limit the frequency resolution that can be obtained, that is,
how close the peaks can be without merging into a single entity. The first
factor is the length of the DFT. The frequency spectrum produced by an N
point DFT consists of samples equally spaced between zero and one-N/2 %1
half of the sampling frequency. To separate two closely spaced frequencies,
the sample spacing must be smaller than the distance between the two peaks.
For example, a 512 point DFT is sufficient to separate the peaks in Fig. 9-3,
while a 128 point DFT is not.
The Scientist and Engineer's Guide to Digital Signal Processing174
Frequency
0 0.1 0.2 0.3 0.4 0.5
0
40
80
120
160
200
a. No window
on basis
function
between
basis functions
tails
Frequency
0 0.1 0.2 0.3 0.4 0.5
0
20
40
60
80
100
on basis
function
between
basis functions
b. With Hamming window
Amplitude
Amplitude
FIGURE 9-4
Example of using a window in spectral analysis. Figure (a) shows the frequency spectrum (magnitude only) of a signal
consisting of two sine waves. One sine wave has a frequency exactly equal to a basis function, allowing it to be
represented by a single sample. The other sine wave has a frequency between two of the basis functions, resulting in
tails on the peak. Figure (b) shows the frequency spectrum of the same signal, but with a Hamming window applied
before taking the DFT. The window makes the peaks look the same and reduces the tails, but broadens the peaks.
The second factor limiting resolution is more subtle. Imagine a signal
created by adding two sine waves with only a slight difference in their
frequencies. Over a short segment of this signal, say a few periods, the
waveform will look like a single sine wave. The closer the frequencies, the
longer the segment must be to conclude that more than one frequency is
present. In other words, the length of the signal limits the frequency
resolution. This is distinct from the first factor, because the length of the
input signal does not have to be the same as the length of the DFT. For
example, a 256 point signal could be padded with zeros to make it 2048
points long. Taking a 2048 point DFT produces a frequency spectrum with
1025 samples. The added zeros don't change the shape of the spectrum,
they only provide more samples in the frequency domain. In spite of this
very close sampling, the ability to separate closely spaced peaks would be
only slightly better than using a 256 point DFT. When the DFT is the same
length as the input signal, the resolution is limited about equally by these
two factors. We will come back to this issue shortly.
Next question: What happens if the input signal contains a sinusoid with a
frequency between two of the basis functions? Figure 9-4a shows the answer.
This is the frequency spectrum of a signal composed of two sine waves, one
having a frequency matching a basis function, and the other with a frequency
between two of the basis functions. As you should expect, the first sine wave
is represented as a single point. The other peak is more difficult to understand.
Since it cannot be represented by a single sample, it becomes a peak with tails
that extend a significant distance away.
The solution? Multiply the signal by a Hamming window before taking the
DFT, as was previously discussed. Figure (b) shows that the spectrum is
changed in three ways by using the window. First, the two peaks are made
to look more alike. This is good. Second, the tails are greatly reduced.