Volume 01 - Properties and Selection Irons, Steels, and High-Performance Alloys Part 3 pot
Bạn đang xem bản rút gọn của tài liệu. Xem và tải ngay bản đầy đủ của tài liệu tại đây (1.11 MB, 160 trang )
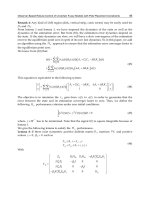
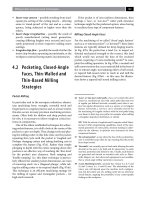
Fig. 20
Transmission electron micrograph showing the microstructure of 4130 steel water quenched from 900
°C (1650 °F) and tempered at 650 °C (1200 °F) Courtesy of F. Woldow
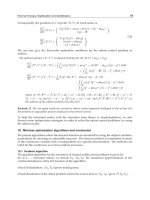
Figure 21 shows the range of hardness levels which may be obtained by tempering at various temperatures as a function
of the carbon content of the steel. The highest hardnesses for engineering applications are associated with the transition
carbide microstructures produced by tempering at 150 °C (300 °F). These microstructures have excellent fatigue and wear
resistance and are used for such applications as shafts, gears, and bearings. The lowest hardnesses are associated with
microstructures of spheroidized carbides in a matrix of equiaxed ferrite. Steels with these microstructures are used when
very high toughness or corrosion resistance (for example, resistance to H
2
S in oil field applications) is required.
Fig. 21 Hardness as a function of carbon content in iron-
carbon alloys quenched to martensite and tempered at
various temperatures. Source: Ref 31
Toughness, or fracture resistance, generally increases with tempering temperature, but various types of enbrittlement or
reduced toughness can develop (Ref 2). Figure 22 shows impact toughness as a function of tempering temperature for
selected sets of steels with high and low levels of phosphorus. Carbon content has a major influence on toughness.
Medium-carbon tempered steels are quite tough, but high-carbon steels show very low impact toughness, which limits the
application of hardened and tempered high-carbon steels to conditions of compressive loading without impact, such as in
bearings. The effect of carbon on the toughness of low-temperature tempered specimens correlates with increasing
densities of transition carbides and associated high strain hardening rates as carbon content increasing (Ref 2).
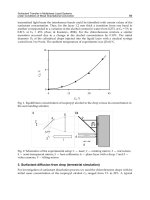
Fig. 22 Charpy V-
notch impact toughness as a function of tempering temperature for various alloy steels. High
phosphorus levels are about 0.02% and low phosphorus levels range between 0.002 and 0.009%. Source:
Ref
32, 33
Toughness reaches its peak in specimens tempered at 200 °C (390 °F); it drops to a minimum in specimens tempered
around 300 °C (570 °F). This drop is referred to as tempered martensite embrittlement and is associated with the
transformation of retained austenite to coarse carbide structures. Tempered martensite embrittlement is exacerbated by
phosphorus segregation to prior-austenite grain boundaries and carbide interfaces, but this effect appears to be constant
over the entire tempering range (Fig. 22). At higher tempering temperatures, between 350 and 550 °C (660 and 1020 °F),
another embrittlement phenomenon may develop in steels containing phosphorus, antimony, or tin (Ref 34). This
embrittlement is referred to as temper embrittlement, and requires long holding times or slow cooling through the
embrittling temperature range. Alloy steels are most susceptible, and the cosegregation of the alloying elements with the
impurities to prior austenite grain boundaries has been documented (Ref 35).
References cited in this section
2. G. Krauss, Steels: Heat Treatment and Processing Principles, ASM INTERNATIONAL, 1989
28.
G. Krauss, Tempering and Structural Change in Ferrous Martensites, in
Phase Transformations in Ferrous
Alloys, A.R. Marder and J.I. Goldstein, Ed., The Metallurgical Society, 1984
29.
D.L. Williamson, K. Nakazawa, and G. Krauss, A Study of the Early Stages of Tempering in an Fe-
1.22 pct
C Alloy, Metall. Trans. A, Vol 10A, 1979, p 1351-1363
30.
Y. Hirotsu and S. Nagakura, Crysta
l Structure and Morphology of the Carbide Precipitated in Martensitic
High Carbon Steel During the First Stage of Tempering, Acta Metall., Vol 20, 1972, p 645-655
31.
R.A. Grange, C.R. Hibral, and L.F. Porter, Hardness of Tempered Martensite in Carbon and
Low Alloy
Steels, Metall. Trans. A, Vol 8A, 1977, p 1775-1785
32.
D.L. Yaney, "The Effects of Phosphorus and Tempering on the Fracture of AISI 52100 Steel," M.S. thesis,
Colorado School of Mines, 1981
33.
F. Zia-Ebrahimi and G. Krauss, Mechanisms of Tempered Martensite Embrittlement in Medium-
Carbon
Steels, Acta Metall ., Vol 32, 1984, p 1767-1777
34.
C.J. McMahon, Jr., Temper Brittleness: An Interpretive Review, in Temper Embrittlement in Steel,
STP
407, American Society for Testing and Materials, 1968, p 127-167
35.
M. Guttman, P. Dumonlin, and M. Wayman, The Thermodynamics of Interactive Co-
Segregation of
Phosphorus and Alloying Elements in Iron and Temper-Brittle Steels, Metall. Trans. A,
Vol 13A, 1982, p
1693-1711
Processing: Quenched and Tempered Microstructures
Hardened steels with tempered martensitic microstructures are most frequently used in machine components that require
high strength and excellent fatigue resistance under conditions of cyclic loading. Figure 23 shows a typical processing
sequence for these components. Hot-rolled bars are received and forged, generally at high temperatures where
deformation into complex shapes is readily accomplished. The forgings are air cooled, and ferrite-pearlite microstructures
develop upon cooling to room temperature. A normalizing treatment to refine the coarse microstructures that originated
because of high-temperature forging may be required, or a spheroidizing treatment to produce a microstructure of ferrite
and spheroidized cementite may be applied if extensive machining prior to hardening is required. The forgings are then
austenitized, quenched to martensite, and tempered to the properties described in the preceding section. Straightening and
stress relieving operations may be applied if required.
Fig. 23 Temperature-
time processing schedules for producing quench and tempered
forgings
Processing: Direct-Cooled Forging Microstructures
To reduce the number of processing steps associated with producing quenched and tempered microstructures, new
alloying approaches have been developed to produce high-strength microstructures directly during cooling after forging.
Figure 24 shows a schematic of such a processing approach and an alternate processing sequence that cold finishes hot-
rolled bars. Eliminating heat treatment processing steps by direct cooling relative to quenching and tempering has obvious
advantages.
Fig. 24 Temperature-time schedule for producing direct-cooled forgings and cold-finished bars
One group of steels that has been developed for direct cooling is microalloyed medium-carbon steels (see Ref 36, 37 and
the article "High-Strength Low-Alloy Steel Forgings" in this Volume). These steels contain small amounts of vanadium
and niobium and transform to precipitation-hardened microstructures of ferrite and pearlite. The hardness produced by
rapid air cooling ranges from 25 to 30 HRC depending on the extent of precipitation and pearlite in the microstructure;
ultimate strength values are over 690 MPa (100 ksi). Thus, the hardness and strength levels are not as high as can be
produced by quenching and low-temperature tempering, but they are more than adequate for many automotive
applications that require intermediate strengths (Ref 36).
The fatigue resistance of direct-cooled microalloyed steels is comparable to that of quenched and tempered steels of the
same hardness, but the impact toughness is much lower. This reduced toughness is due to the well-known increase in the
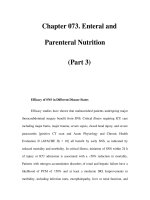
ductile-to-brittle temperature in steels with ferrite-pearlite microstructures as pearlite content increases (Fig. 25). In order
to improve the toughness of direct-cooled forging steels, steels that transform to bainitic structures and forging steels with
lower carbon concentrations and finer ferrite-pearlite microstructures are being developed (Ref 38).
Fig. 25 Impact transition curves as a function of carbon content in normalized steels. Increase in ductile-to-
brittle transition temperatures with increasing carbon content is due to increasing amounts of pearlite.
Source:
Ref 1
References cited in this section
1. G. Krauss, Physical Metallurgy and Heat Treatment of Steel, in Metals Handbook Desk Edition,
H.E. Boyer
and T.L Gall, Ed., American Society for Metals, 1985, p 28-2 to 28-10
36.
Fundamentals of Microalloying Forging Steels,
G. Krauss and S.K. Banerji, Ed., The Metallurgical Society,
1987
37.
G. Krauss, Microalloyed Bar and Forging Steels, in 29th Mechanical
Working and Steel Processing
Conference Proceedings , Vol XXV, Iron and Steel Society, 1988, p 67-77
38.
K. Grassl, S.W. Thompson, and G. Krauss, "New Options for Steel Selection for Automotive Applications,"
SAE Technical Paper 890508, Society of Automotive Engineers, 1989
Summary
This article has briefly described the major microstructures and the phase transformations by which these microstructures
are developed in carbon and low-alloy steels. Each type of microstructure and product is developed to characteristic
property ranges by specific processing routes that control and exploit microstructural changes. The incorporation of steel
carbon content into microstructure has a profound effect on microstructure and properties, and steels fall naturally into
low-strength/high ductility/high toughness or high-strength/high fatigue resistant/low toughness groups with increasing
carbon content. The use of new casting techniques, microalloying, and thermomechanical processing are being used
increasingly to reduce processing steps and to improve steel product microstructures and quality.
References
1. G. Krauss, Physical Metallurgy and Heat Treatment of Steel, in Metals Handbook Desk Edition,
H.E.
Boyer and T.L Gall, Ed., American Society for Metals, 1985, p 28-2 to 28-10
2. G. Krauss, Steels: Heat Treatment and Processing Principles, ASM INTERNATIONAL, 1989
3.
J.S. Kirkaldy, B.A. Thompson, and E.A. Baganis, Prediction of Multicomponent Equilibrium and
Transformation Diagrams for Low Alloy Steels, in Hardenability Concepts with Applications to Steel ,
D.V. Doane and J.S. Kirkaldy, Ed., The Metallurgical Society, 1978
4. Heat Treaters Guide,
P.M. Unterweiser, H.E. Boyer, and J.J. Kubbs, Ed., American Society for Metals,
1982
5. M. Hillert, The Formation of Pearlite, in Decomposition of Austenite by Diffusional Processes,
V.F.
Zackay and H.I. Aaronson, Ed., Interscience, 1962, p 197-247
6. W.A. Johnson and R.F. Mehl, Reaction Kinetics in Processes of Nucleation and Growth, Trans. AIME,
Vol 135, 1939, p 416-458
7. J.W. Christian and D.V. Edmonds, The Bainite Transformation, in
Phase Transformations and Ferrous
Alloys, A.R. Marder and J.I. Goldstein, Ed., The Metallurgical Society, 1984, p 293-325
8. R.F. Hehemann, Ferrous and Nonferrous Bainite Structures, in Metals Handbook,
8th ed., Vol 8, American
Society for Metals, 1973, p 194-196
9. B.L. Bramfitt and J.G. Speer, A Perspective on the Morphology of Bainite, Metall. Trans. A,
to be
published in 1990
10. A.W. Cramb, New Steel Casting Processes for Thin Slabs and Strip, Iron Steelmaker,
Vol 15 (No. 7),
1988, p 45-60
11. I. Tamura, H. Sekine, T. Tanaka, and C. Ouchi, Thermomechanical Processing of High-Strength Low-
Alloy Steels, Butterworths, 1988
12. Thermomechanical Processing of Microalloyed Austenite, A.J. De
Ardo, G.A. Ratz, and P.J. Wray, Ed.,
The Metallurgical Society, 1982
13. Microalloyed HSLA Steels: Proceedings of Microalloying '88, ASM INTERNATIONAL, 1988
14. P.R. Mould, An Overview of Continuous-Annealing Technology, in Metallurgy of Continuous-Annea
led
Sheet Steel, B.L. Bramfitt and D.L. Mangonon, Jr., Ed., The Metallurgical Society, 1982, p 3-33
15. W.C. Leslie, The Physical Metallurgy of Steels, McGraw-Hill, 1981
16. D.Z. Yang, E.L. Brown, D.K. Matlock, and G. Krauss, Ferrite Recrystallization an
d Austenite Formation
in Cold-Rolled Intercritically Annealed Steel, Metall. Trans. A, Vol 11A, 1985, p 1385-1392
17. Metallurgy of Vacuum-Degassed Steel Products,
R. Pradhan, Ed., The Metallurgical Society, to be
published in 1990
18. Structure and Properties of Dual-Phase Steels,
R.A. Kot and J.M. Morris, Ed., The Metallurgical Society,
1979
19. Fundamentals of Dual-Phase Steels, R.A. Kot and B.L. Bramfitt, Ed., The Metallurgical Society, 1981
20. D.K. Matlock, F. Zia-Ebrahimi, and G. Krauss, Structure, Properties and Strain Hardening of Dual-
Phase
Steels, in Deformation, Processing and Structure, G. Krauss, Ed., ASM INTERNATIONAL, 1984
21. B.A. Bilby and J.W. Christian, The Crystallography of Martensite Transformations, Vol 197, 1961, p 122-
131
22. M. Cohen, The Strengthening of Steel, Trans. TMS-AIME, Vol 224, 1962, p 638-657
23. D.P. Koistinen and R.E. Marburger, A General Equation Prescribing the Extent of the Austenite-
Martensite Transformation in Pure Iron-Carbon Alloys and Plain Carbon Steels, Acta Metall.,
Vol 7, 1959,
p 59-60
24. J.P. Materkowski and G. Krauss, Tempered Martensite Embrittlement in SAE 4340 Steel, Metall.
Trans.
A, Vol 10A, 1979, p 1643-1651
25. A.R. Marder, A.O. Benscoter, and G. Krauss, Microcracking Sensitivity in Fe-C Plate Martensite,
Metall.
Trans ., Vol 1, 1970, p 1545-1549
26. Hardenability Concepts with Applications to Steel,
D.V. Doane and J.S. Kirkaldy, Ed., American Institute
of Mining, Metallurgical, and Petroleum Engineers, 1978
27. C.A. Siebert, D.V. Doane, and D.H. Breen,
The Hardenability of Steels: Concepts, Metallurgical
Influences, and Industrial Applications, American Society for Metals, 1977
28. G. Krauss, Tempering and Structural Change in Ferrous Martensites, in
Phase Transformations in Ferrous
Alloys, A.R. Marder and J.I. Goldstein, Ed., The Metallurgical Society, 1984
29. D.L. Williamson, K. Nakazawa, and G. Krauss, A Study of the Early Stages of Tempering in an Fe-
1.22
pct C Alloy, Metall. Trans. A, Vol 10A, 1979, p 1351-1363
30. Y. Hirotsu and S
. Nagakura, Crystal Structure and Morphology of the Carbide Precipitated in Martensitic
High Carbon Steel During the First Stage of Tempering, Acta Metall., Vol 20, 1972, p 645-655
31. R.A. Grange, C.R. Hibral, and L.F. Porter, Hardness of Tempered Marten
site in Carbon and Low Alloy
Steels, Metall. Trans. A, Vol 8A, 1977, p 1775-1785
32.
D.L. Yaney, "The Effects of Phosphorus and Tempering on the Fracture of AISI 52100 Steel," M.S. thesis,
Colorado School of Mines, 1981
33. F. Zia-Ebrahimi and G. Krauss, Mechanisms of Tempered Martensite Embrittlement in Medium-
Carbon
Steels, Acta Metall ., Vol 32, 1984, p 1767-1777
34. C.J. McMahon, Jr., Temper Brittleness: An Interpretive Review, in Temper Embrittlement in Steel,
STP
407, American Society for Testing and Materials, 1968, p 127-167
35. M. Guttman, P. Dumonlin, and M. Wayman, The Thermodynamics of Interactive Co-
Segregation of
Phosphorus and Alloying Elements in Iron and Temper-Brittle Steels, Metall. Trans. A,
Vol 13A, 1982, p
1693-1711
36. Fundamentals of Microalloying Forging Steels,
G. Krauss and S.K. Banerji, Ed., The Metallurgical
Society, 1987
37. G. Krauss, Microalloyed Bar and Forging Steels, in
29th Mechanical Working and Steel Processing
Conference Proceedings , Vol XXV, Iron and Steel Society, 1988, p 67-77
38.
K. Grassl, S.W. Thompson, and G. Krauss, "New Options for Steel Selection for Automotive
Applications," SAE Technical Paper 890508, Society of Automotive Engineers, 1989
Introduction
STEELS constitute the most widely used category of metallic material, primarily because they can be manufactured
relatively inexpensively in large quantities to very precise specifications. They also provide a wide range of mechanical
properties, from moderate yield strength levels (200 to 300 MPa, or 30 to 40 ksi) with excellent ductility to yield strengths
exceeding 1400 MPa (200 ksi) with fracture toughness levels as high as 110 MPa
m
(100 ksi
in
).
This article will review the various systems used to classify carbon and low-alloy steels
*
, describe the effects of alloying
elements on the properties and/or characteristics of steels, and provide extensive tabular data pertaining to designations of
steels (both domestic and international). More detailed information on the steel types and product forms discussed in this
article can be found in the articles that follow in this Section.
Note
* The term low-
alloy steel rather than the more general term alloy steel is being used to differentiate the steels
covered in this article from high-alloy steels. High-
alloy steels include steels with a high degree of fracture
toughness (Fe-9Ni-4Co), which are described in the article "Ultrahigh-Strength Steels"
in this Section of the
Handbook. They also include maraging steels (Fe-18Ni-4Mo-8Co), austenitic manganese steels (Fe-1C-
12Mn), tool steels, and stainless steels, which are described in separate articles in the Section "Specialty
Steels and Heat-Resistant Alloys" in this Volume.
Classification of Steels
Steels can be classified by a variety of different systems depending on:
• The composition, such as carbon, low-alloy, or stainless steels
• The manufacturing methods, such as open hearth, basic oxygen process, or electric furnace methods
• The finishing method, such as hot rolling or cold rolling
• The product form, such as bar, plate, sheet, strip, tubing, or structural shape
• The deoxidation practice, such as killed, semikilled, capped, or rimmed steel
• The microstructure, such as ferritic, pearlitic, and martensitic (Fig. 1)
• The required strength level, as specified in ASTM standards
• The heat treatment, such as annealing, quenching and tempering, and thermomechanical processing
• Quality descriptors, such as forging quality and commercial quality
Fig. 1 Classification of steels. Source: D.M. Stefanescu, University of Alabama, Tuscaloosa
Of the aforementioned classification systems, chemical composition is the most widely used internationally and will be
emphasized in this article. Classification systems based on deoxidation practice and quality descriptors will also be
reviewed. Information pertaining to the microstructural characteristics of steels can be found in the article
"Microstructures, Processing, and Properties of Steels" in this Volume and in Metallography and Microstructures,
Volume 9 of ASM Handbook, formerly 9th Edition Metals Handbook.
Chemical Analysis
Chemical composition is often used as the basis for classifying steels or assigning standard designations to steels. Such
designations are often incorporated into specifications for steel products. Users and specifiers of steel products should be
familiar with methods of sampling and analysis.
Chemical analyses of steels are usually performed by wet chemical analysis methods or spectrochemical methods. Wet
analysis is most often used to determine the composition of small numbers of specimens or of specimens composed of
machine tool chips. Spectrochemical analysis is well-suited to the routine determination of the chemical composition of a
large number of specimens, as may be necessary in a steel mill environment. Both classical wet chemical and
spectrochemical methods for analyzing steel samples are described in detail in Materials Characterization, Volume 10 of
ASM Handbook, formerly 9th Edition Metals Handbook.
Heat and Product Analysis. During the steelmaking process, a small sample of molten metal is removed from the
ladle or steelmaking furnace, allowed to solidify, and then analyzed for alloy content. In most steel mills, these heat
analyses are performed using spectrochemical methods; as many as 14 different elements can be determined
simultaneously. The heat analysis furnished to the customer, however, may include only those elements for which a range
or a maximum or minimum limit exists in the appropriate designation or specification.
A heat analysis is generally considered to be an accurate representation of the composition of the entire heat of metal.
Producers of steel have found that heat analyses for carbon and alloy steels can be consistently held within ranges that
depend on the amount of the particular alloying element desired for the steel, the product form, and the method of making
the steel. These ranges have been published as commercial practice, then incorporated into standard specifications.
Standard ranges and limits of heat analyses of carbon and alloy steels are given in Tables 1, 2, 3, and 4.
Table 1 Carbon steel cast or heat chemical limits and ranges
Applicable only to semifinished products for forging, hot-rolled and cold-finished bars, wire rods, and seamless tubing
Element Maximum of
specified element, %
Range, %
≤
0.12
. . .
>0.12-0.25 incl
0.05
>0.25-0.40 incl
0.06
>0.40-0.55 incl
0.07
>0.55-0.80 incl
0.10
Carbon
(a)
>0.80
0.13
≤
0.40
0.15
>0.40-0.50 incl
0.20
Manganese
>0.50-1.65 incl
0.30
Phosphorus >0.040-0.08 incl
0.03
>0.08-0.13 incl
0.05
>0.050-0.09 incl
0.03
>0.09-0.15 incl
0.05
>0.15-0.23 incl
0.07
Sulfur
>0.23-0.35 incl
0.09
≤
0.15
0.08
>0.15-0.20 incl
0.10
>0.20-0.30 incl
0.15
Silicon (for bars)
(b)(c)
>0.30-0.60 incl
0.20
Copper
When copper is required, 0.20% minimum is commonly used
Lead
(d)
When lead is required, a range of 0.15-0.35 is generally used
Note: Boron-treated fine-grain steels are produced to a range of 0.0005-0.003% B. Incl, inclusive.
Source: Ref 1
(a)
The carbon ranges shown customarily apply when the specified maximum limit for manganese does not exceed 1.10%. When the maximum
manganese limit exceeds 1.10%, it is customary to add 0.01 to the carbon range shown.
(b)
It is not common practice to produce a rephosphorized and resulfurized carbon steel to specified limits for silicon because of its adverse effect
on machinability.
(c)
When silicon is required for rods the following ranges and limits are commonly used: 0.10 max; 0.07-0.15, 0.10-0.20, 0.15-0.35, 0.20-0.40, or
0.30-0.60.
(d)
Lead is reported only as a range of 0.15-0.35% because it is usually added to the mold or ladle stream as the steel is poured.
Table 2 Carbon steel cast or heat chemical limits and ranges
Applicable only to structural shapes, plates, strip, sheets, and welded tubing
Element Maximum of
specified element, %
Range, %
Carbon
(a)(b)
≤
0.15
0.05
>0.15-0.30 incl
0.06
>0.30-0.40 incl
0.07
>0.40-0.60 incl
0.08
>0.60-0.80 incl
0.11
>0.80-1.35 incl
0.14
≤
0.50
0.20
>0.050-1.15 incl
0.30
Manganese
>1.15-1.65 incl
0.35
≤
0.08
0.03
Phosphorus
>0.08-0.15 incl
0.05
≤
0.08
0.03
>0.08-0.15 incl
0.05
>0.15-0.23 incl
0.07
Sulfur
>0.23-0.33 incl
0.10
≤
0.15
0.08
>0.15-0.30 incl
0.15
Silicon
>0.30-0.60 incl
0.30
Copper When copper is required, 0.20% minimum is commonly specified
Incl, inclusive.
Source: Ref 1
(a)
The carbon ranges shown in the range column apply when the specified maximum limit for manganese does not exceed 1.00%. When the
maximum manganese limit exceeds 1.00%, add 0.01 to the carbon ranges shown in the table.
(b)
Maximum of 0.12% C for structural shapes and plates.
Table 3 Alloy steel heat composition ranges and limits for bars, blooms, billets, and slabs
Range, %
Element Maximum of
specified element, %
Open hearth or
basic oxygen steels
Electric
furnace steels
≤
0.55
0.05
0.05
>0.55-0.70 incl 0.08
0.07
>0.70-0.80 incl 0.10
0.09
>0.80-0.95 incl 0.12
0.11
Carbon
>0.95-1.35 incl 0.13
0.12
≤
0.60
0.20
0.15
>0.60-0.90 incl 0.20
0.20
>0.90-1.05 incl 0.25
0.25
>1.05-1.90 incl 0.30
0.30
Manganese
>1.90-2.10 incl 0.40
0.35
≤
0.050
0.015
0.015
>0.050-0.07 incl 0.02
0.02
>0.07-0.10 incl 0.04
0.04
Sulfur
(a)
>0.10-0.14 incl 0.05
0.05
≤
0.15
0.08
0.08
>0.15-0.20 incl 0.10
0.10
Silicon
>0.20-0.40 incl 0.15
0.15
>0.40-0.60 incl 0.20
0.20
>0.60-1.00 incl 0.30
0.30
>1.00-2.20 incl 0.40
0.35
≤
0.40
0.15
0.15
>0.40-0.90 incl 0.20
0.20
>0.90-1.05 incl 0.25
0.25
>1.05-1.60 incl 0.30
0.30
>1.60-1.75 incl
(b)
0.35
>1.75-2.10 incl
(b)
0.40
Chromium
>2.10-3.99 incl
(b)
0.50
≤
0.50
0.20
0.20
>0.50-1.50 incl 0.30
0.30
>1.50-2.00 incl 0.35
0.35
>2.00-3.00 incl 0.40
0.40
>3.00-5.30 incl 0.50
0.50
Nickel
>5.30-10.00 incl 1.00
1.00
≤
0.10
0.05
0.05
>0.10-0.20 incl 0.07
0.07
>0.20-0.50 incl 0.10
0.10
>0.50-0.80 incl 0.15
0.15
Molybdenum
>0.80-1.15 incl 0.20
0.20
≤
0.50
0.20
0.20
>0.50-1.00 incl 0.30
0.30
>1.00-2.00 incl 0.50
0.50
Tungsten
>2.00-4.00 incl 0.60
0.60
≤
0.60
0.20
0.20
>0.60-1.50 incl 0.30
0.30
Copper
>1.50-2.00 incl 0.35
0.35
≤
0.25
0.05
0.05
Vanadium
>0.25-0.50 incl 0.10
0.10
≤
0.10
0.05
0.05
>0.10-0.20 incl 0.10
0.10
>0.20-0.30 incl 0.15
0.15
>0.30-0.80 incl 0.25
0.25
>0.80-1.30 incl 0.35
0.35
Aluminum
>1.30-1.80 incl 0.45 0.45
Element Steelmaking process
Lowest maximum, %
(c)
Basic open hearth, basic oxygen, or basic electric furnace steels
0.035
(d)
Basic electric furnace E steels
0.025
Phosphorus
Acid open hearth or electric furnace steel
0.050
Sulfur Basic open hearth, basic oxygen, or basic electric furnace steels
0.040
(d)
Basic electric furnace E steels
0.025
Acid open hearth or electric furnace steel 0.050
Inc, inclusive.
Source: Ref 2
(a)
A range of sulfur content normally indicates a resulfurized steel.
(b)
Not normally produced by open hearth process.
(c)
Not applicable to rephosphorized or resulfurized steels.
(d)
Lower maximum limits on phosphorus and sulfur are required by certain quality
descriptors.
Table 4 Alloy steel heat composition ranges and limits for plates
Range, %
Element Maximum of
specified element, %
Open hearth or basic
oxygen steels
Electric
furnace steels
≤
0.25
0.06
0.05
>0.25-0.40 incl 0.07
0.06
>0.40-0.55 incl 0.08
0.07
>0.55-0.70 incl 0.11
0.10
Carbon
>0.70 0.14
0.13
≤
0.45
0.20
0.15
>0.45-0.80 incl 0.25
0.20
>0.80-1.15 incl 0.30
0.25
Manganese
>1.15-1.70 incl 0.35
0.30
>1.70-2.10 incl 0.40
0.35
≤
0.060
0.02
0.02
>0.060-0.100 incl 0.04
0.04
Sulfur
>0.100-0.140 incl 0.05
0.05
≤
0.15
0.08
0.08
>0.15-0.20 incl 0.10
0.10
>0.20-0.40 incl 0.15
0.15
>0.40-0.60 incl 0.20
0.20
>0.60-1.00 incl 0.30
0.30
Silicon
>1.00-2.20 incl 0.40
0.35
≤
0.60
0.20
0.20
>0.60-1.50 incl 0.30
0.30
Copper
>1.50-2.00 incl 0.35
0.35
≤
0.50
0.20
0.20
>0.50-1.50 incl 0.30
0.30
>1.50-2.00 incl 0.35
0.35
>2.00-3.00 incl 0.40
0.40
>3.00-5.30 incl 0.50
0.50
Nickel
>5.30-10.00 incl 1.00
1.00
≤
0.40
0.20
0.15
Chromium
>0.40-0.80 incl 0.25
0.20
>0.80-1.05 incl 0.30
0.25
>1.05-1.25 incl 0.35
0.30
>1.25-1.75 incl 0.50
0.40
>1.75-3.99 incl 0.60
0.50
≤
0.10
0.05
0.05
>0.10-0.20 incl 0.07
0.07
>0.20-0.50 incl 0.10
0.10
>0.50-0.80 incl 0.15
0.15
Molybdenum
0.80-1.15 incl 0.20
0.20
≤
0.25
0.05
0.05
Vanadium
>0.25-0.50 incl 0.10 0.10
Note: Boron steels can be expected to contain a minimum of 0.0005% B. Alloy steels can be produced with a lead range of 0.15-
0.35%. A heat analysis for lead is not determinable because lead is added to the ladle stream while each ingot is poured. Incl,
inclusive.
Source: Ref 3
Because segregation of some alloying elements is inherent in the solidification of an ingot, different portions will have
local chemical compositions that differ slightly from the average composition. Many lengths of bar stock can be made
from a single ingot; therefore, some variation in composition between individual bars must be expected. The
compositions of individual bars might not conform to the applicable specification, even though the heat analysis does.
The chemical composition of an individual bar (or other product) taken from a large heat of steel is called the product
analysis or check analysis. Ranges and limits for product analyses are generally broader and less restrictive than the
corresponding ranges and limits for heat analyses. Such limits used in standard commercial practice are given in Tables 5,
6, and 7.
Table 5 Product analysis tolerances for carbon and alloy steel plates, sheet, piling, an
d bars for structural
applications
Tolerance, %
Element Upper limit or maximum
specified value, %
Under
minimum limit
Over
maximum limit
Carbon
≤
0.15
0.02
0.03
>0.15-0.40 incl 0.03
0.04
≤
0.60
0.05
0.06
>0.60-0.90 incl 0.06
0.08
>0.90-1.20 incl 0.08
0.10
>1.20-1.35 incl 0.09
0.11
>1.35-1.65 incl 0.09
0.12
>1.65-1.95 incl 0.11
0.14
Manganese
(a)
>1.95 0.12
0.16
≤
0.04
. . .
0.010
Phosphorus
>0.40-0.15 incl . . .
(b)
Sulfur
≤
0.05
. . .
0.010
≤
0.30
0.02
0.03
>0.30-0.40 incl 0.05
0.05
Silicon
>0.40-2.20 incl 0.06
0.06
≤
1.00
0.03
0.03
Nickel
>1.00-2.00 incl 0.05
0.05
≤
0.90
0.04
0.04
Chromium
>0.90-2.10 incl 0.06
0.06
≤
0.20
0.01
0.01
>0.20-0.40 incl 0.03
0.03
Molybdenum
>0.40-1.15 incl 0.04
0.04
0.20 minimum only 0.02
. . .
≤
1.00
0.03
0.03
Copper
>1.00-2.00 incl 0.05
0.05
Titanium
≤
0.10
0.01
(c)
0.01
(c)
≤
0.10
0.01
(c)
0.01
(c)
>0.10-0.25 incl 0.02
0.02
Vanadium
Minimum only specified 0.01
. . .
Boron Any
(b)
(b)
Niobium
≤
0.10
0.01
(c)
0.01
(c)
Zirconium
≤
0.15
0.03
0.03
Nitrogen
≤
0.030
0.005 0.005
Incl, inclusive.
Source: Ref 4
(a)
Manganese product analyses tolerances for bars and bar size shapes:
≤
0.90, ±0.03; >0.90-2.20 incl, ±0.06.
(b)
Product analysis not applicable.
(c)
If the minimum of the range is 0.01%, the under tolerance is 0.005%.
Table 6 Product analysis tolerances for carbon and high-strength low-alloy steel bars, blooms, billets, and
slabs
Tolerance over the maximum limit or under the minimum limit, %
Element Limit or maximum
of specified range, %
≤
0.065 m
2
(100 in.
2
)
>0.065-0.129 m
2
(100-200 in.
2
)
incl
>0.129-0.258 m
2
(200-400 in.
2
)
incl
>0.258-0.516 m
2
(400-800 in.
2
)
incl
Carbon
≤
0.25
0.02 0.03 0.04
0.05
>0.25-0.55 incl 0.03 0.04 0.05
0.06
>0.55 0.04 0.05 0.06
0.07
≤
0.90
0.03 0.04 0.06
0.07
Manganese
>0.90-1.65 incl 0.06 0.06 0.07
0.08
Phosphorus
(a)
Over maximum only,
≤
0.40
0.008 0.008 0.010
0.015
Sulfur
(a)
Over maximum only,
≤
0.050
0.008 0.010 0.010
0.015
≤
0.35
0.02 0.02 0.03
0.04
Silicon
>0.35-0.60 incl 0.05 . . . . . .
. . .
Copper Under minimum only 0.02 0.03 . . .
. . .
Lead
(b)
0.15-0.35 incl 0.03 0.03 . . . . . .
Note: Rimmed or capped steels and boron are not subject to product analysis tolerances. Product analysis tolerances for alloy elements
in high-strength low-alloy steels are given in Table 7. Incl, inclusive.
Source: Ref 2
(a)
Because of the degree to which phosphorus and sulfur segregate, product analysis tolerances for those elements are not applicable for
rephosphorized and resulfurized steels.
(b)
Product analysis tolerance for lead applies, both over and under the specified range.
Table 7 Product analysis tolerances for alloy steel bars, blooms, billets, and slabs
Tolerance over the maximum limit
or under the minimum limit for size ranges shown, %
Element Limit or maximum of
specified range, %
≤
0.065 m
2
(100 in.
2
)
>0.065-0.129 m
2
(100-200 in.
2
)
incl
>0.129-0.258 m
2
(200-400 in.
2
)
incl
>0.258-0.516 m
2
(400-800 in.
2
)
incl
≤
0.30
0.01 0.02 0.03
0.04
>0.30-0.75 incl 0.02 0.03 0.04
0.05
Carbon
>0.75 0.03 0.04 0.05
0.06
≤
0.90
0.03 0.04 0.05
0.06
Manganese
>0.90-2.10 incl 0.04 0.05 0.06
0.07
Phosphorus Over max only 0.005 0.010 0.010
0.010
Sulfur Over max only
(a)
0.005 0.010 0.010
0.010
≤
0.40
0.02 0.02 0.03
0.04
Silicon
>0.40-2.20 incl 0.05 0.06 0.06
0.07
≤
1.00
0.03 0.03 0.03
0.03
>1.00-2.00 incl 0.05 0.05 0.05
0.05
>2.00-5.30 incl 0.07 0.07 0.07
0.07
Nickel
>5.30-10.00 incl 0.10 0.10 0.10
0.10
≤
0.90
0.03 0.04 0.04
0.05
>0.90-2.10 incl 0.05 0.06 0.06
0.07
Chromium
>2.10-3.99 incl 0.10 0.10 0.12
0.14
≤
0.20
0.01 0.01 0.02
0.03
>0.20-0.40 incl 0.02 0.03 0.03
0.04
Molybdenum
>0.40-1.15 incl 0.03 0.04 0.05
0.06
≤
0.10
0.01 0.01 0.01
0.01
>0.10-0.25 incl 0.02 0.02 0.02
0.02
>0.25-0.50 incl 0.03 0.03 0.03
0.03
Vanadium
Min value specified, check under min limit
(b)
0.01 0.01 0.01
0.01
Tungsten
≤
1.00
0.04 0.05 0.05
0.06
>1.00-4.00 incl 0.08 0.09 0.10
0.12
≤
0.10
0.03 . . . . . .
. . .
>0.10-0.20 incl 0.04 . . . . . .
. . .
>0.20-0.30 incl 0.05 . . . . . .
. . .
>0.30-0.80 incl 0.07 . . . . . .
. . .
Aluminum
(c)
>0.80-1.80 incl 0.10 . . . . . .
. . .
Lead
(c)
0.15-0.35 incl 0.03
(d)
. . . . . .
. . .
≤
1.00
0.03 . . . . . .
. . .
Copper
(c)
>1.00-2.00 incl 0.05 . . . . . .
. . .
Titanium
(c)
≤
0.10
0.01
(b)
. . . . . .
. . .
Niobium
(c)
≤
0.10
0.01
(b)
. . . . . .
. . .
Zirconium
(c)
≤
0.15
0.03 . . . . . .
. . .
Nitrogen
(c)
≤
0.030
0.005 . . . . . . . . .
Note: Boron is not subject to product analysis tolerances. Incl, inclusive.
Source: Ref 2
(a)
Resulfurized steels are not subject to product analysis limits for sulfur.
(b)
If the minimum of the range is 0.01%, the under tolerance is 0.005%.
(c)
Tolerances shown apply only to 0.065 m
2
(100 in.
2
) or less.
(d)
Tolerance is over and under.
Residual elements usually enter steel products from raw materials used to produce pig iron or from scrap steel used in
steelmaking. Through careful steelmaking practices, the amounts of these residual elements are generally held to
acceptable levels. Sulfur and phosphorus are usually considered deleterious to the mechanical properties of steels;
therefore, restrictions are placed on the allowable amounts of these elements for most grades. The amounts of sulfur and
phosphorus are invariably reported in the analyses of both carbon and alloy steels. Other residual alloying elements
generally exert a lesser influence than sulfur and phosphorus on the properties of steel. For many grades of steel,
limitations on the amounts of these residual elements are either optional or omitted entirely. Amounts of residual alloying
elements are generally not reported in either heat or product analyses, except for special reasons.
Silicon Content of Steels. The composition requirements for many steels, particularly plain carbon steels, contain no
specific restriction on silicon content. The lack of a silicon requirement is not an omission, but instead indicates
recognition that the amount of silicon in a steel can often be traced directly to the deoxidation practice employed in
making it (further information can be found in the section "Types of Steel Based on Deoxidation Practice" in this article).
Rimmed and capped steels are not deoxidized; the only silicon present is the residual amount left from scrap or raw
materials, typically less than 0.05% Si. Specifications and orders for these steels customarily indicate that the steel must
be made rimmed or capped, as required by the purchaser, restrictions on silicon content are not usually given.
The extent of rimming action during the solidification of semikilled steel ingots must be carefully controlled by matching
the amount of deoxidizer with the oxygen content of the molten steel. The amount of silicon required for deoxidation may
vary from heat to heat. Thus, the silicon content of the solid metal can also vary slightly from heat to heat. A maximum
silicon content of 0.10% is sometimes specified for semikilled steel, but this requirement is not very restrictive; for certain
heats, a silicon addition sufficient to leave a residue of 0.10% may be enough of an addition to kill the steel.
Killed steels are fully deoxidized during their manufacture; deoxidation can be accomplished by additions of silicon,
aluminum, or both, or by vacuum treatment of the molten steel. Because it is the least costly of these methods, silicon
deoxidation is frequently used. For silicon-killed steels, a range of 0.15 to 0.30% Si is often specified, providing the
manufacturer with adequate flexibility to compensate for variations in the steelmaking process and ensuring a steel
acceptable for most applications. Aluminum-killed or vacuum-deoxidized steels require no silicon; a requirement for
minimum silicon content in such steel is unnecessary. A maximum permissible silicon content is appropriate for all killed
plain carbon steels; a minimum silicon content implies a restriction that the steel must be silicon killed. Silicon is
intentionally added to some alloy steels, for which it serves as both a deoxidizer and an alloying element to modify the
properties of the steel. An acceptable range of silicon content would be appropriate for these steels.
Users and specifiers of steel mill products must realize that the silicon content of these items cannot be established
independently of deoxidation practice. In ordering mill products, it is often desirable to cite a standard specification (such
as an ASTM specification) where the various ramifications of restrictions on silicon content have already been considered
in preparing the specification. In some instances, such as the forming of low-carbon steel sheet, the choice of deoxidation
practice can significantly affect the performance of the steel; in such cases, it is appropriate to specify the desired practice.
Types of Steel Based on Deoxidation Practice (Ref 3)
Steels, when cast into ingots, can be classified into four types based on the deoxidation practice employed or,
alternatively, by the amount of gas evolved during solidification. These types are killed, semikilled, rimmed, or capped
steels (Fig. 2).