Modeling and Simulation for Material Selection and Mechanical Design Part 4 pot
Bạn đang xem bản rút gọn của tài liệu. Xem và tải ngay bản đầy đủ của tài liệu tại đây (388.9 KB, 17 trang )
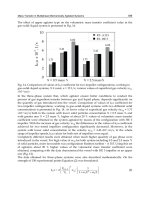
bulk and on the interface. As seen in Fig. 14, the elastic interaction energy of
the P atoms with grain boundaries in iron is equal to 0.53 eV=at and
decreases significantly at molybdenum alloying to 0.24 eV=at in the alloy
Fe–3.1at.% Mo. Decrease of segregation energy of the impurity at its
Table 1 Composition (at.%) of the Fe–P and Fe–P–Mo Alloys
Chemical composition, at.%
CSPMo
0.01 0.002 0.017 0
0.01 0.003 0.10 0
0.01 0.002 0.15 0
0.01 0.003 0.093 3.1
0.01 0.002 0.033 3.1
0.01 0.002 0.14 3.1
0.01 0.005 0.09 0.3
0.01 0.014 0.074 0.02
Figure 14 Change of E
seg
of phosphorus with its volume concentration in Fe (1)
and Fe–3.1 at.% Mo–P alloys (2). Auger electron spectroscopy of free surface
segregations at 823K.
Copyright 2004 by Marcel Dekker, Inc. All Rights Reserved.
volume concentration growth is caused by chemical pair interaction of the
atoms in alloy.
Using the example of the Fe–P system, we could determine chemical
interaction of elements by applying the approach proposed in Ref. [34].
Analyzing the solidus and liquidus equilibrium (volume and GB) on the
equilibrium phase diagram at three temperatures permits the construction
of a system of three equations that describe this equilibrium
kT q
a
À ln
100 ÀX
s
100 ÀX
l
¼ X
2
s
W
0
À X
2
l
W
00
þ kq
a
T
a
ð17Þ
where k is the Boltzmann constant; T
a
is the melting temperature of
Fe; q
a
is melting entropy per atom divide d by Boltzmann constant;
W
0
and W
00
are the mixing energies in solid and liquid states; X
s
and
X
l
are the impurity concentration in solid and liquid phases at the tem-
perature T.
Solving these equations for the phase diagram of Fe–P binary sys-
tem [35], the sign and value of mixing energy in liquid phase equal
0.425 eV=at were determined. The positive value (in accordance with phy-
sical sense) means that binding force of P–P and Fe–Fe atoms is higher
than for Fe–P atoms:
W ¼ W
FeÀP
À
1
2
ðW
FeÀFe
þ W
PÀP
Þð18Þ
emphasizing the tendency for solid solution tendency for stratification or
intercrystalline internal adsorption.
D. Effect of Solute Interaction in Multicompo nent System
on the Grain Boundary Segregation
Guttman has expanded the concept for synergistic co-segregation of alloy-
ing elements and harmful impurities at the grain boundaries. His theory is
very important for analysis of steels and alloys that contain many impuri-
ties and alloying elements. In accordance with the theory, the interaction
between alloying elements and the impurity atoms could be estimated from
enthalpy of form ation of the intermetallic compounds (NiSb, Mn
2
Sb, Cr
3
P,
etc.). The alloying elements could influence on the solubility of impurities in
the solid solution. Only the dissolved fraction of the impurity takes part in
the segregation [36]. When preferential chemical interaction exists between
M (metal) and I (impurity) atoms with respect to solvent, the energy of
Copyright 2004 by Marcel Dekker, Inc. All Rights Reserved.
segregation becomes functions of the inter granular concentrations of I
and M:
DG
I
¼ DG
0
I
þ
b
b
MI
C
b
Y
b
M
À
b
a
MI
C
a
X
a
M
ð19Þ
DG
M
¼ DG
0
M
þ
b
b
MI
a
b
Y
b
I
À
b
a
MI
a
a
X
a
I
ð20Þ
where C
b
and a
b
are the fractions of sites available in the interface for I and
M atoms, respectively ða
b
þ C
b
¼ 1Þ; Y
b
is the partial coverage in the inter-
face; X
a
is the concentra tion in the solid solution a; b
MI
is the interaction
coefficient of M and I atoms in a-solid solution (a) or on the grain boundary
(b). For a preferen tially attractive M–I interaction, the b
MI
are positive and
the segregation of each element enhances that of the other. If the interaction
is repulsive, the b
MI
are negative and the segregations of both elements will
be reduced. For a high attractive M–I interaction in the a-solid solution, the
impurity can be partially precipitated in the matrix into a carbide, or inter-
metallic compound. The interface is then in equilibrium with an a-sol ution
where the amount of dissolved I, X
I
a
, may become considerably smaller than
its nominal content.
In the ternary solid solutions, the segregation of impurity (I) could be
lowered or neglected at several critical concentrations of the alloying
element (M) whose value (C
M
a
) depends on surface activity of each compo-
nent (E
Seg
I,M
) and interaction features of the dissolved atoms (b
MI
):
C
M
a
¼
E
I
Seg
b
MI
ðexpðE
M
Seg
=RTÞÀ1Þ
ð21Þ
The critical concentration of alloying element is accessible for segregation of
impurity and alloying element E
I;M
Seg
> 0 and repulsion of different atoms
b
MI
> 0; or without segregation of alloying element E
M
Seg
< 0 and with
attraction of different atoms b
MI
< 0.
In this case, the dependence of E
Seg
I,M
on the dissolved element concentra -
tion is not taken into account. Indeed, for systems with limited solubility, the
alteration of value and sign of segregation energy is possible at a definite con-
tent of alloying element. The phase equilibrium diagram analysis allows the
determination of mutual influence of components on their surface activity.
The equilibrium distribution of solute elements between solid and
liquid phases in iron-base ternary system (distribution interaction coefficient
K
0
) is known to be an important factor in relation to microsegregation dur-
ing the solidification of steels. As it was shown above, these analogies
are useful for the prediction of GBS and for impurity segregation energy
Copyright 2004 by Marcel Dekker, Inc. All Rights Reserved.
determination in the given solvent. The K
0
of some elements, especially in
multicomponent systems, is co nsidered to be different from those in binary
systems because of the possible existence of solute interactions, but the
mechanisms are so complicated that detailed information has not yet been
obtained. Therefore, it would be very useful if the effect of an addition of
an alloying element on the distribution could be determined by the use of
a simple parameter.
Equilibrium distribution coefficient K
0
À1
of various elements in Fe–C
base ternary system is calculated from equilibrium distribution coefficient in
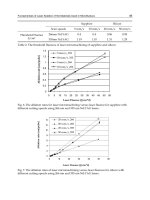
iron-base binary systems [40–43]. In Fig. 15, the calculated results are com-
pared with the measured values by various investigators. The changes of the
K
0
À1
of P and S with various alloying elements are shown in Fig. 16(a, b) in
Fe–P and Fe–S base ternary system, respectively.
These data could be applied for calculation of phosphorus segregation
energy change under the alloying element influence in Fe–Me–0.1at.% P
alloys (Fig. 17) or for calculation of the segregation energy change of
alloying elements with concentration of carbon in Fe–0.1Me–C alloys
(Fig. 18). For the growth of carbon volume content, the segregation energy
of C and P decreases which means lowering of the segregation stimulus for
these elements.
Figure 15 Change of the equilibrium distribution coefficient of some elements with
carbon concentration in Fe–C-based ternary systems. (From Ref. 37.)
Copyright 2004 by Marcel Dekker, Inc. All Rights Reserved.
tion are developed, but rich segregations dissolve. Distinguishing diffusion
mobility and mutual influence of elements on their diffusion coefficients
determines much of their segregation ability. Amplification or suppression
of adsorption could be due to a kinetic factor. This peculiarity determines
the fundamental factor of distinguishing adsorption from gas phase to free
surface when comparing it to intercrystalline internal adsorption: GBS is
controlled by diffusion during heat treatment of steels and alloys.
Many GBS features in multicomponent systems cannot be predicted
adequately using the equilibrium segregation thermodynamic accounting
basis. Particularly, the thermodynamic concept of the cooperative (synergis-
Figure 16 (Continued)
Copyright 2004 by Marcel Dekker, Inc. All Rights Reserved.
where X
b
(t) is the interfacial coverage of element, at time t; X
b
(0) — is its
initial value and X
b
its equilibrium value as defined by Eq. (7); X
i
a
—is
its volume concentration; D
i
is the bulk diffusivity of i and d is the interface
thickness.
Assuming X
b
=X
i
a
¼const, using Laplace transformation for (22), one
can obtain the approximate expression
X
b
ðtÞÀX
b
ð0Þ
X
b
À X
b
ð0Þ
¼
2X
a
i
X
b
d
ffiffiffiffiffiffiffiffiffiffi
FDt
i
p
r
ð23Þ
where F ¼4 for grain boundaries and F ¼1 for free surface.
The kinetics of segregation dissolution could be described by these
equations (22) and (23). But, in this case, the variables X
b
(0) and X
b
exchange places. The influence of Mo, Cr, and Ni additions on kinetics of
P segregation has been studied in six Fe–Me–P alloys, whose base composi-
tions are listed in Table 1. These materials were austenitized for 1 hr at
1323K and quenched in water. The tempering of foils at 773K was carried
out in a work chamber of an electron spectrometer ESCALAB MK2 (VG).
The kinetics of P segregation studied for Fe–Me–P alloys (Figs. 20–22) show
that equilibrium is reached within several hours. Based on the starting posi-
tion of adsorption isot herms, the phosphorus diffusion coefficients in these
alloys were calculated using Eq. (22). The data are presented in Table 2.
Molybdenum reduces significantly P surface activity and decelerates its
diffusion. Nickel is not a surface-active element in carbonless alloys, Fe–
P–Ni. It increases sharply P thermodynamic activity and equilibrium GB
concentration, and accelerates its diffusion. Chromium segreg ates poorly
Figure 19 Kinetics of P GBS in steel 0.3C–1.6Mn–0.8Cr–008P (1) with adds of
0.047Ti (2) or (0.07Ti and 0.026V) (3), quenched from 1273K and tempered at 923K.
Copyright 2004 by Marcel Dekker, Inc. All Rights Reserved.
time at increasing temperature. With temperature increase, the solubility of
impurity in solid solution increases, and its GB concentration reduces. It fol-
lows that the probability to form the segregation with high impurity content
reduces, and time for such segregation increases extensively. The upper
branch of isodose curves corresponds to dissolution of rich segregations
and access to new equilibrium with lower impurity concentration. The
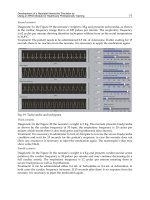
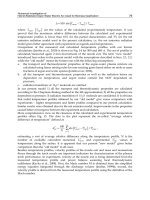
Figure 23 The isodose C-curves of multicomponent interface segregation in 0.3C–
Cr–Mo steel (see Table 3). Auger electron spectroscopy of free surface segregations.
Figure 24 The isodose C-curves of multicomponent interface segregation in 0.2C–
Cr–Mn–Ni–Si steel (see Table 3) under its tempering. Auger electron spectroscopy of
free surface segregations.
Copyright 2004 by Marcel Dekker, Inc. All Rights Reserved.
adsorption patterns for engineering steels have common as well as indivi-
dual features. As a rule, carbon segregates at temperatures lower than
523K, nitrogen—in 523–623K range, phosphorus—in 523–823K range, sul-
fur segregates at temperatures higher than 723K.
The substitual and interstitial element concurrence promotes blocking
of adsorption centers by mobile impurities and impedes P segregation at
Figure 25 The isodose C-curves of multicomponent interface segregation in 0.3C–
Cr–Mn–Nb steel (see Table 3) under its tempering. Auger electron spectroscopy of
free surface segregations.
Figure 26 The isodose C-curves of multicomponent interface segregation in 0.3C–
Cr–Mn–V steel (see Table 3) under its tempering. Auger electron spectroscopy of free
surface segregations.
Copyright 2004 by Marcel Dekker, Inc. All Rights Reserved.
the thermokinetic diagrams for ternary Fe–Me–P alloys based on Eqs. (23)
and (6), the mutual influence of elements on their binding energy to GB was
determined [36]
E
P
seg
¼ 20:6 þ 183C
P
a
À 4:8C
Al
a
À 7:2C
Mo
a
À 3:4C
Ni
a
À 7141C
B
a
þ 4:9C
Cr
a
À 444C
S
a
À 183E
Mo
seg
À 87E
N
seg
ð24Þ
E
S
seg
¼ 6:9 À 151C
S
a
À 1:5C
Al
a
þ 14:5C
P
a
À 39E
Sn
seg
ð25Þ
E
N
seg
¼ 16 À 2:6C
Al
a
þ 3C
Mo
a
þ 4:2C
Cr
a
À 2625C
Ti
a
þ 175E
Mo
seg
ð26Þ
Figure 28 Influence of alloying on the kinetics isotherms of P free surface
segregation at 723K. The following steels were investigated (see Table 3): 1, 3C–Cr–
Mn–Nb; 2, 3C–Cr–Mn–Si–Ti; 3, 2C–Cr–Mn–Ni–Si; 4, 3C–Cr–Mo; 5, 3C–Cr–
Mn–V.
Copyright 2004 by Marcel Dekker, Inc. All Rights Reserved.
E
C
seg
¼ 7:9 À 1:4C
Al
a
þ 5C
Mo
a
þ 676C
B
a
þ 1:2C
Cr
a
À 130E
N
seg
þ 116E
P
seg
ð27Þ
E
Mo
seg
¼À0:7 þ 32E
N
seg
À 28E
P
seg
ð28Þ
E
Ti
seg
¼ 17 þ 3C
C
a
À E
P
seg
ð29Þ
E
Al
seg
¼ 1:4C
Al
a
ð30Þ
E
Sn
seg
¼ 21; E
Ni
seg
¼ 14; E
B
seg
¼ 54; E
Cu
seg
¼ 20 kJ/mol
where E
seg
I
is segregation energy of the I element, C
a
j
is bulk concentration of
j impurity.
F. Stability of the Segregation
The equilibrium GBS dissolves as temperature increases. Analysis of the
kinetic development of the equilibrium segregation level of P shown in
Fig. 29 gives the T–t plot of segreg ation directly. Obviously that segregation
level close to the maximum exists only within a specific temperature range.
This range is characterized by a maximum temperature stability T
max
,over
which the intensive dissolution of the segregates is observed. This tempera-
ture can be calculated by computer analysis of Eq. (7) at dC
b
max
=dT ¼0.
The temperature T
max
depends on E
seg
and temperature dependencies of
solubility limits, which can be determined from analysis of phase equili-
brium diagrams [43].
Using these dependencies as a generalizing criterion, it is possible to
simplify the analysis of data on element segregation kinetics in iron alloys.
The interrelationship of maximum temperature of stability (T
max
) of rich
equilibrium segregations and segregation energies of different elements is
presented in Fig. 30.
The common features of kinetics show the following groups:
1. enriching grain boundaries at low- and medium-tempering
temperatures—B, C, N, and Cu;
2. co-segregating with P at high tempe ring—P, Sn, Ti, and Mo;
3. segregating at high temperatures—S and Al.
Phosphorus in Fe alloys has abnormally weak dependence of T
max
on E
seg
in reversible temper embrittlement temperature range. In other
Copyright 2004 by Marcel Dekker, Inc. All Rights Reserved.
Figure 31 presents the thermokinetic diagram of element segregation
in 0.35C–1.5Mn–0.1P–0.6Al steel. The chemical composition of free surface
segregations was determined by AES for a set of isothermal conditions in
the spectrometer ESCALAB MK2 (VG). The temperature–time interval
of preferential segregation of chemical elements is the result of different dif-
fusion mobil ity and binding energy of elements with GB. The temperature
interval of P preferential segregation is caused by concurrence of this impur-
ity with mobile interstitial elements C and N. This process determines
temperature and exposition necessary for RTE development. Direct investi-
gation of grain boundary composition by AES confirms the conclusion
about the prevailing role of concurrent segregation in RTE. The composi-
tion of several grain boundaries on brittle intercrystalline fracture of
0.35C–Mn–Al steel after heat treatment: quenching from 1223K, tempering
at 923K for 1 hr with rapid (a) and slow (b) cooling is presented in Fig. 32
[47]. These data are in good correspondence with those in Fig. 31. Acceler-
ated cooling of steel, does not provide enough time for the development of
segregations with high P content, and GB are enriched by C. During slow
cooling, phosphorus has enough time to enrich the grain bounda ries. In this
case, the carbon concentration on GB is sufficiently lower than at rapid
cooling of steel. Carbon segregations are unstable at temperatures higher
than 500–673K, and they are dissolved. At slow cooling, P segregates to
grain boundaries, decreasing the GB redundant energy. This circumstance
lessens the thermodynamic stimulus for carbon segregation as the tempera-
ture decreases. Carb on and phosphorus in steels are responsible for RTE
development. They have high surface activity and diffusion mobility that
Figure 31 Thermo-kinetics diagrams of multicomponent segregation on free
surface in steel 0.35C–1.58Mn–0.1P–0.6Al.
Copyright 2004 by Marcel Dekker, Inc. All Rights Reserved.
enrichment of GB by carbon at rapid cooling [48]. Undoubtedly, carbide
transformation, internal stresses, substructure transformations are very
important for RTE. One should take into account such circumstances
where kinetics of C and P segregation are dependent significantly on steel
alloying.
IV. DYNAMIC SIMULATION OF GRAIN BOUNDARY
SEGREGATION
A. Interface Adsorption During Tempering of Steel
1. Decomposition of Martensite
The common laws of multicomponent GBS and analysis of experimental
diagrams on elements segregation kinetics in iron alloys are used to develop
the computer models of these processes. The exact solution of McLean’s
diffusion Eq. (21) accounting for temperature dependant of diffusion and
element solubility is a complex problem. In low-alloyed steels, the concen-
tration of surface-active impurities (S, P, and N) is rather small, and based
on this reason, it is possible to analyze the diffusion of each element sepa-
rately. The model takes into accoun t mutual influence of bulk and surface
concentration of elements with respect to segregation energies.
Carbon in solid solution has maximum influence on phosphorus GBS
kinetics. Concentration of C in martensite changes significantly during
quenched steel tempering and mainly depends on alloying element content.
Based on this reason, one should take into account the solid solution com-
position altering segregation processes modeli ng during tempering.
Investigations of martensite tetragonality at alloyed steel tempering
[6,7] are the basis for calculations of mutual influence of alloying elements
on martensite decomposition kinetics and carbon content in solid solution.
The carbon content change in solid solution during tempe ring of engineer-
ing steels is well described by equation
DX
C
a
X
C
a
ð0Þ
¼ 1 À exp ÀKD
o
t exp À
Q
RT
n
!
ð31Þ
where
DX
C
a
¼ X
C
a
ð0ÞÀX
C
a
ðtÞð32Þ
X
a
C
(0) and X
a
C
(t) are the carbon content in quenched steel and after a time t;
D
o
is the carbon diffusion coeff icient; Q is the activation energy associated
with the interstitial diffusion of carbon atoms; K is the constant associated
Copyright 2004 by Marcel Dekker, Inc. All Rights Reserved.
with the nucleation; n is the constant independent of both temperature and
X
a
C
(0); R is the gas constant and T is the tempe rature.
Influence of C and alloying elements on parameters Q, K, and n in
Eq. (31) is determined for various steels. The activation energy Q in low-
alloyed steel depends on the concentration of carbon and alloying elements
in solid solution:
Qðcal=molÞ¼8571:5X
C
a
þ A X
Me
a
þ 18; 000 ð33Þ
where X
a
C
and X
a
Me
are concentrations of C and alloying elements, mass%;
A is a constant depending on alloying element. The values of coefficients in
Eq. (31) are presented in Tables 4 and 5. The diffusion activation energy of
Table 4 Coefficient A in Eq. (28) for Low-Alloying Engineering Steels
Coefficient A
Alloying element
Ni Si Mn Cr Mo
433.56 1,432.54 À726.35 À2,898.91 À971.51
Table 5 Influence of Carbon and Alloying Elements on Parameters Q, K,
and n in Eq. (31)
Steel, wt.% Q, cal=mol Ln Kn
0.4C–0.24Ni 21,532 15.364 0.26
0.39C–3.0Ni 22,643 17.481 0.22
0.37C–5.6Ni 23,599 18,575 0.24
0.4C–0.32Mn 21,196 15.737 0.24
0.4C–1.32Mn 20,298 14.241 0.22
0.4C–2.43Mn 19,406 13.713 0.24
0.4C–0.2Cr 20,848 15.366 0.21
0.4C–2.1Cr 15,348 10.076 0.24
0.4C–3.6Cr 10,992 5.481 0.42
0.4C–6.7Cr 2,005 1.698 2.32
0.4C–0.37Si 21,929 16.351 0.19
0.38C–1.75Si 23,764 15.234 0.22
0.4C–2.75Si 25,368 10.050 0.15
0.4C 21,429 16.72 0.24
1.4C 30,000 40.881 0.07
1.2C–2.0Mo 26,343 29.768 0.08
Copyright 2004 by Marcel Dekker, Inc. All Rights Reserved.
carbon de creases on the growth of carbide-forming element (Mn, Cr, and
Mo) concentration. The contrary effect is observed for Ni and Si.
Obviously, it is associated with the different influence of these elements
on thermodynamic activity of carbon in ferrite. These dependencies are
basic for calculations of segregation kinetics of C since carbon is the element
that influences on P segregation highly. The kinetics of carbon content in
solid solution change during tempering of quenched steel 0.43C–2.43Mn
(mass%) are shown in Fig. 33. These data are obtained by computer mod-
eling using Eqs. (31–33) and those from Tabl es 4 and 5.
This model provides the possibility of calculating the influence of
alloying on cementite formation temperature interval, growth rate of its
particles, and many other parameters of martensite decomposition at tem-
pering [49].
Fig. 34 presents the calculation results of effective growth rate of Fe
3
C
nucleus at tempering of engineering alloyed steels. The calculations were
carried out using expression [49]:
V
max
R ¼ð27D=256pÞN ð34Þ
where R is the cementite particle radius; N is the right part of Eq. (30). Man-
ganese decreases martensite stability significantly promoting its decomposi-
tion at low temperatures. Silicon, at a concentration greater than 1%,
activates martensite decomposition at 700–800K and inhibits it at lower
Figure 33 Change of carbon concentration in solid solution with temperature and
time of tempering. Steel 0.43C–2.43 Mn (mass%). Isodose curves for: 1, 1 at.% C; 2,
0.5 at.% C; 3, 0.1 at.% C; 4, 0.05 at.% C; 5, 0.03 at.% C.
Copyright 2004 by Marcel Dekker, Inc. All Rights Reserved.
of treatment. This factor influences on thermodynamic activity of all steel
components and on their energy of GB segregation.
The secon d important stage of GBS modeling includes calculation
of C volume concentration in martensite X
a
C
(T), depending on steel
chemical composition X
a
i
(0) and parameters of tempering. New segregation
energy values of each element at changing of treatment temperature or
time and new equili brium GBS level have been calculated in this way (see
Fig. 35).
The final stage of modeling includes a set of independent calculations
of various element diffusion to GB zone, and their desorption. The limit ed
capacity of boundary and its effective width (about 0.5 nm) are shown. It is
assumed that interstitial and substitial impurities occupy different positions
on GB. Time t of reaching the definite concentration of impurity in segreg a-
tion X
b
(t) at given temper temperature T is calculated by (22), and it is con-
trolled by diffusion D
i
(T).
Adsorption in multicomponent system is accompanied by concur-
rence: arri val of some surface-act ive impurity decreases GB energy and, in
this way, the thermodynamic stimulus for segregation of other impurities.
Dissolution of segregations is observed at increasing temperature. Impurity
desorption to grain bulk is analogous to adsorption, however it is tied not
with concentration X
i
(0) but with X
b
(t), and it is also controlled by diffusion
D
i
(t).
Figure 35 Calculation scheme of equilibrium impurity GBS. X
a
i
(0) is the initial
concentration of ith element in the steel; X
a
C
(T,t) is the running carbon concentration
in martensite during its tempering; X
b
i
(T) is the maximal equilibrium GBS of ith
element; E
i
seg Fe–i
is the segregation energy of ith element in two-component Fe–I
alloy; E
i
seg Fe–i–j
is the segregation energy of ith element in multicomponent alloy;
D
i
(T) is the diffusion coefficient of ith element in austenite, martensite, and ferrite.
Copyright 2004 by Marcel Dekker, Inc. All Rights Reserved.
The model is restricted to initially homogeneous bulk concentra-
tions
X
i
b
ð0Þ¼X
i
a
ð35Þ
The kinetics of segregation to surfaces or grain bounda ries from the
bulk are determined by volume diffusion of impurities with bulk concentra-
tions X
i
a
(t) which can be treated as a one-dimensional problem. Since both
bulk concentrations are very small, Arrhen ius type diffusion coefficients:
D
i
¼ D
i
0
exp À
Q
i
RT
ð36Þ
can be used which are independent of X
i
a
(t). In the case of site competition,
the GB impurities concentration is
q
i
¼
X
i
1 À
P
J
X
j
exp À
E
i
KT
ð37Þ
The equations describing the time evolution of segregation for hom o-
geneous initial condition [60] are
X
i
ðtÞ¼X
i
ð0Þþ2
X
0
i
ffiffiffi
p
p
d
ffiffiffiffiffiffiffiffiffiffiffiffiffiffiffiffiffiffiffiffiffiffiffiffiffi
Z
t
0
D
i
ðt
0
Þdt
0
s
À
1
ffiffiffi
p
p
d
Z
t
0
q
i
ðt
0
ÞD
i
ðt
0
Þ
ffiffiffiffiffiffiffiffiffiffiffiffiffiffiffiffiffiffiffiffiffiffiffiffiffiffi
R
t
0
t
D
i
ðt
00
Þdt
00
q
ð38Þ
In the case of constant temperature (i.e. D
i
¼const), Eq. (38) can be
simplified:
X
i
ðtÞ¼X
i
ð0Þþ
2
ffiffiffiffi
D
p
ffiffiffi
p
p
d
½X
0
i
À q
i
ðtÞ
ffiffi
t
p
ð39Þ
Diffusion coefficient for impurities in Fe and Fe-base alloys in ferrite
interval is present in Table 6.
The calculated diagrams of multicomponent adsorpt ion in steels 0.3C–
Cr–Mo, 0.3C–Cr–Mn–V, 0.3C–Cr–Mn–Si–Ti (see Table 3) are presented in
Figs. 36–38. Comparing these diagrams with the experimental ones (Figs.
24, 26, and 27), a good correlation of segregation kinetic features
for various elements is observed, that confirms the basic principles of the
proposed model of GBS in steels. According to this model, the main
role of carbide precipitation in GBS consists of changing solid solution
Copyright 2004 by Marcel Dekker, Inc. All Rights Reserved.
The results of mathematical modeling provide backgrounds for rea-
sonable planning of full-scale experiments when seeking for the opti-
mum technological procedures and steel composition and they enable the
extrapolation of the consequences of variations in the technological condi-
tions even outside the boundary of the empirical experience we have available.
Interaction of GB segregation enrichment and phase transformations
during heat treatment of steels in the austenitic region is hard to imagine.
Nb and V carbonitride precipitation in microalloyed austenite, precipita-
tion of free ferrite, change chemical composition of austenite, and influ-
ence on GBS kinetics to a large extent. The experiments show that non-
equilibrium grain boundary phenomena occur for a rather short time up
to 100 sec. The minimum time of 5% volume fraction of Nb and V carbo-
nitride precipitation is about 1000 sec [62,63]. Precipitation of free ferrite
needs from several seconds to several minutes depending on steel chemical
composition. Therefore, the non-equilibrium GBS in steels with a wide
region of undercooled austenite stability independently from phase trans-
formations. This computer model has some limitations but redistribution
of harmful impurities between grain bulk and boundaries permits the ana-
lysis of steel quenching.
The modeling of non-equilibrium GB phenomena allows during inves-
tigation of such short-time changes of chemical composition that could not
be measured experimentally and that has an extreme importance for modern
heat-treatment processes with high heating and cooling velocities in
controlled media.
Figure 40 Dependence of time of 6 at.% GBS of phosphorus and sulfur as a
function of sulfur concentration in 0.3C–Cr–Mn–Si–Ti steel during its tempering at
700K. Computer simulation.
Copyright 2004 by Marcel Dekker, Inc. All Rights Reserved.