Engineered Interfaces in Fiber Reinforced Composites Part 6 ppt
Bạn đang xem bản rút gọn của tài liệu. Xem và tải ngay bản đầy đủ của tài liệu tại đây (761.56 KB, 30 trang )
134
Engineered interfaces
in
fiber reinforced composites
"0
10
20
30
40
50
(mm)
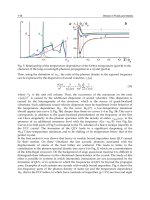
Fig.
4.24.
Plot
of
partial debond stress,
uz,
as a function
of
debond length,
e,
for
untreated
Sic
fiber-glass
matrix composite. After Kim et
al.
(1991).
In
light of the foregoing discussion concerning the functional partitioning of the
partial debond stress, the characteristic debond stresses can be evaluated. The initial
debond stress,
ao,
is
obtained for an infinitesimal debond length where the frictional
stress component
is
zero, i.e.,
60
=
aele,o
.
(4.101)
The maximal debond stress,
6:.
is determined immediately before the load
instability (Karbhari and Wilkins,
1990;
Kim et al., 1991)
of
the partial debond
stress,
a:,
when the debond length becomes
t
=
L
-
zmax:
%
oe
+
(8
-
at){
1
-
exp[-A(L
-
~max)]}
.
(4.102)
Details of the instability conditions
of
the debond process and
Zmax
are discussed in
Section 4.3.4. Further, the solution for the initial frictional pull-out stress,
ofr.
upon
complete debonding is determined when the debond length,
f?,
reaches the embedded
length,
L,
and the crack tip debond stress,
at,
is zero:
(4.103)
In
Eq.
(4.103), it is assumed that the influence
of
the instantaneous fiber
displacement relative to the matrix due to the sudden load drop after instability is
negligible.
Chapter
4.
Micromechanics
of
sfi-ess
transfer
135
4.3.4.
Instability
of
debond
process
The instability condition requires that the derivative of the partial debond stress
with respect to the remaining bond length
(z
=
L
-
e)
is equal to or less than zero,
i.e.,
do$'dzdO
(Kim et al.,
1991).
Therefore, the fiber debond process becomes
unstable if
(L
-
C)
is smaller than a critical bond length,
z,,,,
where the slopes of the
curves become zero in Figs. 4.23 and 4.24. At these bond lengths, the partial debond
stress,
a:,
corresponds to the maximum debond stress, CT;. The
zmax
value
is
determined from Eq. (4.102) as
1
o(i5
-
0;)
((Ti
-
(Tt)
+
(a
-
0;)
(4.104)
Numerical treatment of
Eq.
(4.104) gives
z,,,
values for the different composite
systems as shown in Table 4.3. It is worth emphasizing that for the Sic fiber-glass
matrix composites,
z,,,
values are very small relative to
L,,,
values, irrespective of
the fiber surface treatments and when compared to other epoxy matrix based
composites.
To
show clearly how and to what extent the parameter,
zmax,
varies with the
properties of the interface and the composite constituents,
a
simple fiber pull-out
model by Karbhari and Wilkins (1990) is chosen here. This model is developed
based on the assumption of a constant friction shear stress,
zfr,
in the context of the
shear strength criterion for interface debonding. In this model, the partial debond
stress may be written as
where the frictionless debond stress,
(TO,
is given by
(4.105)
(4.106)
Eq.
(4.106)
is essentially similar to the solution of the debond stress derived earlier
by Takaku and Arridge (1973). The above instability condition for the partial
debond stress of Eq. (4.105) gives a rather simple equation for
zmax
as
where
p4
is a complex function
of
o!
and
y,
and is given by
(4.107)
(4.108)
136
Engineered
interfaces
in
jiber reinforced composites
whose approximate solution for
b
>>
a
is identical to
/3,
given in Eq. (4.3). Eq.
(4.107) suggests that the ratio
of
the bond strength at the bonded region to that at
the debonded region,
q,/Zfr,
and the Young’s modulus ratio,
CL
=
Em/&
,
are key
material properties that determine
zmax and thus control the stability of the debond
process.
It
should be noted here that in the early work of Lawrence (1972), Laws
et al. (1973) and later Gopalaratnam and Shah (1987) the maximum debond stress is
found
to
be dependent on these properties.
Eq.
(4.107) has a limiting value
zmax
=
0
when
q,
N
zfr
and
y
N
0
in which the debond process becomes totally stable as in
some ceramic matrix composites (e.g. Sic fiber-glass matrix composites (Butler
et al., 1990)).
From the discussion presented above, it is clear that the stability
of
the debond
process can be evaluated by a single parameter,
zmax,
which is the shortest
(remaining) bond length needed to maintain the debond process stable, and is a
constant for a given composite system. Therefore, three different interface debond
processes are identified in the following: totally unstable, partially stable and totally
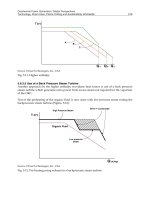
stable debond processes. The schematic plots of the applied stress versus
displacement curves are illustrated in Fig. 4.25 for these debond processes.
(i) If
L
<zmax,
the debond process is totally unstable and
the
initial debond leads
immediately
to
complete debonding (i.e.
GO
=
ni).
Therefore, the corresponding
stress-displacement curve shows a monotonic increase in stress until debonding is
initiated, followed by an instantaneous load drop (Fig. 4.25(a)). Totally unstable
debonding may also occur when the frictional resistance in the debonded region is
negligible (i.e. either zero residual clamping stress,
40, or negligible coefficient of
friction
p)
such that
zmaX
approaches an infinite value as can be envisaged from Eq.
(4.107).
However, this situation seems most unlikely to occur in practical
composites.
(ii)
If
L
>
z,,,,
which is the most common case where practical fiber pull-out tests
are performed, the stress increases linearly until debond initiates. Then, the debond
crack propagates in a macroscopically stable manner, leading to a non-linear
increase in the debond stress, though ‘stick-slips’ are normally observed in the rising
stress-displacement curve (Fig. 4.25(b)). Stable debonding proceeds until the
(4
(b)
(4
Fig.
4.25.
Schematic presentations
of
applied stress
versus
displacement
(0-6)
relationship in
fiber
pull-
out test: (a) totally unstable, (b) partially stable and
(c)
totally stable debond processes. After Kim et
al.
(1992).
Chapter
4.
Micromechanics
of
Stress
trunsfer
137
debond length reaches
e
=
L
-
z,,,,
followed by unstable debonding leading to
complete debonding. Therefore, this debond process is partially stable.
(iii)
In
the extreme case of
z,,,
value approaching zero, as in some ceramic matrix
composites, the debond process is always stable until complete debonding
independent of embedded fiber length,
L.
The rising portion of the debond stress
versus displacement curve (Fig.
4.25(c))
is typically linear without apparent ‘stick-
slips’ and there is no appreciable load drop after complete debonding (Bright et al.,
1991). This is because the interface is in principle frictionally bonded and there is
little chemical bonding. That is
Gi,,
or
Tb
is very small. Therefore, the linear increase
in stress represents primarily the frictional shear stress transfer across the interface
without virtual debonding until the frictional resistance over the entire embedded
fiber length is overcome. The maximum debond stress,
cri,
is then approximately
equal to the initial frictional pull-out stress,
qr,
because the frictionless debond
stress,
op,
is negligible (due to small
Gi,
or
Q,).
The concept of
z,,,
with regard to the issue of the stability of the debond process
has practical implications for real composites reinforced with short fibers. There is a
minimum fiber length required to maintain stable debonding and thus to achieve
maximum benefits of crack-tip bridging between fracture surfaces without the
danger of catastrophic failure. It should also be mentioned that in practical fiber
pull-out experiments the stability for interface debonding deviates significantly from
what has been discussed above, and is most often impaired by adverse testing
conditions (e.g. soft testing machine, long free fiber length, etc.). Therefore.
debonding could become unstable even for
L
>
z,,,
and in composites with
zmay
=
0. Moreover, when
L
is very short, as is the normal case in the microdebond
test, the precipitous load drop after complete debonding may be aggravated by the
release of the strain energy stored in the stretched fiber. The load drops to zero if the
fiber is completely pulled out from the matrix. Alternatively, if the fiber is regripped
by the clamping pressure exerted by the surrounding matrix material frictional pull-
out of the fiber is possible to resume.
Another important parameter related to the fiber length in the fiber pull-out test is
the maximum embedded fiber length,
L,,,,
above which the fiber breaks instead of
being completely debonded or pulled out.
L,,,
value for a given composite system
can be evaluated by equating
02
of Eq. (4.102) to the fiber tensile strength,
CJTS,
(which is measured on a gauge length identical to the embedded fiber length used in
fiber pull-out test), Le.,
(4.109)
where
(J[
is the crack tip debond stress determined for bond length
z,,,
=
(L
~
t).
L,,,
values calculated for a constant fiber tensile strength
CJTS
=
4.8,
1.97 and
2.3 GPa for carbon fiber, steel fiber and Sic fiber, respectively, are included in Table
4.3. These predictions are approximately the same as the experimental
L,,,
values,
e.g., the predictions for
L,,,
=
49.3 and 23.4 mm compare with experimental values
L,,,
=
5
1
.0 and 21.7 mm, respectively, for the untreated and acid treated Sic fibers
138
Engineered inlerfaces in Jiber reinforced composites
(Fig. 4.28). It is worth noting that the
L,,,
value decreases significantly when the
fiber surface is treated to improve the interfacial bonding (and thus the interface
fracture toughness,
Gic),
e.g. acid treated Sic fibers versus untreated fibers. This
observation is analogous to what is expected from the fiber fragmentation test of
single fiber composites: the stronger the interface bond the shorter is the fiber
fragment length at the critical stage (see Section 4.2).
4.3.5.
Characterization
of
interface properties
Microcomposite tests including fiber pull-out tests are aimed at generating useful
information regarding the interface quality in absolute terms, or at least in
comparative terms between different composite systems. In this regard, theoretical
models should provide a systematic means for data reduction to determine the
relevant properties with reasonable accuracy from the experimental results. The data
reduction scheme must not rely on the trial and error method. Although there are
several methods of micromechanical analysis available, little attempt in the past has
been put into providing such a means in a unified format.
A
systematic procedure is
presented here to generate the fiber pull-out parameters and ultimately the relevant
fiber-matrix interface properties.
In single fiber pull-out experiments, the most useful data that are readily obtained
from the load-deflection records are the maximum debond stress,
02,
and the initial
frictional pull-out stress,
ofr,
as
a function of L. If the debond process is carefully
monitored for a large embedded fiber length,
L,
the initial debond stress,
00,
can also
be determined directly in the average sense, depending on the composite system.
Most important properties to be calculated are the fracture toughness,
Gi,,
at the
bonded region, and the coefficient of friction,
p,
and the residual clamping stress,
40,
at the debonded region, by evaluating the pull-out parameters
of,
i
and
r~.
There are
several steps to be followed for this purpose.
(i) Firstly,
ofr
versus
L
data allow the initial slope at
L
=
0
to be determined based
on
Eq.
(4.103),
(4.110)
(ii) Secondly, the gradient can be taken from the linear region of the stress drop
Ao(=
02
-
ofr)
versus
L
plots for large
L
where the crack tip debond stress is
almost constant and independent of
L,
Le.,
d ln(Ao)
dL
A
,
where the difference between the stresses obtained immediately
the load instability is given by
Ao
=
o:
-
ofr
=
{of
+
Tj[exp(-;lz,,,)
-
11)
exp[-A(L
-
zmax)]
(4.111)
before and after
(4.112)
Chapter
4.
Micromechanics
of
stress
transfer
139
(iii) Thirdly, combining
Eqs.
(4.1 10) and (4.11 1) allows
2
and
8
(and thus
p
and
qo
from
Eqs.
(4.23) and (4.24)) to be determined. Alternatively, the asymptotic
debond stress,
5,
can be directly estimated at a long embedded length through
linear regression analysis of the maximum debond stress,
0;.
Once
;2.
and are
known,
Eq.
(4.102) may be used to evaluate the optimum value of
Gi,
(and also
for
zmax)
that would give the best fit to the
0;
versus
L
experimental results. In this
procedure theoretical values for the maximum debond stress,
o:,
have to be
obtained at instability. Alternatively, data for the initial debond stress,
GO,
versus
L,
if
available from experiments, can be directly evaluated to determine
Gi,
based
on the debond criterion of
Eq.
(4.99) for infinitesimal debond length. Application
of this procedure to obtain
Gic,
11
and
40
have been demonstrated in fiber pull-out
for several fiber composites materials (Kim et al., 1992, Zhou et al., 1993).
Having determined the relevant interface properties (Table 4.3), the maximal
debond stress,
a:, and the initial frictional pull-out stress,
ofr,
are compared with
experimental data in Figs. 4.26-4.28 for three different composite systems of carbon
fiber-epoxy matrix, steel fiber-epoxy matrix and Sic fiber-glass matrix. In general,
there is very good agreement between theories and experiments over the whole range
of the embedded fiber length,
L,
for all the composite systems considered. A new
methodology has also been proposed recently by Zhou et al. (1994) to determine
systematically the longest embedded fiber length for instability,
zmax,
without
iteration and curve fitting of
Eq.
(4.102).
4.3.6.
Multiple~fiber composite model
From the review of the theoretical studies of the fiber pull-out test as discussed in
Section 4.3.1, it is identified that most micromechanics theories are developed based
on a shear-lag model
of
single fiber composites where the cylindrical surface
of
the
matrix is invariably assumed to be stress free. Although this assumption is required
to obtain the final solutions in closed form for the stress distributions it often leads
to an unacceptably high applied stress required to initiate/propagate interface
debonding when the radial dimension of the matrix is similar to that
of
the fiber (Le.
for a high fiber volume fraction,
F),
This in turn implies that the application of the
conventional models to practical composites is limited to those with a very small
Vi
where any effects
of
interactions between neighboring fibers are completely
neglected. Therefore, a three-cylinder composite model is developed (Kim et al.,
1994b) to simulate the response of practical composites
of
large
vf
and thus to
accommodate the limitation of the shear-lag model of single fiber microcomposite
test properly. Both the micromechanics analysis and the
FE
method are employed
in parallel for fully bonded interface
to
validate the results obtained from each
model.
To
analyze the stress transfer in the fiber pull-out test
of
a multiple fiber
composite, the specimen is treated
as
a
three-cylinder composite (Zhou and Mai,
1992) where a fiber is located at the center of a coaxial shell of the matrix, which, in
turn, is surrounded by a trans-isotropic composite medium with an outer radius
B,
140
8
0
Engineered interfaces in fiber reinforced
eomposites
n
B
n
9
'
100
'
200
'
300
'
400
'
5bO
L
(pm)
Fig.
4.26.
Comparisons between experiments and theory
of
(a) maximum debond
stress,
c$,
and (b) initial
frictional pull-out stress
for
carbon fiber-epoxy matrix composites. After Kim et al. (1992).
as schematically illustrated in Fig.
4.29.
The radii of the fiber and matrix,
a
and
b,
are related to the fiber volume fraction
vf
=
a2/b2,
which
is
the same as that
of
the
composite medium. When the fiber is subjected to an external stress,
0,
at the loaded
end
(z
=
0)
while the matrix and composite medium are fixed at the embedded end
(z
=
L),
stress transfers from the fiber
to
the matrix and in turn from the matrix to
the composite medium via the
IFSSs,
zi(a,z)
and
zi(b,z),
respectively. For the
cylindrical coordinates
of
the three-cylinder composite, the basic governing
equations are essentially the same as those for the single fiber composite. However,
the equilibrium equations between the external and the internal stresses have to be
modified to take into account the presence
of
the composite medium.
Eq.
(4.87)
is
now replaced by:
141
(4
0.8
0.6
s
a
0.4
0.2
b
n
t
r
/
I
I
I.
I. I.
I.
Fig.
4.27.
Comparisons between experiments and theory
of
(a) maximum debond stress,
cri,
and (b) initial
frictional pull-out stress for steel fiber-epoxy matrix composites:
(0)
uncoated fibers;
(0)
release agent
coated fibers. After Kim et al.
(1992).
1
1
0
=
@z)
+,a;,(z)
+-<(z)
,
(4.1
13)
1
vi1
1
(4.114)
where
y,
=
b2/(B2
-
b2),
and
B
is the outer radius
of
the composite medium. The
subscript c refers
to
the composite medium. In addition to
Eq.
(4.12) for the
relationship between
FAS
and
IFSS,
equilibrium between
IFSSs
and
MAS
requires
142
Engineered interfaces in jiber reinforced composites
n
3
n
m
(3'2
1
n
t
"0
10
20
30
40
50
60
(b)
L
(mm)
Fig. 4.28. Comparisons between experiments and theory
of
(a) maximum debond stress,
CJ:,
and
(b)
initial
frictional pull-out stress
for
Sic fiber-glass matrix composites:
(0)
untreated fibers;
(0)
acid treated
fibers.
After Kim et al.
(1992).
(4.115)
Based on Lame's solution, the relationship between the
IFSSs
is taken as
q(b,z)
=-Ti(.,.)
by2
,
(4.116)
where
y2
=
a2/(B2
-
a2).
The additional radial stress,
q2(arz),
acting at the fiber-
matrix interface, which is caused by Poisson contraction
of
the fiber when subjected
UYl
Chapter
4.
Micromechanics
of
stress transfer
I43
Fig.
4.29.
Schematic illustration
of
fiber pull-out test on a three cylinder composite. After Kim et al.
(l994b).
to an axial tension, is obtained from the continuity
of
tangential strain at the
interface
(4.117)
where
cq
=
E,/Ec and
kl
=
1
+
2y
-
v,
+
a1
(1
+
2yl
+
vc).
Eq.
(4.1 17) replaces
ql
(a,
z)
given by
Eq.
(4.18) applied for the single fiber composite model. Combining
Eqs.
(4.12) and (4.1 13) to (4.117) yields a differential equation for the
FAS
(4.118)
The coefficients
A3
and
A4
are complex functions of the elastic properties and
geometric factors of the constituents and are given in Appendix
D. The solution for
Eq.
(4.1
18)
is subjcctcd to the following boundary conditions assuming an
unbonded cross-section of the embedded fiber end
rq0)
=
0,
cr',(L)
=
0
.
(4.1 19)
Therefore, the solutions for the
FAS,
MAS,
MSS
and
IFSSs
normalized with the
applied stress
0,
are obtained:
@+
1)
sinh[fi(L
-z)]
+%sinh(&z)
d
sinh
(&L)
A3
'
$(z)
-
144
Engineered interfaces
in
fiber reinforced composites
@+
1)
sinh[&(L-z)] +2sinh(&z)
sinh
(&L)
-
Y2
1
Finite element analysis (FEA) is also developed in parallel to validate the results
generated from the micromechanical model. Both the composites containing single
and multiple fibers are considered for the present FEA. The geometry, the loading
method and the boundary conditions are selected to represent those of the actual
experimental technique for both the single and multiple fiber composites, as
illustrated in Fig. 4.30, which are analogous to those used in the corresponding
micromechanics analyses. For the axi-symmetric loading geometry of a two
dimensional model, a uniformly distributed constant stress,
~s
=
100
MPa, is applied
to the partially embedded fiber at the surface
(z
=
0).
The boundary conditions are
imposed such that the bottom surfaces of the matrix and composite medium are
fixed at z
=
2L, and the axis of symmetry
(r
=
0)
is fixed where there is no
displacement taking place.
Specific results are calculated for Sic fiber-glass matrix composites with the
elastic constants given in Table 4.1. A constant embedded fiber length
L
=
2.0 mm,
and constant radii
a
=
0.2mm and
B
=
2.0mm are considered with varying matrix
radius
b.
The stress distributions along the axial direction shown in Fig. 4.31 are
predicted based on micromechanics analysis, which are essentially similar
to
those
obtained
by
FE
analysis for the two extremes
of
fiber volume fraction, fi, shown in
Fig. 4.32. The corresponding FAS distribution calculated based on Eqs. (4.90) and
(4.120), and IFSS at the fiber-matrix interface of
Eqs.
(4.93) and (4.132) are plotted
along the axial direction in Fig. 4.32.
The three-cylinder composite model predicts that both the FAS and IFSS
decrease from a maximum near the loaded fiber end towards zero at the embedded
fiber end. Increase in
fi (and the equivalent improvement of stiffness in the
composite medium) increases slightly both the maximum IFSS and the stress
gradient, without changing the general trend of the stress fields. For small
fi, stress
distributions in the single fiber composite model are equivalent to those
of
the three-
cylinder model. In sharp contrast, the stress fields change drastically in the single
fiber composite model when
vf
is large. The FAS values in the central portion of the
fiber are approximately constant and do not diminish to zero at the embedded fiber
end. More importantly, the IFSS displays two peaks at the ends of the fiber, the one
at the embedded end being increasingly greater than the other at the loaded end with
Chapter
4.
Micromechanics of stress transfer
145
-
Fiber
Fiber
Matrix
Composite
medium
Fig.
4.30.
Schematic illustrations
of
the
finite element models
of
(a) single
fiber
pull-out specimen and
(b)
a three cylinder composite.
After
Kim
et
al.
(1994b).
increasing
6.
It is also interesting to note that the single fiber composite model
predicts that the IFSS obtained at the loaded end remains almost constant
regardless of
6.
The pronounced effect of fiber
6
is further manifested in Figs.
4.33
and
4.34,
where the characteristic IFSS values obtained at the ends of the fiber are plotted as a
function of
6
for the micromechanics and FE analyses, respectively. It is clearly
demonstrated for the three- cylinder model that these stresses vary only marginally
with
6,
and the magnitude of IFSS at the loaded end is always greater than that at
the embedded fiber end. This ensures that when the fiber is loaded continuously,
debonding is always expected to initiate at the loaded fiber end for all
6,
if the shear
strength criterion is employed for the interface debonding. However, for the single
fiber composite model, IFSS at the embedded fiber end increases rapidly whereas
that obtained at the loaded fiber end either remains almost constant (Fig.
4.33)
or
decreases with increasing
6
(Fig.
4.34).
Therefore, there is a critical fiber volume
fraction above which the maximum IFSS at the embedded end exceeds that of the
loaded end, allowing debond initiation from the embedded fiber end in preference to
146
Engineered
interfaces
in fiber reinforced composites
1.2
1
z
5
0.4
3
5
0.2
a
a,
CI
C
-
'0
0.2
0.4
0.6
0.8
1
(b)
Axial
distance,
z/L
Fig.
4.31.
Distributions of (a)
fiber
axial stress and
(b)
interface shear stress along the axial direction
obtained from micromechanics analysis for different
fiber
volume fractions,
V,
=
0.03,
0.3
and
0.6:
( )
single fiber composite;
(-)
three cylinder composite model. After Kim et al.
(1994b).
the loaded fiber end. The critical fiber volume fractions
vf
M
0.15
and
0.26
are
estimated from the superimposed curves of the data points in Figs.
4.33
and
4.34,
respectively.
One
of
the major differences between the results obtained from the micro-
mechanics and
FE
analyses is the relative magnitude of the stress concentrations. In
particular, the maximum
IFSS
values at the loaded and embedded fiber ends tend to
be higher for the micromechanics analysis than for the
FEA
for a large
vf.
This
gives
a slightly lower critical
vf
required for the transition of debond initiation in the
micromechanics model than in the
FE
model of single fiber composites. All these
Chapter 4.
Micromechanics
of
stress transfer
lm2
I
1
0.8
tn
tn
tn
-
-#
0.6
5
0.4
n
0.2
0
LL
0
0.2
0.4
0.6
0.8
1.0
147
"
0
0.2
0.4
0.6
0.8
1.0
(b)
Axial distance,
z/L
Fig. 4.32. Distributions of (a) fiber axial stress and (b) interface shear stress along the axial direction
obtained
from
FEM
calculations for two fiber volume fraction,
V,
=
0.03 and
0.6.
Symbols as in Fig. 4.3
1.
After Kim et
al.
(1994b).
observations appear to be associated with the slightly different boundary conditions
used in these models.
4.3.7.
Two-M1ay
debonding phenomenon
In the light
of
the discussion presented in Section
4.3.6,
it is seen that the
surrounding composite medium in the three-cylinder composite model acts as a stiff
annulus to suppress the development
of
IFSS
at the embedded fiber end by
constraining the radial boundary
of
the matrix cylinder. This ensures that regardless
148
0,3
-
v)
cn
.c,
E)
2
a
0.2-
a,
c
v)
Q,
't
c,
a,
C
8
0.1
-
-
Engineered
interfaces
in
fiber reinforced composites
/"
/
Loaded
end
/
*A
-&-A
PA4
/
\
/
-\
/
-0
,A
a
~
0
,O's
Embedded end
-a
2
3g-A-
A-Ap
J
0.2
0.4
C
Fiber
volume
fraction,
Vf
Fig.
4.33.
Interface shear stresses as a function of fiber volume fraction,
5,
obtained from
micromechanics analysis. Symbols as in Fig.
4.31.
After Kim et al.
(1994b).
of
V,
the maximal
IFSS
always occurs at the loaded fiber end where the interface
debond initiates and grows inward. The maximum
IFSS
tends
to
increase slightly
with increasing
6,
allowing debond initiation at a low external stress.
In contrast, the single fiber composite model predicts that the
IFSS
concentration
becomes higher at the embedded end than at the loaded end if fiber
vf
is greater than
a
critical value, suggesting the possibility
of
debond initiation
at
the embedded fiber
Chapter
4.
Micromechanics
ef
stress transfer
I49
end in
a
so-called ‘two-way debonding’ phenomenon. This phenomenon, peculiar
to
the single fiber composite model as introduced in Section 4.3.1, has been studied
theoretically (Banbaji, 1988; Leung and Li, 1991, Hsueh, 1993; Hsueh and Becher,
1993) as well as experimentally for a relatively stiff fiber embedded in a soft matrix
(e.g. polyurethane matrix (Betz, 1982) and silicone resin (Gent and Liu, 1991)
reinforced with glass rods), which can satisfy the criterion given by
Eq.
(4.124).
The criterion for debond initiation at the embedded end in preference to the
loaded end
is
derived based on the shear strength criterion
(i.e.
z,(u,O)
<
zi(a,L)
in
Eq.
(4.93))
1
-
2kvf
>
’
1
-
2kv,
(4.124)
Eq.
(4.124) is essentially the same as those previously developed based on the shear
strength criterion (Leung and Li, 1991; Hsueh, 1993), and is found independent of
embedded fiber length,
L,
and insensitive to both
vf
and
v,.
This means that the
relative magnitudes of fiber volume ratio,
y(=
a2/(b2
-
a2)),
and Young’s modulus
ratio,
a(=
E,/Ef),
control the two-way debonding phenomenon in a single fiber
pull-out test.
A
plot of
y
as a function of
a
based on
Eq.
(4.124) is shown in Fig. 4.35
where a comparison is made with the predictions by Leung and Li (1991) and Hsueh
(1993).
The results presented in Section 4.3.6 suggest that the shear lag models based on a
single fiber composite
is
inadequate for modelling
a
composite with a high fiber
6.
From the experimental viewpoint, to measure the relevant fiber-matrix interface
properties, the fiber volume fraction in single fiber pull-out tests
is
always very low
(i.e.
6
<
0.01). This effectively means that testing with these specimens has the
2
3
4
Radius
ratio,
b/a
Fig.
4.35.
The
relationship between Young’s modulus ratio,
Er/E,,,,
and radius ratio,
b/a,
showing the
criterion
for
debonding initiation at embedded fiber end
or
loaded fiber end.
150
Engineered interfaces
in
$her reinforced composites
fundamental limitation of generating interface properties only valid in the
comparative sense for given conditions that seldom represent those of practical
composites of large fiber
6.
In this regard, the use of multiple fiber composite
specimens (made from real composites or from model composites with a regular
fiber arrangement for the surrounding composite medium) can eliminate such a
limitation of the single fiber pull-out test. Details of the experimental technique have
yet to be developed although significant difficulties are envisaged in specimen
preparation with the current technology. In fact, the micro-bundle pull-out test has
recently been devised (Qiu and Schwartz, 1991), although still in its early stage of
development, to account for the high fiber volume fraction of real composites.
4.4.
Fiber
push-out
4.4.1.
Solutions for
stress
distributions
Many investigators have studied the micromechanics analyses of fiber push-out,
notably Bright et al. (1989, 1991), Hsueh (1990b, c), Keran and Parthasarathy
(1991), Lau and Mai (1990, 1991), Marshall (1992), Marshall and Oliver (1987,
1990), Shetty (1988), Singh and Sutcu (1991), Liang and Hutchinson (1993), and
more recently Zhou and Mai (1995). Among these, Keran and Parthasarathy (1991),
Marshall (1992) and Liang and Hutchinson (1993) took into account the effects of
the axial residual stresses in the fiber in addition
to
the residual radial stresses across
the interface, both of which are caused by the matrix shrinkage during the
processing of the composite. The influence of redistribution of residual stress due to
slicing the composite in preparation of the specimen (Liang and Hutchinson, 1993)
is also specifically addressed. The effects of fiber surface roughness on push-out have
also been analysed by Liu et al. (1995). Numerical analysis based on the finite
element method (Grande et al., 1988; Tsai et al., 1990; Chen and Young, 1991;
Kallas, 1992; Meda et al., 1993; Mital et al., 1993; Ananth and Chandra, 1995;
Chandra and Ananth, 1995; Majumda and Miracle, 1996;
Ho
and Drzal, 1996) is
also becoming increasingly popular with this loading geometry. Similar to the
microbundle pull-out test a fiber bundle push-out test has also been proposed for
CMCs
and a theoretical analysis has been given recently by Zhou and Mai (1994).
However, some theoretical treatment considers only the special case
of
friction
sliding of a single fiber along a mechanically bonded interface, particularly for some
ceramic matrix composites, where the Coulomb friction law applies. See for example
Zhou and Mai (1995) and Shetty (1988). Assuming a constant friction at the fiber-
matrix interface and neglecting the Poisson effects, Shetty (1988) reported a simple
force balance equation for the frictional shear strength,
qr
Tfr
=
-Wo
.
(4.125)
qo
is determined from the data for the maximal frictional push-out stress,
qr,
when
the sliding length reaches the entire embedded fiber length (i.e.
e
=
L).
qr
is given by
Chapter
4.
Micrumechanic.s
of
stress transjer
151
(4.126)
where
k5
=
cqvf/(
1
+
vm),
which is an approximate form of
t :
coefficient
k
given in
Section
4.2.3.
There are many features in the analysis of the fiber push-out test which are similar
to fiber pull-out. Typically, the conditions for interfacial debonding are formulated
based on the two distinct approaches, i.e., the shear strength criterion and the
fracture mechanics approach. The fiber push-out test can be analyzed in exactly the
same way as the fiber pull-out test using the shear lag model with some
modifications. These include the change in the sign
of
the
IFSS
and the increase
in the interfacial radial stress,
ql(a,z),
which is positive in fiber push-out due to
expansion of the fiber. These modifications are required as a result
of
the change in
the dircction
of
the external stress from tension in fiber pull-out to compression in
fiber push-out.
For the cylindrical coordinates
of
the fiber push-out model shown in Fig. 4.36
where the external (compressive) stress is conveniently regarded as positive, the basic
governing equations and the equilibrium equations are essentially the same as the
fiber pull-out test. The only exceptions are the equilibrium condition of Eq.
(4.15)
and the relation between the
IFSS
and the resultant interfacial radial stress given by
Eq. (4.29), which are now replaced by:
2b
Fig.
4.36.
Schematic drawing
of
the
partially
debonded
fiber
in
fiber
push-out
test.
152
Engineered interfaces in jiber reinforced composites
(4.127)
In the same procedure as that employed for the fiber pull-out test, the solutions for
stress distributions are obtained in the bonded region, which are exactly the same as
those given in
Eqs.
(4.90k(4.92). The solutions for the stress distributions in the
debonded regions are:
af(z)
=
a
-
~(8
+
a)[l
-
exp(-h)]
,
(4.129)
of.,(.)
=
yo(^+
a)[l
-
exp(-h)]
,
(4.130)
(4.13
1)
(4.132)
In these equations, the crack tip debond stress,
ce,
at the boundary between the
bonded and debonded regions is given by
ae=o-o(a+a)[l
-exp(-H)] . (4.133)
Fig. 4.37 illustrates the approximate stress fields in the composite constituents along
the axial direction which are generally very much similar to those
of
the fiber pull-
out test (Fig.
4.22), except for the IFSS in the debonded region. The rising portion of
the IFSS towards the free fiber end reflects the radial expansion of the fiber undcr
compression due to the Poisson effect. The increase in the radial compressive stress
discourages debond propagation in fiber push-out. This response is in sharp contrast
to the radial contraction of the fiber which effectively encourages further debonding
in fiber pull-out test. More details
of
the differences in the stress distributions and
the debond processes between the two loading geometries are discussed in Section
4.5.3.
4.4.2.
Debond criterion and dehond stresses
Based on the same energy balance theory
as
employed for the fiber pull-out, a
fiber-matrix interface debond criterion is derived for fiber push-out in
a
form similar
to that for fiber pull-out
2naGi,
=
B202
-
Cz(5
+
a)a
+
D2(8
+
a)2
,
(4.134)
where the coefficients
B2,
C2
and
02
are related to
BI,
Cland
D1
(see Appendix
A)
by
changing the sign for
p
(or
2)
due to the change in the direction of loading:
Chapter
4.
Micromechanics
of
stress transfer
153
Fig.
4.37.
Distributions
of
(a) fiber axial stress,
cf,,
(b) matrix axial stress,
d,.
and (c) interface shear stress.
~i.
along the embedded fiber length In fiber push-out. After
Kim
et al. (1994~).
Therefore, once the external stress for debond propagation is obtained, the partial
debond
stress,
nz,
can be determined as
=
Q
+
(a
+
Oe)[exp(U)
-
11
.
(4.136)
Similarly, the initial debond stress,
00,
is obtained for the infinitesimal debond
length, the maximum debond stress,
o;,
at the instability where the debond length
becomes
e=
L
-
zmax
and the post-debond initial friction
pull-out
stress,
Ofr,
at
e
=
L:
O{
1
-
exp[-i(L
-
zmax)]}
1
-
O{
1
-
exp[-%(L
-
zmax)]}
0;
=
bp
+
(8
+
Oe)
(4.137)
154
Engineered interfaces in
Jiber
reinforced composites
w[l
-
exp(-fi)]
1
-
w[l
-
exp(-fi)]
Ofr
=
a
E
a[exp(fi)
-
I]
.
(4.138)
One can easily note that Eq. (4.138) is similar to the solution given by Eq.
(4.126), which is derived from the assumption of a constant friction and complete
neglect of the Poisson expansion. The solution for
zmax,
which is the shortest
bond length required to maintain a stable debonding process, is obtained from
Eq. (4.137)
(4.139)
4.4.3.
Comparisons between fiber pull-out
and
fiber push-out
When comparing with the solution given in
Eq.
(4.100) for partial debond stress
in fiber pull-out, it is noted that Eq. (4.133) is similar in that it is composed of two
stress components: a crack tip debond stress,
at,
which is a function of the
interfacial fracture toughness,
Gi,,
and the debond length,
I,
relative to
L;
a friction
stress component which is proportional to
(a
+
.e)
and is controlled by
1.
There are
also differences between fiber pull-out and fiber push-out particularly in the
magnitude of debond stresses. To illustrate these functional similarities and
differences in the failure processes between the two loading geometry, specific
results are calculated (Zhou et al., 1992b) for the composite systems studied in the
previous sections. From the plots of partial debond stress,
a:,
as a function of
debond length,
I,
as shown in Fig. 4.38, the rate of stress increase (or decrease) is
found to be slightly larger in fiber push-out than in fiber pull-out, although the
functional relationship between
01;
and
I
is basically similar for a given embedded
fiber length,
L.
Therefore, for a given
L,
larger stresses
00
and
0;
are required for
debond crack initiation and propagation in fiber push-out than in fiber pull-out as
shown in Fig. 4.39.
All these results are apparently associated with the difference in the friction stress
component in the debonded region. In fiber push-out, the Poisson expansion of the
fiber under axial compression generates radial compressive stresses across the
interface, while the fiber is contracted radially in fiber pull-out. These stresses
balance the existing residual clamping stress,
40,
controlling further debond
propagation. This conclusion is further manifested in Fig. 4.40 where the difference
in IFSS distribution is clearly illustrated, in the debonded region in particular,
between the two loading geometry.
To evaluate the stability of the debond process, the instability parameter,
zmax,
is
compared.
zmax
values calculated based on Eqs. (4.104) and (4.139) respectively for
fiber pull-out and fiber push-out give
z,,,
=
6.5,
6.2 mm for coated steel wire-epoxy
matrix and
z,,,
=
0.5,
0.49 mm for the untreated Sic-fiber-glass matrix composite
.;a
a
s2
bu
n
Chapter
4.
Micromechanics
of
stress transfer
0.5
0.4
0.3
0.2
0.1
L=Gmm
n
I I I
1
,
155
L=5.mm
_
,.
0.6
c
,.
,
systems.
zmax
is only marginally greater for fiber pull-out than fiber push-out, the
difference being almost negligible
for
the latter composite, which
is
typical
of
frictional bonding at the interface. Considering the observation that
zmax
is
determined mainly by the material properties
such
as
q,/qr
and
E,/'Ef,
this result
confirms that the differences in the debond stresses between the two loading
geometry arise mainly from the Poisson effects at the debonded interface, which are
distinct in each loading.
156
Engineered interfaces
in
jiber reinforced composites
"0
Fig. 4.39. Comparisons of initial debond stress,
uo,
and maximum debond stress,
ai,
between fiber pull-
out and fiber push-out as a function
of
embedded fiber length,
L,
for
(a)
release agent coated steel fiber-
epoxy matrix composites and (b) untreated Sic fiber-glass matrix composites. After Kim et
al.
(1994~).
4.5.
Cyclic loading in
fiber
pull-out and
fiber
push-out
4.5.1.
Introduction
The analytical solutions derived in Sections 4.3 and 4.4 for the stress distributions
in the monotonic fiber pull-out and fiber push-out loadings are further extended to
cyclic loading (Zhou et al., 1993) and the progressive damage processes
of
the
interface are characterized. It is assumed that the cyclic fatigue of uniform stress
amplitude causes the frictional properties at the debonded interface
to
degrade
Chapter
4.
Micromechanics
of
stress
transfer
80
I
157
0-
0
0.1
0.2
0.3
0.4
0.5
0.6
L-z
(mm)
Fig.
4.40.
Distributions
of
interface shear stress,
q,
along the fiber length at a constant applied stress
u
=
4.0GPa
for carbon fiber-epoxy matrix composites in fiber pull-out and fibcr push-out.
After
Kim
et al.
(1994~).
gradually through wearing out or smoothing of the fiber surface roughness due to
abrasions under repeated loading and unloading. Experimental evidence on some
ceramic matrix composites containing SCS-6 Sic fibers (Jero and Keran, 1990; Jero
et al., 1991; Carter et al., 1991; Waren et al., 1992; Mackin et al., 1992a) and
sapphire fibers (Mackin et al., 1992b) has shown that the roughness interaction
contributes significantly to the interfacial clamping stress, as mentioned in Section
4.3.1. Frictional resistance is reduced when a fiber predisplaced in pull-out (or in
push-out), is then forced back to its original position, due probably to the fiber re-
seating in the matrix socket where the fiber surface roughness matches that
of
the
matrix Mode
I
fatigue tests
on
a meta-stable p-titanium alloy reinforced with
unidirectional
SCS-6
Sic fibers also strongly indicate that degradation of the
interface properties allows large debonding and sliding.
Fatigue tests can be conducted on the same single fiber-matrix cylinder model as
used for monotonic pull-out and push-out tests.
A
simple alternating tensile (or
compressive) stress
of
magnitude
Ao
(=
omax
-
omin
where
omin
=
0)
is applied
repeatedly to the fiber for each loading geometry, as schematically shown in Fig.
4.41. It is assumed here that the smoothed fiber surface due to repeated abrasion
eventually leads to a reduction in the frictional shear stress at the interface, which is
cquivalcnt to a dccrcasc in the cocfficicnt
of
friction
p.
Bascd on the thcorctical
results, a simple experimental method is proposed to evaluate the frictional
degradation of the interface.
4.5.2.
Relative displacements and degradation function
Degradation of frictional resistance at the debonded interface
will
cause the
relative axial displacement between fiber and matrix to increase gradually. There are
158
Engineered interfaces in fiber reinforced composites
(a)
(b)
Fig.
4.41.
Schematic drawings of loading and unloading
processes
measuring the relative displacements
6
and
6,
in (a) fiber
pull-out
and (b) fiber push-out models under cyclic loading. After
Zhou
et al. (1993).
two types
of
relative displacements of particular interest in this analysis: one
occurring under load,
6,
and the other after unloading, with the latter being the
residual relative displacement,
6,
(Fig.
4.42).
For the perfectly elastic fiber and
matrix materials, the relative displacement measured at the loaded fiber end
is
equal
to the sum of the relative strain over the debonded interface since the displacements
in the fiber and matrix are identical in the bonded region. Thus,
1
0.9
y
0.8
0.7
0.6
0.5
0
1
0
0.2
0.4
0.6
0.8
1
N/N
f
Fig.
4.42.
Plots of normalized coefficient of
friction,
p/b.
versus normalized elapsed cycles,
N/Nf,
for
different exponent
n.
After
Zhou
et al.
(1993).