Engineered Interfaces in Fiber Reinforced Composites Part 3 ppt
Bạn đang xem bản rút gọn của tài liệu. Xem và tải ngay bản đầy đủ của tài liệu tại đây (719.64 KB, 30 trang )
44
Engineered interfaces in jber reinforced composites
3.2.
The mechanical properties of fiber-matrix interfaces
3.2.1.
Introduction
Test methods using microcomposites include the single fiber compression test, the
fiber fragmentation test, the
fiber
pull-out test, the fiber push-out (or indentation)
test and the slice compression test. These tests have a variety of specimen geometries
and scales involved. In these tests, the bond quality at the fiber-matrix interface is
measured in terms of the interface fracture toughness,
Gi,,
or the interface shear
(bond) strength (IFSS),
Zb,
for the bonded interface; and the interface frictional
strength
(IFS),
qr,
which is a function of the coefficient of friction,
1.1,
and residual
fiber clamping stress,
40,
for the debonded interface. Therefore, these tests are
considered
to
provide direct measurements of interface properties relative to the test
methods based on bulk composite specimens.
Microcomposite tests have been used successfully to compare composites
containing fibers with different prior surface treatment and to distinguish the
interface-related failure mechanisms. However, all of these tests can hardly
be
regarded as providing absolute values for these interface properties even after more
than 30 years of development of these testing techniques. This is in part supported
by
the incredibly large data scatter that
is
discussed in Section 3.2.6.
3.2.2.
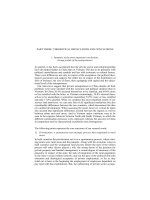
Single jiber compression test
The single fiber compression test is one of the earliest test methods developed
based on microcomposites to measure the bond strength of glass fibers with
transparent polymer matrices (Mooney and McGarry, 1965).
Two different types of
specimen geometry are used depending on the modes of failure that occur at the
fiber-matrix interface: one has a long hexahedral shape with a uniform cross-section
(Fig 3.1(a)); the other has a curved neck in the middle (Fig 3.1(b)). When the
parallel-sided specimen is loaded in longitudinal compression, shear stresses are
generated near the fiber ends as a result of the difference
in
elastic properties
between the fiber and the matrix, in a manner similar to the stress state occurring in
uniaxial tension. Further loading eventually causes the debond crack to initiate from
these regions due
to
the interface shear stress concentration (Le., shear debonding).
The curved-neck specimen under longitudinal compression causes interface
debonding
to
take place in the transverse direction @e. tensile debonding) due to
the transverse expansion
of
the matrix when its Poisson ratio is greater than that of
the fiber. The equations used to calculate the interface bond strengths in shear,
Tb,
and under tension,
Qb,
are (Broutman, 1969):
Chapter
3.
Measurements of interface/interlaminar properties
45
Fig.
3.
I.
Single
fiber
compressive
tests
with
(a) parallel-sided and
(b)
curved-neck specimen
for shear debonding in the parallel-sided specimen and for tensile debonding in the
curved-neck specimen, respectively.
CTN
is the net compressive stress at the smallest
cross-section obtained upon interface debonding.
a
=
Ern/&
is Young’s moduli
ratio
of
the matrix to the fiber, and
vf
and
v,
are Poisson ratios
of
the fiber and
matrix, respectively. The constant
2.5
in Eq.
(3.1)
is taken from the empirically
measured shear stress concentration factor.
The single fiber compression test has not been as popular as other microcomposite
tests because of the problems associated with specimen preparation and visual
detection of the onset of interfacial debonding. To be able to obtain accurate
reproducible results, the fibers have to be accurately aligned. With time, this test
method became obsolete, but it has provided a sound basis for further development
of
other testing techniques using similar single fiber microcomposite geometry.
3.2.3.
Fiber
fragmentation
test
The fiber fragmentation test is at present one
of
the most popular methods to
evaluate the interface properties of fiber-matrix composites. Although the loading
geometry employed in the test method closely resembles composite components that
have been subjected to uniaxial tension, the mechanics required
to
determine the
interface properties are the least understood.
This test is developed from the early work of Kelly and Tyson
(1965)
who
investigated brittle tungsten fibers that broke into multiple segments in a copper
matrix composite. Here a dog-bone shaped specimen is prepared such that a single
fiber
of
finite length is embedded entirely in the middle of a matrix (Fig
3.2(a)).
The
failure strain of the matrix material must be significantly (Le., ideally at least three
times) greater than that of the fiber to avoid premature failure of the specimen due
to fiber breakage. When the specimen is snbjected to axial tension (or occasionally in
compression (Boll et al.,
1990)), the embedded fiber breaks into increasingly smaller
46
Engineered interfaces
in
fiber reinforced composites
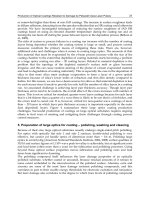
Fig.
3.2.
(a) Dog-bone shape fiber fragmentation test specimen; (b)
fiber
fragmentation under
progressively increasing load from
(i)
to (iii) with corresponding fiber axial stress
c$
profile.
segments at locations where the fiber axial stress reaches its tensile strength. Further
stressing of the specimen results in the repetition of this fragmentation process until
all fiber lengths are too short to allow its tensile stress to cause more fiber breakage.
Fig 3.2 (b) illustrates the fiber fragmentation process under progressively increasing
stress and the corresponding fiber axial stress profile,
6,
along the axial direction.
The shear stress at the fiber-matrix interface is assumed here to be constant along
the short fiber length.
The fiber fragment length can be measured using a conventional optical
microscope for transparent matrix composites, notably those containing thermoset
polymer matrices. The photoelastic technique along with polarized optical micros-
copy allows the spatial distribution
of
stresses to be evaluated in the matrix around
the fiber and near its broken ends.
Acoustic emission (Netravali et al., 1989a,b,c 1991; Vautey and Favre, 1990;
Manor and Clough, 1992; Roman and Aharonov, 1992)
is
another useful techniqL,
to
monitor the number of fiber breaks during the test, particularly for non-
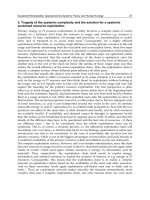
transparent matrix materials. Fig 3.3 shows
a
typical loaddisplacement curve of a
carbon fiber-polyetheretherketone
(PEEK)
matrix composite sample with the
corresponding acoustic emissions. Other techniques have also been used
to
obtain
the fiber fragments after loading to a sufficient strain: the matrix material can be
dissolved chemically or burned
off,
or the specimen can be polished to expose the
broken fragments (Yang et al. 1991).
Chapter
3.
Measurements
of
interfacelinterlaminar properties
47
HI‘/
by
=
92.6MPa
End
of fragmentation
Acoustic
emission
events
1,
I
I
(b)
75
fiber
ruptures
Fig.
3.3.
(a) Typical load4isplacement curve and (b) acoustic emission events for a
fiber
fragmentation
test on an AS4 carbon fiber-PEEK matrix composite. After Vautey and Favre
(1990).
The average value of fiber fragment lengths obtained at the end of the test when
the application of stress does not cause any further fiber fragmentation is referred to
as the ‘critical transfer length’,
(2L),.
The critical transfer length represents the
complex tensile fracture characteristics of brittle fibers and the statistical distribu-
tion of fiber fragment lengths. Typical plots of the mean fragment length versus fiber
stress are shown in Fig 3.4 for carbon fiber-epoxy and Kevlar 49-epoxy systems. It
is interesting to note that the idea of the critical transfer length was originally
derived from the concept of maximum embedded fiber length,
Lmax,
above which the
fiber breaks without being completely pulled out in the fiber pull-out test, rather
than in the fiber fragmentation test.
In
an earlier paper by Kelly and Tyson (1965),
(2L),
for the composite with a frictionally bonded interface is defined as twice the
longest embedded fiber length that can be pulled out without fracture, i.e.
(2L),
=
2Lm,,.
The solution of
L,,,
as a function of the characteristic fiber stresses
and the properties of composite constituents and its practical implications are
discussed in Chapter 4.
For analytical purposes, the critical transfer length
is
also defined as the fiber
length necessary to build up a maximum stress (or strain) equivalent to 97% of that
for an infinitely long fiber (Whitney and Drzal 1987). In this case, the knowledge of
the critical transfer length is related principally to the efficient reinforcement effect
by the fiber. (Compare this value with
90%
of that for an infinitely long fiber for the
definition of “ineffective length” (Rosen, 1964; Zweben,
1968;
Leng and Courtney,
1990; Beltzer et al.,
1992).)
The average shear strength at the interface,
z,,
whether bonded, debonded or if
the surrounding matrix material
is
yielded, whichever occurs first, can be
approximately estimated from a simple force balance equation for a constant
interface shear stress (Kelly and Tyson,
1965):
48
Engineered
interfaces
in
fiber reinforced
composites
41
7
7.5
0
-2
a
11,.,1 1
8.5
9
9.5
IO
(a)
Ln(Fiber
axial
stress,
MPa)
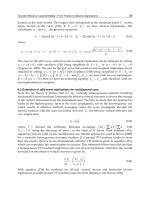
Fig.
3.4.
Ln-Ln plot of fiber fragment length
as
a
function of fiber stress
(a) for
Kevlar
29
fiber-epoxy
matrix composite and (b)
for
a carbon fiber-epoxy matrix composite. Yabin et
al.
(1991).
where
of"
is
the average fiber tensile strength and
a,
the fiber radius.
A
non-
dimensional correction factor
x
has been introduced later to take into account the
statistical distribution
of
tensile strength and fragment length of the fiber
where
CTTS
is
fiber tensile strength at the critical transfer length. It is noted that
x
=
0.75
(Ohsawa et al.,
1978,
Wimolkiatisak and Bell,
1989)
is taken as a mean
value if the fiber fragment lengths are assumed to vary uniformly between
(L)c
and
(2L),.
In
a
statistical evaluation of fiber fragment lengths and fiber strength, Drzal
et al.
(1980)
expressed the coefficient
in
terms of the gamma function,
r,
and
Weibull modulus,
m,
of
the strength distribution
of
a fiber of length,
I,
as
Chapter
3.
Measurements
of
interfacelinterlaminar properties
49
x=~i
.
[
:I
TI
l-uduuL
‘5
8 8.5
9
9.5
1
Idfiber
axial
stress,
MPa)
Fig.
3.4.(b)
(3-5)
In a more vigorous analysis based on the Monte Carlo simulation approach,
x
is
obtained in a more complicated way (Henstenburg and Phoenix, 1989; Netravali
et al., 1989a,b)
x
=
[;
(31
l+”m/r(l
+
l/m)
,
where
l/lo
refers to the non-dimensional mean fiber length, ranging between 1.337
and 1.764, and
lo
is the characteristic length. Therefore, varies between 0.669 and
0.937
for
m
values between infinity and
3.
m
=
3
represents typically the smallest
value (Le. largest data scatter) for brittle fibers that can be obtained in experiments.
In addition, some recent studies have progressed towards further advancement of
sophisticated statistical techniques to characterize the fiber fragment length
distribution through computer simulations
of
fiber fragmentation behavior
50
Engineered interfaces
in
fiber reinforced composites
(Favre et al., 1991; Curtin, 1991; Yabin et al., 1991; Merle and Xie, 1991; Gulino
and Phoenix, 1991; Ling and Wagner, 1993; Jung et al., 1993; Baxevanakis et al.,
1993; Andersons and Tamuzs, 1993; Liu et al. 1994).
However, the basic form of the relationship between the critical transfer length
and the IFSS remains virtually unchanged from the solution given by Kelly and
Tyson (1965) three decades ago. A clearly emerging view in recent years, contrary to
the conventional view of either perfect bonding or complete debonding, is that there
are both bonded and debonded regions simultaneously present at the fiber-matrix
interface during the fiber fragmentation process (Favre et al., 1991; Gulino et al.,
1991; Lacroix et al., 1992). For composites containing ductile matrices, the fiber-
matrix interface region tends to be yielded in preference to clear-cut debonding.
A
proper micromechanics model should accommodate these phenomena. Therefore,
the limitation of this test associated with Eq. (3.3) has been addressed and improved
analytical models have been presented (Kim et al., 1993; Kim, 1997), deriving the
solutions required to satisfy the interface conditions, namely full bonding, partial
debonding/yielding and full debonding/yielding. Recently, Zhou et al. (1995) have
presented a fracture mechanics analysis of the fragmentation test including the
Weibull distribution of fiber strength. Transverse matrix cracking at the sites of fibcr
breaks has also been considered by Liu et al. (1995). Further details of these various
analyses will be discussed in Chapter
4.
Moreover, the validity of
z,
being determined based on the measurement of
fragment length depends not only on the interface properties but strongly on the
properties
of
the constituents, e.g. matrix shear yield strength,
z,,
and the difference
in Poisson ratios between the fiber and matrix. The relative magnitude of these
properties influences the actual failure mechanisms occurring at the interface region
(Le., interface debonding versus matrix yielding), which in turn determines the fiber
fragmentation behavior. Bascom and Jensen
(I
986) argued that the shear stress
transfer across the interface is often limited by the matrix
z,
rather than the
interface
T,.
Adding to the above problem, the critical transfer length, (2L),, has also been
shown to be strongly dependent on Young’s modulus ratio of fiber to matrix,
Ef/Em.
Interestingly enough, some researchers (Galiotis et al., 1984; Asloun et al., 1989;
Ogata et al., 1992) identified through experimental evidence that
(2L),
varies with
as the early shear-lag model by Cox (1952) suggests. (See Chapter 4 for
solutions of fiber axial stress and interface shear stress). Finite element analyses on
single fiber composites with bonded fiber ends, however, show that there is an
almost linear dependence
of
(2L),
with
Ef/E,,
if the modulus ratio is relatively small
(Le.
Ef/Em
<
20). Experimental evidence of the dependence
of
the critical transfer
length on Young’s modulus ratio is shown in Fig 3.5, and is compared with
theoretical predictions (Termonia, 1987, 1993). Additionally, Nardin and Schultz
(1993) also proposed a strong correlation
of
the critical transfer length with the
interface bond strength, which
is
represented by the thermodynamic work of
adhesion,
W,,
at the fiber-matrix interface.
Apart from the mechanical properties of the composite constituents that
dominate the fiber fragment length, peculiar structural properties
of
the fiber may
Chapter 3.
Measurements
of
interfacelinterlaminar properties
51
P
3
-
IO2
0-
2
U
m
4-
-4-
U
W
v)
m
n
-
IO’
3
+
L
u
1
IO’
102
104
E,
/Em
Fig.
3.5.
Dependence of fiber critical aspect ratio,
(2L),/d,
on the
Young’s
modulus ratio
of
fiber to
matrix material,
EfIE,,,.
(0)
Experimental data from Asloun et al. (1989);
(-)
Termonia (1993);
( )
Cox (1952).
also complicate the interpretation of test results. For example, extensive splitting of
highly oriented organic fibers, such as Kevlar and PBT (Morgan and Allred, 1993),
into small fibrils on the fiber surface makes the test results doubtful (Kalanta and
Drzal, 1990; Scherf et al., 1992). The fiber straightening pretension applied during
specimen preparation
is
also found to influence the fragmentation behavior, causing
significant data scatter unless carefully controlled (Ikuta et al., 1991; Scherf and
Wagner, 1992). Another important drawback of this test is that the matrix must
possess sufficient tensile strain and fracture toughness to avoid premature failure of
the specimen, which is induced by fiber breaks, as mentioned earlier. A technique
has been devised to circumvent this problem in that a thick layer of the brittle matrix
material is coated onto the fiber, which is subsequently embedded in a ductile resin
(Favre and Jacques, 1990).
3.2.4.
Fiber
pull-out
test
In the fiber pull-out test,
a
fiber(s) is partially embedded in a matrix block or thin
disc of various shapes and sizes as shown in Fig 3.6. When the fiber
is
loaded under
tension while the matrix block is gripped, the external force applied to the fiber is
recorded as a function of time or fiber end displacement during the whole debond
and pull-out process. There are characteristic fiber stresses that can be obtained
from the typical force (or fiber stress). The displacement curve of the fiber pull-out
52
Engineered interfaces in jber reinforced composites
(b)
Restrained
f
,
bottom
Fig.
3.6.
Schematic illustrations of various specimen geometry
of
the fiber pull-out test: (a) disc-shaped
specimen with restrained-top loading
(b)
long matrix block specimen with fixed bottom loading,
(c)
double pull-out with multiple embedded fibers.
test is shown in Fig
3.7,
indicating the initial debond stress for interfacial debonding,
00,
the maximum debond stress at instability,
cri,
and the initial frictional pull-out
stress against frictional resistance after complete debonding,
ofr.
A
conventional way
of determining the interface bond strength,
tb,
is by using an equation similar to
Eq.
(3.3),
which is
Fig
3.8
shows the interface shear bond strength,
Tb,
determined from
Eq.
(3.7),
which is
not
a
material constant but varies substantially with embedded fiber length,
L. However,
to
evaluate
all
the relevant interface properties properly, which include
the interface fracture toughness,
Gic,
the coefficient of friction,
p,
and the residual
clamping stress,
40,
it
is
necessary to obtain experimental results for a full range of L
and plot these characteristic
fiber
stresses as a function
of
L.
More details
of
the
Chapter
3.
Measurements
of
interfacelinterlaminar properties
53
Fig.
3.7.
Schematic presentation of the applied fiber stress versus displacement
(n
-
6)
curve in a fiber
pull-out test. After Kim et al. (1992).
characterization of these properties from experimental data will be discussed in
Chapter
5.
The fiber pull-out test has been widely used not only for polymer matrix
composites but also for some ceramic matrix (Griffin et al., 1988; Goettler and
Faber, 1989; Butler et al., 1990; Barsoum and
Tung,
1991) and cement matrix
composites (see Bartos, 1981 for a useful review) as well as steel wire reinforced
rubber matrix composites (Ellul and Emerson, 1988a, b; Gent and Kaang, 1989).
However, this test method has some limitations associated with the scale of the test.
There is a maximum embedded length of fiber,
L,,,,
permitted for pull-out without
being broken.
L,,,
is usually very short, which causes experimental difficulties and
"
mo
400
600
(a)
Embedded
fiber
length,
L(pm)
Fig.
3.8.
Plots of interface bond strength,
q,,
versus embedded fiber length,
L,
(a) for a carbon fiber-epoxy
matrix system and (b) for
a
Hercules
IM6
carbon fiber-acrylic matrix system. After Pitkethly and Doble
(1990) and Desarmont and Favre (1991).
54
Engineered interfaces
in jiber reinforced composites
I
I
I
1
1
0
100
200
300
400
I
(b)
Embedded fiber
length,
Lbm)
Fig.
3.8.(b).
10
large data scatter especially for composite systems with strong interface bonding and
small fiber diameters. For example, for the carbon fiber-epoxy matrix system
L,,,
is
less than 1.0 mm (Pitkethly and Doble, 1990; Marshall and Price, 1991; Kim et al.,
1992) (see Fig
3.8).
Theoretical prediction of
L,,,
for given interface properties will
be discussed in Chapter
4.
It is also necessary
to
design a special jig/fixture to
fabricate and hold the thin matrix block needed for very short embedded fiber length
(see for example Baillie, 1991). Moreover, an elevated meniscus, which forms
around the fiber during curing
of
the matrix material, causes large stress
concentrations and makes the test results often inaccurate.
A variation of this technique has recently been developed in the so-called
'microdebond test' (Miller et al., 1987, 1991; Penn et al., 1988; McAlea and Besio,
1988; Gaur and Miller, 1989, 1990; Chuang and Chu, 1990; Biro et al., 1991; Moon
et al., 1992) to alleviate some of the experimental difficulties associated with
conventional fiber pull-out tests. In this test, a small amount
of
liquid resin is
applied onto the single fiber
to
form a concentric microdroplet in the shape of an
ellipsoid after curing, as schematically illustrated in Fig 3.9 (Gaur and Miller, 1989).
The smooth curvature at the boundary between the fiber and the microdroplet
reduces the stress concentration at the fiber entry to a certain extent and, hence, the
large variation in the experimental data is also reduced. The microdebond technique
can be used for almost any combination of fiber and polymer matrices. However, as
found in finite element and photoelastic analyses, this technique also has serious
limitations associated with the nature of the specimen and loading condition
(Herrera-Franco and Drzal, 1992). The stress state in the droplet varies significantly
with the location and shape of the loading jigs, and the size
of
small microdroplet
makes the in-situ observation
of
the failure process difficult. More importantly, the
meniscus formed around the fiber makes the measurement of the embedded fiber
length highly inaccurate, which has
a
more significant effect on the calculated bond
Chapter 3.
Measurements of interfacelinterlaminar properties
55
0.05-01
mm
Fiber
\
.
. .
.;.
:_.
:.
:;.
A,,
J.
MicrodropCt
Thin strip
of polymer
film
(a)
Polymer
A
film
1
Microvice
Fig. 3.9. Schematic presentation of
(a)
the procedure for forming thermoplastic resin microdrops and
(b)
the
microdebond test. After Gaur and Miller (1989).
strength values than in the fiber pull-out test. Mechanical properties
of
the matrix
microdroplet may also vary with size partly because of the variations
of
concentration of the curing agent as determined by differential scanning calorimetry
(DSC),
see Fig 3.10 (Rao et al., 1991). When compared with specimen geometry of
other single fiber composite tests, the microdebond test shows the least resemblance
to actual loading configuration of practical composite components.
In view of the fact that the above techniques examine single fibers embedded in a
matrix block, application of the experimental measurements to practical fiber
composites may be limited to those with small fiber volume fractions where any
effects of interactions between neighboring fibers can be completely neglected.
To
relate the interface properties with the gross performance of real composites, the
effects of the fiber volume fraction have to be taken into account.
To
accommodate
this important issue, a modified version of the fiber pull-out test, the so-called
microbundle pull-out test, has been developed recently by Schwartz and coworkers
(Qui and Schwartz, 1991, 1993; Stumpf and Schwartz, 1993; Sastry et al., 1993). In
56
Engineered interfaces
in
fiber reinforced composites
0.1
:
1
I
I
I
0
200
400
600
800
11
Approximate
droplet
size
(pm)
Fig.
3.10.
Effect of curing cycle
on
the fraction of amine curing agent estimated to have diffused out of
droplets as
a
function of their size. After Rao et al.
(1991).
this test, a central fiber is pulled out of a seven-fiber microcomposite as shown in Fig
3.11. Great difficulties are encountered in constructing the specimens since accurate
control
of
the geometry determines the embedded fiber length. No clear correlations
exist between the
IFSS and the fiber volume fraction. This indicates that the actual
failure mechanisms during fiber pull-out are matrix dominated (Qiu and Schwartz,
1993).
3.2.5.
Microindentation (or jiber
push-out)
test
The microindentation technique
(or
‘push-out’ test as opposed to the ‘pull-out’ test)
is a single fiber test capable of examining fibers embedded in the actual composite. The
Surrounding fiber
(six)
Centy fiber
\
Epoxy
bonded
part
/
PET
fiber
knot
Fig.
3.1
1.
Schematic presentation
of
a
multi-fiber pull-out specimen
Chapter
3.
Measurements of interfacelinterlaminar properties
57
slice compression test to be discussed in Section 3.2.6 serves the same purpose. The
microindentation test utilizes a microhardness indenter with various tip shapes and
sizes to apply a compressive force to push against a fiber end into the metallograph-
ically polished surface of a matrix block. In the original version
of
the test
(Fig 3.12(a)), a selected fiber is loaded using spherical indenters in steps of increasing
force, and the interface bonding is monitored microscopically between steps, until
debonding is observed (Mandell et al., 1980). The IFSS,
Zb,
is calculated from
where
Qd
is the average compressive stress applied to the fiber end at debonding.
Zmax/q
is the ratio of the maximum interface shear stress to the applied stress
determined in the finite element method (FEM).
In the second approach shown in Fig 3.12(b), a force is applied continuously using
a Vickers microhardness indenter to compress the fiber into the specimen surface
(Marshall, 1984). For ceramic matrix composites where the bonding at the interface
is typically mechanical in nature, the interface shear stress,
qr,
against the constant
frictional sliding is calculated based on simple force balance (Marshall, 1984):
Composite
+slice
Fig.
3.12.
Schematic drawings
of
indentation (or fiber push-out) techniques: using (a) a spherical indenter;
(b) a Vickers microhardness indenter; (c) on a thin slice. After Grande et al.
(1988).
58
Engineered interfaces
in
fiber
reinforced Composites
where
i?
=
2EfS/of is the debonded length estimated from the displacement
of
the
fiber end, 6, at an average external stress,
bf,
applied to the fiber.
In contrast to the thick specimens used in the above studies, very thin slice
specimens of known embedded fiber lengths (Fig 3.12(c)) are also employed (Bright
et al., 1989) to distinguish debonding and post-debond frictional push-out in
a
continuous loading test. The latter fiber push-out technique has become most
popular in recent years among the variations of specimen geometry and loading
methods. Rigorous micromechanics analyses dealing with interface debonding and
fiber push-out responses are detailed in Chapter
4.
The above test techniques have been developed initially and used extensively for
polymer matrix composites (Grande et al., 1988; Herrera-Franco and Drzal, 1992;
Desaeger and Verpoest, 1993; Chen and Croman, 1993). Its usefulness has been
extended to ceramic matrix composites (Grande et al., 1988; Brun and Singh, 1988;
Netravali et al., 1989a, b; Morscher et al., 1990; Weihs and Nix, 1991; Wang et al.,
1992; Watson and Clyne, 1992a, b; Ferber et al., 1993) where difficulties of specimen
preparation and testing associated with fiber misalignment, breakage
of
high
modulus fibers in grips, etc. are frequently experienced in fiber pull-out tests. Other
major advantages include the ability to test real composites and the speed and
simplicity
of
the test, once automated instruments are equipped with the testing
machine. The main questions associated with this test method are concerned with its
physical significance and the interpretation
of
experimental data. Other drawbacks
are the inability to monitor the failure process during the test
of
opaque composites;
problems associated with crushing and splitting
of
fibers by the sharp indentor
under compression (Desaeger and Verpoest, 1993); and radial cracks within the
matrix near the fiber-matrix interface (Kallas et al., 1992).
3.2.6.
Slice
compression
test
The slice compression test is a modified version of the indentation test and was
developed specifically for ceramic matrix composites utilizing the difference in elastic
modulus between the fiber and the matrix material. This test involves compression
of
a
polished slice of a unidirectional fiber composite cut perpendicularly to the fiber
axis between two plates (Fig 3.13). The applied load is increased
to
a desired peak
stress and then unloaded. At the critical load, interfacial debonding and sliding
occur near the top surface of the specimen where the elastic mismatch is at its
maximum and the fibers protrude against the soft top plate (e.g. pure aluminum)
with known work-hardening characteristics. At the same time, the hard bottom
plate (e.g. Si3N4) ensures
a
constant strain in the specimen bottom. Upon removing
the load, the fibers partially relax back into the matrix, retaining a residual
protrusion. Fig 3.14 schematically shows the sequence of the slice compression test
based on a single fiber model composite (Hsueh, 1993). Therefore, the interface
properties can be estimated from the fiber protrusion,
6,
under a peak load and the
residual fiber protrusion after unloading,
6,.
Shafry et al., (1989) derived
approximate solutions for the relationship between the fiber protrusion length
and the applied stress for a constant interface friction along the embedded fiber
Chapter
3.
Measurements of interfacelinterlaminar properties
59
Fig.
3.13.
Schematic drawing of slice compression test on
a
composite slice containing multiple fibers.
After Shafry et al.
(1989).
length based on the solutions previously obtained in fiber pull-out tests (Gao et al.,
1988) and fiber stress relaxation after unloading (Marshall and Oliver, 1987). More
rigorous analyses are still evolving (e.g., Hsueh, 1993; Lu and Mai, 1994), and
further details are discussed in Chapter
4.
3.2.7.
Comparison
of
microcomposite tests and experimental data
It has been noted in a round robin test of microcomposites that there are large
variations in test results for an apparently identical fiber and matrix system between
13 different laboratories and testing methods (Pitkethly et al., 1993). Table 3.1 and
Fig 3.15 summarize the IFSS values of Courtaulds
XA
(untreated and standard
surface treated) carbon fibers embedded in an
MY
750
epoxy resin. It is noted that
the difference in the average ISS values between testing methods, inclusive of the
fiber fragmentation test, fiber pull-out test, microdebond test and microindentation
test, are as high as a factor of 2.7. The most significant variation in
ISS
is obtained in
the fiber pull-out /microdebond tests for the fibers with prior surface treatments, and
the microindentation test shows the least variation.
There are a number of factors contributing to this discrepancy, such as a lack of
standardization in specimen preparation, the loading method, the measurement and
data reduction methods. Details of major contributors to the large data scatter are
summarized for each testing method in the following:
(i)
Fiber pull-out test:
measurement of embedded length, loading rate, alignment of
fiber with loading axis, accuracy of measurements of fiber diameter.
(ii)
Microdebond test:
size and shape (e.g. symmetry) of the droplet, shape of the
meniscus produced with the fiber, variations in the concentration of hardener within
the droplet, shape and size of the specimen holder (i.e. microvice).
(iii)
Fragmentation test:
level of preload applied to the fiber during the curing
process, loading method (e.g. continuous loading by electronic device versus
60
Engineered interfaces
in
Jiber reinforced composites
Fig. 3.14. Schematic drawings
of
slice compression test on a single fiber composite: (a) before loading;
(b) peak loading with a maximum fiber protrusion length,
6;
(c)
after unloading with a residual fiber
protrusion length,
6,.
After Hsueh
(1993).
intermittent manual loading), loading rate, methods of detection
of
fiber breakage
(e.g. optical microscopy and acoustic emission).
(iv)
Micro-indentation test:
specimen preparation, size and shape
of
indenter,
methods
of
detecting debonding (e.g. using microscope and from the
load
drop in
the load-displacement curve), fiber splitting caused by indentation, methods for
data reduction (e.g. finite element model and shear-lag type analysis).
Chapter
3.
Measurements
of
interfacelinterlaminar
properties
61
3.3.
Interlaminar/intralaminar
properties
3.3.1.
Introduction
In
addition to the direct measurements
of
fiber-matrix interface properties
discussed in Section
3.2,
a number
of
testing techniques have been devised to assess
the fiber-matrix interface bond quality by inference from the gross mechanical
properties such as interlaminar shear strength
(ILSS),
translaminar or in-plane shear
strength, and transverse tensile strength. These testing techniques invariably employ
-
m
a
6
F
f
E
m
c
c
m
m
CL
z
F
i
+
m
c
aJ
L
4-
m
L
m
aJ
r
m
aJ
U
m
Y-
L
aJ
4-
c
! I
40
20
0
0
0
0
A
-
123
100
80
-
-
0
0
60
0
-
00
0
40
-
0
Ao
A
20
A A
1,
-
1
I
I
1.
I.
0
1
2
3
4
5 6
7
6
9
10
11
fi
a
0
00
0
A
-
456
0
0
Ao
A
1.
I.
7
6
9
10
11
Laboratory
120
loo(-
0
80
-
60
-
40
-
20
-
A
A
A
A
0
00
A
A
(b)
Laboratory
Fig. 3.15.
Interface shear strength,
Tb,
of
(a) untreated and (b) treated
LXA5OO
carbon fiber-epoxy matrix
system measured at 10 different laboratories and using different testing methods.
(0)
fiber pull-out test;
(a)
microdebond test;
(0)
fiber push-out test;
(A)
fiber fragmentation test. After Pitkethly et al.
(1993).
62
Engineered interfaces
in
fiber reinforced composites
Table
3.1
Collated data obtained from all laboratories in a round robin test programmea
Testing method Pull-out Microdebond Fragmentation Push-out
Fiber treatment None
Std. None
Std. None
Std. None
Std
No. of laboratories
3
3
4
4
6
I
2
3
ISS,
T~
(MPa)
64.6
84.1 48.3
69.1 23.8
41.3 47.8
49.5
SD
8.2
19.4 14.1
19.7 6.6
15.4
0.5
9.1
cv
(Yo)
13
23
29 28
28
33
1
18.9
Std., standard surface treatment;
ISS,
interfacial shear strength;
SD,
one standard deviation;
CV,
coefficient
of
variation.
"After Pitkethly et
al.
(1993).
laminated composites reinforced with continuous and long fibers, whether unidi-
rectional or cross-plied.
Apart from the short beam shear test, which measures the interlaminar shear
properties, many different specimen geometry and loading configurations are
available in the literature for the translaminar or in-plane strength measurements.
These include the Iosipescu shear test, the
[f45"],
tensile test, the [lo0] off-axis
tensile test, the rail-shear tests, the cross-beam sandwich test and the thin-walled
tube torsion test. Since the state of shear stress in the test areas of the specimens
is
seldom pure or uniform in most of these techniques, the results obtained are likely to
be inconsistent. In addition to the above shear tests, the transverse tension test is
another simple popular method to assess the bond quality
of
bulk composites. Some
of
these methods are more widely used than others due to their simplicity in
specimen preparation and data reduction methodology.
Testing on bulk composite materials has a more serious limitation than in
microcomposite tests in that the actual locus and modes of failure have to be
consistent with what are originally designed for the composite in order for a specific
test to be valid. Judgment of validity of the test by examining the onset of failure
during the experiment is a tedious task, which cannot be assumed to have taken
place for a given loading condition. Even in an apparent interlaminar shear failure,
the failure may occur at the fiber-matrix interface, in the matrix or in a combination
of these, depending on the loading direction relative to the interface concerned and,
more importantly, on the relative magnitudes of the fiber-matrix interface bond
strength and the shear strength of the matrix material. This makes the interpretation
of
experimental data more complicated since this requires proper micromechanics
analysis to be developed together with prior knowledge of the matrix properties (Lee
and Munro,
1986;
Pindera et al.,
1987).
3.3.2.
Short beam shear test
The short beam shear test designated in
ASTM
D
2344
(1989)
involves loading a
beam fabricated from unidirectional laminate composites in three-point bending as
Chapter
3.
Measurements of interfacelinterlamimar properties
63
illustrated in Fig 3.16. In interpreting the short beam shear test, the maximum value
T~~~
(Le. the ILSS of the shear stress distribution along the thickness direction, is
related to the maximum applied load Pmax, and specimen width
b
and thickness
t,
according to the classic short beam shear relationship
3Pmax
Tmax
=
-
4bt
(3.10)
It is easily seen that even in the absence of any substantial bonding at the fiber-
matrix interface, ILSS
of
the composite laminate still has a lower-bound value which
is contributed solely by the shear strength of the matrix
7,.
For a brittle matrix
beam with cylindrical pores (in place of the fibers of volume fraction
vf
in square
array), the lower bound ILSS can be estimated from
zm[l
-
(4vf/~)~’~],
which
depends strongly on the fiber
vf.
This implies that the ILSS cannot be regarded as
giving the genuine values of the bond strength. Nevertheless, because
of
the
simplicity of the test method and minimum complication in specimen preparation,
the short beam shear test has become one of the most popular methods to determine
the interlaminar bond quality of composites containing both polymer and metal
matrices. It has been most widely used to assess the effects
of
fiber finish and surface
treatments, fiber-matrix compatibility for the development of new fiber or matrix
systems, etc.
This test has an inherent problem associated with the stress concentration and the
non-linear plastic deformation induced by the loading nose
of
small diameter. This
is schematically illustrated in Fig 3.17, where the effects of stress concentration in a
thin specimen are compared with those in a thick specimen. Both specimens have the
same span-to-depth ratio
(SDR).
The stress state is much more complex than the
pure shear stress state predicted by the simple beam theory (Berg et al., 1972;
P
p/2
p/2
Fig.
3.16.
Schematic
of
loading configuration
of
short beam shear test.
64
Engineered interfaces
in
jiber reinforced composites
SDR=
L/
t
4
SDR=L/t=4
Fig.
3.17.
Effect
of
stress concentrations on short beam shear specimens:
(a)
thin specimen;
(b)
thick
specimen. After Browning et
al.
(1983).
Sandorf, 1980; Whitney, 1985; Whitney and Browning, 1985). According to the
classical beam theory, the shear stress distribution along the thickness of the
specimen is a parabolic function that is symmetrical about the neutral axis where it
is
at its maximum and decreases toward zero at the compressive and tensile faces. In
reality, however, the stress field is dominated by the stress concentration near the
loading nose, which completely destroys the parabolic shear distribution used to
calculate the apparent
ILSS,
as illustrated in Fig 3.18. The stress concentration is
even more pronounced with a smaller radius of the loading nose (Cui and Wisnom,
1992) and for non-linear materials displaying substantial plastic deformation, such
as Kevlar fiber-epoxy matrix composites (Davidovitz et al., 1984; Fisher et al.,
1986), which require an elasto-plastic analysis (Fisher and Marom, 1984) to
interpret the experimental results properly.
The high stress concentration and damage by crushing in severe cases at the
loading nose with a very small
SDR
may induce premature failure
in
the
compressive face before interlaminar failure (Fig 3.19) (Berg et al., 1972; Whitney
and Browning, 1985). This problem causes a significant limitation in relation to the
failure mode transition depending on the
SDR.
It is well known that flexure
specimens, which normally fail in the shear mode, may fail under compression with
the increase in the SDR above a critical value (Sattar and Kellogg, 1969; Fisher et al.,
1986). The critical SDR in general increases with large fiber volume fraction,
6,
and
weakened interface bonding for a given fiber-matrix composite (Shih and Ebert,
1986; Birger et al., 1989). This failure mode transition behavior is very sensitive to
the loading rate (Boukhili et al., 1991). Non-shear or mixed mode failure can result
in invalid data with the calculated
ILSS
being too high with respect to the flexural
Chapter
3.
Measurements of interfacelinterlaminar properties
65
L
(b)
Thickness
(mm)
Fig. 3.18. (a) Shear stress contours and (b) shear stress distributions across the thickness of a three-point
bending specimen in a short beam shear test. After Cui and Wisnom
(1992).
Reproduced by permission
of
Elsevier Science Ltd.
Fig. 3.19. Scanning electron microphotograph of buckling failure near the loading nose of a carbon fiber-
epoxy matrix short beam shear specimen. After Whitney and Browning
(1985).
66
Engineered interfaces
in
fiber reinforced
composites
strength. Therefore, in-situ microscopic examination is often necessary to ensure
that interlaminar shear failure occurs at the maximum bending load.
Since the range of
SDR
that consistently produces interlaminar shear failure is
very small (i.e. four or five when the Young's moduli for the composites are greater
or less than
100 GPa, respectively, in accordance with the specification (ASTM
D
2344, 1989)), the specimen has to be very thick, which is both expensive and more
difficult
to
fabricate. As an alternative, four-point bending of a long thin specimen is
suggested (Browning et al., 1983), whereby the sharing of the total load between two
loading noses can reduce the local stress concentration compared to three-point
bending (Cui and Wisnom,
1992).
3.3.3.
Iosipescu
shear
test
The Iosipescu shear test (Iosipescu, 1967) is an ideal method that is relatively
simple to conduct with small and easily fabricated specimens, and it is capable
of
measuring reliable shear strength and the modulus simultaneously (Lee and Munro,
1990). This test employs a double-edge notched specimen that is subjected
to
two
counteracting moments produced by force couples as shown in Fig 3.20(a). In a
qualitative photoelastic study, Iosipescu (1967) showed that when the depth of each
90" vee-notch is between 20% and
25%
(typically 22%
)
of specimen depth and the
notch tip radius is zero (Le., a sharp notch), the stress state across the notched
section is under pure and uniform shear for an isotropic material. This is a direct
result from the coincidence between the directions of the principle stresses at f45" to
the specimen axis and the
90" notch angle in the region of the zero bending moment.
In this case, there is no stress singularity at the notch tip because of the absence of
normal stresses at the point. The average shear stress in the middle section of the
specimen with width
b
is simply given by the applied load
P,
divided by the net
cross-sectional area
P
bt
'
z=-
(3.1
1)
To
calculate the shear modulus, strain gauges are used to obtain the shear stress-
shear strain curve. Attracted by the almost pure shear state generated at the test
section, a number of researchers have studied the applicability
of
this test technique
to advanced composite materials, using FEMs as well as other experimental means.
Adams and Walrath
(1982, 1987a, b) in particular have evaluated the shear stress
distribution as a function of notch depth, angle, notch tip radius, etc., which resulted
in redesigning the specimen geometry and test fixture. It is clearly shown that there is
a substantial stress concentration near the notch tip and the shear stress distribution
in the middle section
of
orthotropic specimen is not uniform as opposed to isotropic
materials. The stress concentration is found to be a function of the orthotropic ratio
(Le., Young's moduli ratio between two principal in-plane directions,
E1
I
/E22,
which
is governed by the fiber orientation and the fiber volume fraction) and notch
geometry, and can be reduced by incorporating a large notch tip radius with a large
Chapter
3.
Measurements
of
interfacelinterlaminar properties
67
Loading fixture
pi
1
L-
Specimen
A
P
Fig.
3.20.
Schematic drawings of loading configurations
of
(a) Iosipcscu shear test and (b) asymmetric
four-point bending
(AFPB)
test. After Iosipescu
(1967)
and Slepetz et al.
(1978).
notch angle depending on the type of composites (Fig
3.21).
In addition to the depth
and tip radius of the specimen notch, there are other factors to consider in practice.
Because the stress concentrations are highly localized, cracks easily form at the
notch roots at a stress lower than the ultimate value for unidirectional fiber
composites containing brittle matrix materials that are capable
of
little plastic
deformation. These cracks subsequently relieve the stress concentration, facilitating
more uniform shear loading of the material in the notched section (Adams and
Walrath, 1987a, b; Adams 1990).
68
Engineered interfaces in fiber reinforced composites
1
1
I I
0
0.5
l,o
1,s
2,o
25
Normalized
Shear
Stress
Fig.
3.21.
Shear stress distributions across the notches in the Iosipescu
shear
test.
After Adams
and
Walrath
(1987a,
b).
Slight modification was also made to the loading fixture (Slepetz et al., 1978),
leading to the so-called asymmetrical four-point bending (AFPB) test as illustrated
in Fig 3.20(b), which requires the use of fixture dimensions in calculating the shear
stress
(3.12)
Several investigators (Sullivan et al.,
1984; Spigel et al., 1985; Abdallah and
Gascoigne, 1989) have compared the AFPB and the Iosipescu test fixtures (Adams
and Walrath, 1982, 1987a; Walrath and Adams 1983), using various techniques
including FEMs, photoelastic and Moire interferometry. Although the information
reported was rather inconsistent, the difference was only marginal in terms of both
the stress concentration and the shear stress distribution. However, there is a
disadvantage
of
the AFPB fixture in that the cylindrical loading noses may cause
local stress concentration and crushing on the edges of the composite specimen, as in
the short beam shear test, requiring the use of reinforcing tabs.
The major advantage of this test is that there is a large region of uniform shear in
idealized conditions compared to the other shear tests, e.g. the short beam shear test,
as already mentioned. It can measure both the in-plane shear strength and shear
modulus in the direction parallel to the fiber with high accuracy and reproducibility.
It can
also
be used
to
determine the interlaminar shear properties of laminate
composite when the specimen is prepared in such a way that the axial direction is
normal to the fiber direction for unidirectional composites. However, the pure shear
is
very easily distorted by various factors, such as loading nose, twist and the
bending moment arising from misalignment. Loading noses and twist may cause
stress concentration in the loading area and in the test section as in other testing
techniques.