Engineered Interfaces in Fiber Reinforced Composites Part 2 pptx
Bạn đang xem bản rút gọn của tài liệu. Xem và tải ngay bản đầy đủ của tài liệu tại đây (741.97 KB, 30 trang )
14
Engineered interjaces
in fiber reinforced
composites
reinforcements like glass, silica, and alumina, but are less effective with alkaline
surfaces like magnesium, asbestos, and calcium carbonate (Plueddemann,
1974).
2.2.4.
Chemical
bonding
Chemical bonding is the oldest and best known of all bonding theories. Physical
adsorption mechanisms discussed in Section
2.2.2
depend on van der Waal forces or
the acid-based interaction, while chemical bonding mechanism is based on the
primary bond at the interface.
A
chemical reaction at the interface is of particular
interest in the study of polymer matrix composites because it offers a major
explanation for the use of silane coupling agents on glass fibers embedded in
thermoset and amorphous thermoplastic matrices. Surface oxidative treatments of
carbon fibers have been known for many years to promote chemical bonding with
many different polymer resins. Recent work (Buxton and Baillie,
1995)
has shown
that the adhesion is a two-part process: the first part is the removal of a weak layer
of
a graphitic-like structure from the fiber surface particularly at low levels
of
treatment; and the second part is chemical bonding at the acidic sites. However,
much further work is still needed
to
verify this hypothesis.
In this mechanism of adhesion, a bond is formed between a chemical group on the
fiber surface and another compatible chemical group in the matrix, the formation of
which results from usual thermally activated chemical reactions. For example,
a
silane group in an aqueous solution of a silane coupling agent reacts with a hydroxyl
group of the glass fiber surface, while a group like vinyl on the other end will react
with the epoxide group in the matrix. The chemical compositions of the bulk fiber
and of the surface for several widely used fiber systems are given in Table
2.2.
It is
interesting to note that except for glass fibers, the chemical composition
of
the
surface does not resemble that of the bulk fiber, and oxygen is common to all fiber
surfaces. Further details regarding the types of surface treatments commonly
applied to a variety of organic and inorganic fibers and their effects on the properties
of the interfaces and bulk composites are given in Chapter
5.
2.2.5.
Reaction
bonding
Other than in polymer matrix composites, the chemical reaction between elements
of constituents takes place in different ways. Reaction occurs to form a new
compound(s) at the interface region in MMCs, particularly those manufactured by
a
molten metal infiltration process. Reaction involves transfer of atoms from one or
both of the constituents to the reaction site near the interface and these transfer
processes are diffusion controlled. Depending on the composite constituents, the
atoms
of
the fiber surface diffuse through the reaction site, (for example, in the
boron fiber-titanium matrix system, this causes a significant volume contraction due
to void formation in the center of the fiber or at the fiber-compound interface
(Blackburn et al.,
1966)),
or the matrix atoms diffuse through the reaction product.
Continued reaction to form a new compound at the interface region is generally
harmful to the mechanical properties of composites.
Chapter
2.
Characterization
of
interfaces
Table
2.2
Elemental composition
of
fibersa
15
Fiber
Bulk
Surface analysis Probable functional
group
E-glass Si,
0,
AI, Ca,
Mg,
B,
S,
0,
AI
-Si-OH,
-SiOSi
Carbon
C,
0,
N,
H,
metal
C,
0,
H JZOOH, C-OH,
C=O
F,
Fe,
Na
impurities
(inner core),
borate
B
(outer core)
C
(outer core),
0,
N
Boron
(B/W
core)
W2B~,
WB4
Bz03
as
methyl
B-OH, B-0-B
Silicon carbide
Si,
W
(inner core), Si, C Si-0-Si,
Si-OH
(SiC,/W core)
"After
Scolar (1974)
Special cases of reaction bonding include the exchange reaction bond and the
oxide bond. The exchange reaction bond occurs when a second element in the
constituents begins to exchange lattice sites with the elements in the reaction product
in thermodynamic equilibrium (Rudy, 1969). A good example of an exchange
reaction is one that takes place between a titanium-aluminum alloy with boron
fibers. The boride compound is initially formed at the interface region in an early
stage
of
the process composed of both elements. This is followed by an exchange
reaction between the titanium in the matrix and the aluminum in the boride. The
exchange reaction causes the composition of the matrix adjacent to the compound
to suffer a loss of titanium, which is now embedded in the compound. This
eventually slows down the overall reaction rate.
The oxide bond occurs between the oxide films present in the matching surfaces of
fiber and matrix. The reaction bond makes a major contribution to the final bond
strength
of
the interface for some MMCs, depending on the fiber-matrix
combination (which determines the diffusivity of elements from one constituent to
another) and the processing conditions (particularly temperature and exposure
time).
A general scheme for the classification of interfaces in MMCs can be made
based on the chemical reaction occurring between fiber and matrix according to
Metcalfe
(1974). Table
2.3
gives examples of each type. In class
I,
the fiber and
matrix are mutually non-reactive and insoluble with each other; in class
11,
the fiber
and matrix are mutually non-reactive but soluble in each other; and in class
111,
the
fiber and matrix react to form compound(s) at the interface. There are no clear-cut
definitions between the different classes, but the grouping provides a systematic
division to evaluate their characteristics. For pseudoclass
1
composites that include
B-AI, stainless steel-A1 and Sic-A1 systems, hardly any interaction occurs in solid
state diffusion bonding, but a reaction does occur when the A1 matrix
is
melted for
liquid infiltration.
In general, in most CMCs, chemical reaction hardly occurs between fiber
(or
whisker) and matrix. However, an extremely thin amorphous film can be formed,
16
Engineered interfaces
in
jiber reinforced composites
Table
2.3
Classification of fiber-metal matrix composite systemsa
Class
I
Class
I1
Class
I11
w-cu W-Cu(Cr) eutectics W-Cu(Ti)
A1203-CU
W-Nb
C-AI
(
>
700
"C)
A1203-Ag
C-Ni
AI2Q3-Ti
BN coated
B
W-Ni
&Ti
B-Mg
Sic-Ti
B-AI
Si02-AI
Stainless steel-A1
Sic-AI
aAfter
Metcalfe
(1974)
originating from the oxide present on the fiber surface, due
to
the limited fiber-
matrix reaction, e.g., between alumina whisker and zirconia matrix (Becher and
Tiegs,
1987),
or resulting from the decomposition
of
the metastable Sic fibers in Sic
matrix (Naslain,
1993).
The reaction compound thereby formed normally has a low
fracture energy and is soft compared to the fiber or matrix. It acts as a compliant
layer for the relaxation of residual thermal stresses and promotes longitudinal
splitting along the fiber length.
2.2.6.
Mechanical
bonding
Mechanical bonds involve solely mechanical interlocking at the fiber surface.
Mechanical anchoring promoted by surface oxidation treatments, which produce a
large number
of
pits, corrugations and large surface area of the carbon fiber, is
known to be
a
significant mechanism
of
bonding in carbon fiber-polymer matrix
composites (see Chapter
5).
The strength
of
this type of interface is unlikely
to
be
very high in transverse tension unless there are
a
large number of re-entrant angles
on the fiber surface, but the strength in longitudinal shear may be significant
depending on the degree of roughness.
In addition to the simple geometrical aspects
of
mechanical bonding, there are
many different types of internal stresses present in composite materials that arise
from shrinkage of the matrix material and the differential thermal expansion
between fiber and matrix upon cooling from the processing temperature. Among
these stresses, the residual clamping stress acting normal to the fiber direction
renders a synergistic benefit on top
of
the mechanical anchoring discussed above.
These mechanisms provide major bonding at the interface of many CMCs and play
a decisive role in controlling their fracture resistance and R-curve behavior. Further
details of these residual stresses are discussed in Chapter
7.
Chapter
2.
Characterization
of
interfaces
17
2.3.
Physico-chemical characterization of interfaces
2.3.1.
Introduction
Composite interfaces exist in a variety of forms of differing materials.
A
convenient way to characterize composite interfaces embedded within the bulk
material is to analyze the surfaces of the composite constituents before they are
combined together, or the surfaces created by fracture. Surface layers represent only
a small portion of the total volume of bulk material. The structure and composition
of
the local surface often differ from the bulk material, yet they can provide critical
information
in predicting the overall properties and performance. The basic
unknown parameters in physico-chemical surface analysis are the chemical
composition, depth, purity and the distribution of specific constituents and their
atomic/microscopic structures, which constitute the interfaces. Many factors such as
process variables, contaminants, surface treatments and exposure to environmental
conditions must be considered in the analysis.
When a solid surface is irradiated with a beam of photons, electrons or ions,
species are generated in various combinations. An analytical method for surface
characterization consists of using a particular type of probe beam and detecting a
particular type of generated species. In spectroscopy, the intensity or efficiency of the
phenomenon of species generation is studied as a function of the energy
of
the
species generated at a constant probe beam energy, or vice versa. Most spectro-
scopic techniques are capable of analyzing surface composition, and some also allow
an estimation of the chemical state of the atoms. However, it may be difficult to
isolate the contributions of each surface layer of the material being probed to these
properties. Since most surface analysis techniques probe only the top dozen atomic
layers, it is important not to contaminate this region. For this reason and
particularly to reduce gas adsorption, a vacuum always has to be used in
conjunction with these techniques. The emergence of ultrahigh vacuum systems of
less than
loT6
Pa (or
7.5
x
Torr), due to rapid technological advances in recent
years, has accelerated the development of sophisticated techniques utilizing
electrons, atoms and ions. Amongst the currently available characterization
techniques, the most useful ones for composite interfaces are: infrared
(IR)
and
Fourier transform infrared (FTIR) spectroscopy, laser Raman spectroscopy, X-ray
photoelectron spectroscopy
(XPS),
Auger electron spectroscopy (AES), secondary
ion mass spectroscopy
(SIMS),
ion scattering spectroscopy
(ISS),
solid state nuclear
magnetic resonance (NMR) spectroscopy, wide-angle X-ray scattering (WAXS),
small-angle X-ray scattering (SAXS) and the measurement of the contact angle.
A
selected list
of
these techniques is presented in Table
2.4
along with their atomic
processes and the information they provide. Each technique has its own complexity,
definite applications and limitations. Often the information sought cannot be
provided by a single technique. This has resulted in the design of equipment that
utilizes two or more techniques and obtains different sets of data from the same
surface of the sample (e.g. ISSjSIMS two-in-one and XPS/AES/SIMS three-in-one
equipment). Adamson (1982), Lee (1989), Castle and Watts (1988) and Ishida (1994)
18
Engineered interfaces in fiber reinforced composites
have presented excellent reviews
of
most of these techniques, with Ishida
(1994)
being particulalry informative for characterization of composite materials.
In addition to surface analytical techniques, microscopy, such as scanning
electron microscopy
(SEM),
transmission electron microscopy (TEM), scanning
tunneling microscopy
(STM)
and atomic force microscopy
(AFM),
also provide
invaluable information regarding the surface morphology, physico-chemical inter-
action at the fiber-matrix interface region, surface depth profile and concentration
of elements. It
is
beyond the scope of this book to present details of all these
microscopic techniques.
2.3.2.
Infrared and Fourier transform infrared
spectroscopy
IR spectroscopy, one of the few surface analytical techniques not requiring
a
vacuum, provides a large amount of molecular information. The absorption versus
frequency characteristics are obtained when a beam of IR radiation is transmitted
through
a
specimen.
IR
is absorbed when a dipole vibrates naturally at the same
frequency as the absorber, and the pattern of vibration is unique for a given
molecule. Therefore, the components or groups of atoms that are absorbed into the
IR at specific frequencies can be determined, allowing identification of the molecular
structure.
The FTIR technique uses a moving mirror in an interferometer to produce an
optical transformation of the IR signal as shown in Fig.
2.6.
During this operation,
the source radiation
is
split into two: one half is reflected into the fixed mirror and
the other half transmitted to the moving mirror. If the mirrors are placed equidistant
from the beam splitter, their beams will be in phase and reinforce each other. In
contrast, the beams that are out of phase interfere destructively. An interferogram is
produced from the equations involving the wavelength of the radiation, and a
Fourier analysis is conducted to determine the relation between the intensity and
frequency. FTIR can be used
to
analyze gases, liquids and solids with minimal
preparation and little time. This technique has been extensively applied to the study
Fixed
mirror
-
Movable
mirror-
Unmodulated
incident
,,
\e
Source
Splitter
1
Detector
Fig.
2.6.
Schematic diagram
of
an interferometry
used
in the
FTIR
spectroscopy. After
Lee
(1989).
Chapter
2.
Characterization
of
interfaces
19
Table 2.4
Techniques for studying
s
Technique
,urface structures and composition"
~~~
Atomic process and type of information
Microscopy
Scanning electron
microscopy
(SEM)
Transmission electron
microscopy
(TEM)
Scanning tunneling
microscopy (STM)
Atomic forcc microscopy
(AFM)
An analytical
SEM
consists of electron optics, comprehensive signal
detection facilities, and a high-vacuum environment. When the primary
electron beam is targctcd at the specimen,
a
portion of the electrons
is
backscattered from the upper surface of the specimen. The electrons in
the specimen can also be excited and emitted from the upper surface
which are called secondary electrons. Both backscatterd and secondary
electrons carry the morphological information from the specimen
surface. The microscope collects these electrons and transmits the signals
to a cathode ray tube where the signals are scanned synchronously.
providing morphological information on the specimen surface.
Environmental
SEMs
are a special type of
SEM
that
work
under
controlled environmental conditions and require no conductive coating
on
the specimen with the pressure in the sample chamber only
1
or
2
orders magnitude lower than the atmosphere.
TEM is composed of comprehensive electron optics, a projection system,
and a high-vacuum environment. When a portion
of
high voltage primary
electrons is transmitted through an ultrathin sample, they can be
unscattered and scattered to carry the microstructural information
of
the
specimen. The microscopes collect the electrons with a comprehensive
detection system and project the microstructural images onto a fluorescent
screen. The ultimate voltage for a TEM can generally be from
IO
to 1000
keV, depending on the requirement
of
resolving power and specimcn
thickness.
The
STM,
like other scanning probe microscopes, relies on the scanning of
a sharp tip over a sample surface. When the tip and sample are very close
so
that the electron clouds of tip and sample atoms overlap, a tunneling
current can be established through voltage differences applied between the
two electrodes. When a raster scan
is
made, the relative height coordinate
z
as a function of the raster coordinate
x
and
y
reflects the surface
topography of the sample. The STM is limited to conducting materials
as
it is based on the flow of electrons.
In AFM, a sharp tip integrated with a soft spring (cantilever) deflects
as a
result of the local interaction forces present between the apex
of
the tip and
the sample. The deflection
of
this cantilever can
be
monitored at its rear
by a distance sensor. The forces existing between tip and sample, when
they are close, can be van der Waals, electrostatic
or
magnetic force.
Atomic-scale friction, elasticity and surface forces can also be measured.
AFM can
be
employed for both conductive and non-conductive
specimens, without having to apply a high vacuum, presenting a major
advantage
over
STM.
20
Engineered interfaces in Jiber reinforced composites
Table 2.4 (Contd.)
Technique
Atomic process and type of information
Spectroscopy
Auger electron
spectroscopy
(AES)
X-ray photoelectron
spectroscopy
(XPS)
Secondary ion mass
spectroscopy (SIMS)
Ion scattering spectroscopy
(ISS)
Infrared (IR) and Fourier
transform infrared (FTIR)
spectroscopy
Raman spectroscopy (RS)
The sample surface is bombarded with an incident high energy electron
beam, and the action of this beam produces electron changes in the target
atoms;
the
net result
is
the ejection of Auger electrons, which are the
characteristics of the element. Because of the small depth and small spot
size of analysis, this process
is
most often used for chemical analysis of
microscopic surface features.
When
a
sample maintained in
a
high vacuum is irradiated with soft X-rays,
photoionization occurs, and the kinetic energy
of
the ejected
photoelectrons is measured. Output data and information related to the
number of electrons that are detected
as
a function of energy are generated.
Interaction of the soft X-ray photon with sample surface results in ionization
from the core and valence electron energy levels of the surface elements.
The sample surface is bombarded with a beam of around
1
keV ions of
some gas such as argon and neon. The action of the beam sputters atoms
from the surface in the form
of
secondary ions, which are detected and
analyzed
to
produce a characterization
of
the elemental nature of the
surface. The depth of the analysis is usually less than a nanometer, making
this process the most suitable for analyzing extremely thin films.
In
ISS,
like in
SIMS,
gas ions such as helium
or
neon are bombarded on
the sample surface at a
fixed angle of incident. The ISS spectrum normally
consists
of
a single peak of backscattered inelastic ion intensity at an energy
loss
that
is
characteristic of the mass of surface atom. From the pattern of scattered
ion
yield versus the primary ion energy, information about elements present on
the
sample surface can
be
obtained at
ppm
level.
The absorption versus frequency characteristics are obtained when a
beam
of IR radiation is transmitted through a specimen. The absorption or
emission of radiation is related to changes in the energy states of the
material interacting with the radiation. In the IR region (between 800 nm
and
250
pm
in wavelength), absorption causes changes in rotational
or
vibrational energy states. The components or groups of atoms that absorb
in the IR at specific frequencies are determined, providing information
about
the
molecular structure.
The
FTIR technique employs
a
moving
mirror to produce an optical transformation of the
IR
signal, with the
beam intensity after the interferometer becoming sinusoidal. FTIR has
been
extensively used for the study of adsorption on polymer surfaces, chemical
modification and irradiation of polymers on the fibersurfaces.
The collision between a photon of energy and a molecule results in two
different types of light scattering: the first is Rnyleigh scattcring and the
second is Raman scattering. The Raman effect is an inelastic collision
where the photon gains energy from
or
loses energy to the molecule that
corresponds to the vibrational energy of the molecule. Surface-enhanced
Raman spectroscopy has been successfully used to obtain information
about adsorption of polymers onto metal surfaces, polymer-polymer
interaction and interdiffusion, surface segregation, stress transfer at the
fiber-matrix interface, and surface structure of materials.
Chapter
2.
Characterization
of
interfaces
21
Table
2.4
(Contd.)
Technique
Atomic process and type
of
information
~
Nuclear magnetic resonance
(NMR) spectroscopy
In NMR technique,
a
sample
is
placed in
a
magnetic field which
forccs
thc
nuclei into alignment. When the sample is bombarded with radiowaves,
they are absorbed by the nuclei. The nuclei topple out of alignment with
the magnetic field. By measuring the specific radiofrequencies that are
emitted by the nuclei and the rate at which the rcalignment
occurs,
the
spectroscope can obtain the information
on molecular structure.
"After Adamson
(1982),
Lee
(1989)
and Ishida
(1994)
of adsorption on surfaces of polymers (Lee,
1991)
and of chemical modification and
irradiation
of
polymers on the fiber surfaces, including silane treated glass fibers
(Ishida and Koenig,
1980;
Garton and Daly,
1985;
Grap et al.,
1985;
Miller and
Ishida,
1986;
Liao,
1989;
DeLong et al.,
1990).
Fig.
2.7
shows
typical
IR
spectra of
glass fiber-epoxy matrix composites with and without an amino silane coating on
the fiber.
2.3.3.
Laser Raman spectroscopy
Laser Raman spectroscopy uses
a
light scattering process where
a
specimen is
irradiated monochromatically with a laser. The visible light
that
has passed into the
specimen causes the photons of the same wavelength to be scattered elastically, while
I11111111
Wave
number
(cm-'1
2000
1600
1200
800
Fig.
2.7.
Spectra
of
a
glass fiber-epoxy matrix composite
(a)
before and
(b)
after hydrolysis. After Liao
(1989).
22
Engineered interfaces in jiber reinforced composites
it causes the light of slightly longer or shorter wavelengths to be scattered
inelastically. The inelastic proportion of the photons imparts energy to the
molecules, which are collected for analysis. An interesting feature of the Raman
spectroscopy is that certain functional groups or elements scatter incident radiation
at characteristic frequency shifts. The vibrational frequency of the group or element
is the amount of shift from the exciting radiation. Functional groups with high
polarizability on vibration can be best analyzed with Raman spectroscopy.
Raman and IR spectroscopies are complementary
to
each other because of their
different selection rules. Raman scattering occurs when the electric field of light
induces a dipole moment by changing the polarizability of the molecules. In Raman
spectroscopy the intensity of a band is linearly related to the concentration of the
species. IR spectroscopy, on the other hand, requires an intrinsic dipole moment to
exist for charge with molecular vibration. The concentration of the absorbing
species is proportional to the logarithm of the ratio of the incident and transmitted
intensities in the latter technique.
As the laser beam can be focused to a small diameter, the Raman technique can
be used to analyze materials as small as one micron in diameter. This technique
has been often used with high performance fibers for composite applications in
recent years. This technique is proven to be a powerful tool
to
probe the
deformation behavior of high molecular polymer fibers (e.g. aramid and
polyphenylene benzobisthiazole
(PBT)
fibers) at the molecular level (Robinson
et al., 1986; Day et al., 1987). This work stems from the principle established
earlier by Tuinstra and Koenig (1970) that the peak frequencies of the Raman-
active bands of certain fibers are sensitive to the level of applied stress or strain.
The rate of frequency shift is found to be proportional to the fiber modulus, which
is a direct reflection of the high degree of stress experienced by the longitudinally
oriented polymer chains in the stiff fibers.
In the case of carbon fibers, two bands are obtained: a strong band at about
1580
cm-' and a weak band at about 1360 cm-', which correspond to the
Ezs
and
AI, modes of graphite (Tuinstra and Koenig, 1970). The intensity of the Raman-
active band,
AI^
mode, increases with decreasing crystalline size (Robinson
et al., 1987), indicating that the strain-induced shifts are due to the deformation
of crystallites close to the surfaces of the fibers. The ratio of the intensities of the two
modes, Z(Alg)/Z(Ezg), has been used to give an indirect measure of the crystalline
size in carbon fibers (Tuinstra and Koenig, 1970). Table
2.5
gives these ratios and
the corresponding average crystal diameter,
La,
in the graphite plane, as determined
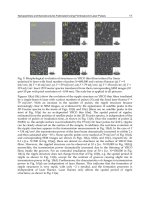
by X-ray techniques. Typical examples of strain dependence of the Raman
frequencies is shown in Fig. 2.8 for two different carbon fibers, and the
corresponding plots of the shifted Raman frequency are plotted as a function of
the applied strain in Fig. 2.9.
Enabled by the high resolution of spectra, which is enhanced by the use of spatial
filter assembly having a small (200
pm)
pin hole, the principle of the strain-induced
band shift in Raman spectra has been further extended to the measurement of
residual thermal shrinkage stresses in model composites (Young et al., 1989; Filiou
et al., 1992). The strain mapping technique within the fibers is employed to study the
Chapter
2.
Characterization
of
interfaces
23
Table
2.5
Intensity ratio
of
Raman bands
I(AI,)/I(E2J
and the corresponding apparent crystal diameter,
La,
for
various carbon fibers"
Thornel
10
Union Carbide
Thornel
25
Thornel
50
Thornel
75
Thornel
40
Morganite
I
Morganite
I1
H.M.G.
50
Hitco
Fortafil
5-Y
Great Lakes
0.85
0.40
0.29
0.25
0.30
0.22
0.83
0.56
0.25
50
120
155
170
150
200
50
80
180
I
I
I
1525
1545
1565 1585 1605 1625
Raman Frequency (crn-')
1525 1545
1565
1585
1605
1625
Raman Frequency
(ern-')
Fig.
2.8.
Laser Raman spectra obtained (a)
for
a polyacrylonitrile (PAN)-based HMS4 carbon fiber, and
(b)
for
a pitch-based
P75S
carbon fiber.
After
Robinson
et
al.
(1987).
24
Engineered interfaces
in jiber reinforced composites
-
uo
7
r
E,
‘5
-
-
E
u’-
c
a9
3
a
m-
u
c
0)
3
Fig.
2.9.
Variation
of
the position
of
the
1580
cm-’ peak with fiber strain (a)
for
a polyacrylonitrile
(PAN)-based
HMS4
carbon
fiber,
and (b)
for
Thornel
50
carbon fiber.
After
Robinson et al.
(1987).
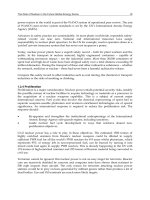
stress transfer mechanisms across the fiber-matrix interface in the fiber fragmen-
tation test geometry (Galiotis, 1993a). The variation of fiber axial strain and
interface shear stress
(IFSS)
measured along the length of Kevlar
49
fiber embedded
in an epoxy matrix is shown in Fig.
2.10
for different levels of applied strain. The
IFSS
is calculated based on the force balance between fiber axial direction and
interface shear.
2.3.4.
X-ray photoelectron spectroscopy
XPS,
also known as electron spectroscopy for chemical analysis
(ESCA),
is a
unique, non-destructive analytical technique that provides information regarding
the chemical nature of the top
2-10
nm of the solid surface with outstanding
sensitivity and resolution. In XPS, the solid surfaces are subjected to a beam of
almost monochromatic X-ray radiation of known energy in a high vacuum
environment
(4
x
10-9-1
x
lop8 Torr). Electrons are emitted from the inner orbital
with kinetic energies characteristic of the parent atoms. The intensities of the kinetic
energy are analyzed and the characteristic binding energies are used
to
determine the
chemical composition. The total absorbed X-ray photon energy,
hv,
is given by the
sum of the kinetic energy,
EK,
and the electron binding energy,
EB
hv=EK+EB.
(2.12)
Once the kinetic energy is measured with an electron spectrometer for a given X-ray
photon energy, the binding energy characteristic
of
the parent atoms can be directly
determined. The electron binding energy represents the work expended to remove an
electron from a core level of the inner orbital to the Fermi level in its removal from
the atom. Peaks in the plots
of
electron intensity versus binding energy correspond
to the core energy levels that are characteristic
of
a given element.
Chapter
2.
Characterization of interfaces
25
2
15
50
25
Applied
strain
=04%
-
-
Y
$
E
c1
OE
2
v)
&
-25
2
+
v)
0
-50
0
-75
L
0
200
400
600
800
1000
Axial
distance
(pm)
(4
2
50
g
25
02
5
-25
2
c
E'
+
v)
L
ai
e
-50
LL
0
-75
0
200
400
600
800
1000
(b)
Axial
distance
(pm)
+
v)
100
2
50
0
1
-50
-100
0
-150
Applied
strain
=2.5%
0 200
400
600
800
1000
Axial
distance
(pm)
(4
Fig.
2.10.
Fiber strain and interfacial shear stress
(IFSS)
profiles along the fiber length
for
a heat-treated
Kevlar 49 fiber-poxy resin composite.
At
applied strains
of
(a)
0.60%
(b) 1.90% and
(c)
2.5%.
After
Galiotis (1993a,b).
26
Engineered
interfaces
in
jiber
reinforced composites
Table
2.6
XPS
analysis, elemental composition
of
carbon fibers"
Carbon fibers
T300
C(%)
O(%)
N(%)
S(%)
Si(%)
Na(%)
Unsized
Sized
0.8
-
-
81.5
12.7
5.3
79.2
20.0
0.8
-
- -
"After Cazeneuve et
al.
(1990)
In XPS, only large areas can be analyzed because X-rays are difficult
to
focus with
sufficient intensities
on
a small target area.
Signals from small regions of a
heterogeneous solid surface are usually weak and difficult to isolate. For these
reasons,
XPS
is not well suited
to
depth profiling. One significant recent advance is
the development of the X-ray monochromator, which collects some of the X-rays
from a conventional source and refocuses them on the sample. This allows
a
small
sample area to be illuminated and analyzed with X-rays, resulting in an increased
ability to distinguish different chemical states. Another innovation is the addition of
a parallel detection system, which has the abiIity
to
collect simultaneously all the
points of a special range, substantially increasing the speed and sensitivity of the
instrument. The conventional unit, which contains a single exit slit, is able to collect
only a single point.
Applications of XPS for composite interface studies include the quantitative
assessment of the local concentration of chemical elements and functional groups
that are required to evaluate the contributions of chemical bonding at the fiber-
matrix interface region in polymer matrix composites (Yip and Liu, 1990; Baillie
et al., 1991; Nakahara et al., 1991; Shimizu et al., 1992; Kim et al., 1992; Wang and
Jones, 1994). Fig. 2.1
1
shows examples of
XPS
spectra obtained for carbon fibers
with and without surface sizing. The corresponding elemental compositions of these
fibers are given in Table
2.6.
The main difference between the sized and unsized
carbon fibers is the quantity of nitrogen (Le.
5.3%
and
0.8%
in unsized and sized
fibers, respectively), which is considered to originate from the residue of a
polyacrylonitrile (PAN) precursor or from the surface treatment at the end of the
manufacturing process (Cazeneuve et al., 1990).
To
identify functional groups
present on the fiber surface, the small chemical shifts are analyzed to obtain
information
of
oxidation states and the overlapping peaks are deconvoluted (Kim
et al., 1992). This means that the larger the chemical shifts the easier the
identification of functional groups. However, certain functional groups can be
difficult to distinguish, e.g. carboxylic acids, esters, alcohols, and aldehydes, which
all contain a carbonyl oxygen and as a result have overlapping
C1,
spectra.
2.3.5.
Auger electron spectroscopy
AES is similar to XPS in its function, but it has unparalleled high sensitivity and
spatial resolution (of approximately
30-50
nm). Both AES and XPS involve the
identification of elements by measurement of ejected electron energies. Fig.
2.12
Chapter
2.
Characterization
of
interfaces
25
20
mGls
X
Y
v)
2
10
21
0
-
C
-
-
-
m-
9
X
v)
4-
C
3
0
U
Y
:L
6
2
0
200
I
1
I I
400
600
800
1000
Binding energy
(eV)
Fig.
2.1
I.
Spectra of (a) unsized and
(b)
sized
T300
carbon
fibers
which are obtained from
XPS.
After
Cazeneuve
et
al.
(1990).
compares the reactions in
XPS,
AES,
SIMS
and ISS, and the latter two techniques
will
be
discussed in the following sections. In
AES,
it is possible to focus an electron
beam laterally to identify features less than 0.5pm in diameter and into a monolayer
in
thickness. In addition, by simultaneous use
of
analytical and sputter etching, it
may provide composition profiles. However, the
AES
electron beam
is
highly
concentrated with high
flux
density and beam energy, which can damage the
polymer surface causing pyrolysis during measurement. This makes it difficult to
employ
AES
technique on
a
thin film. In this regard,
XPS
is a more delicate
technique as the power required is an order of magnitude lower than in
AES.
28
Engineered interfaces
in
fiber reinforced composites
SIMS
and
ISS
Ion
Excitation
XPS
Auger Electron
Elec
‘&on
Fig.
2.12.
A comparison
of
XPS,
AES,
SIMS
and
ISS
reactions.
After
Lee
(1989).
In AES, an energetic beam
of
electrons strikes the atoms
of
the sample in a
vacuum and electrons with binding energies less than the incident beam energy may
be ejected from the inner atomic level, creating a single ionized excited atom. This
irradiation causes ejection of orbital electrons from the sample and the resulting
excited atom either emits an X-ray (fluorescence) or an electron is ejected from the
atom (Auger process). This vacancy is filled by de-excitation
of
electrons from other
electron energy states. The energy released can be transferred to an electron in any
atom. If this latter electron has a lower binding energy than the energy from the de-
excitation, then it will be ejected with its energy related to the energy level of the
separation in the atoms. Auger electrons are the result
of
de-excitation processes of
these vacancies and electrons from other shells and re-emission of an electron to
carry away excess energy. The electrons emitted have a short mean free path, and
thus all Auger electrons are from the first few atomic surface layers. The kinetic
energies of the free electrons are detected and they reflect the variations in binding
energies of the levels involved in the process.
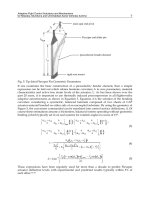
The Auger electron spectra shown in Fig.
2.13
contain peaks corresponding to the
intensity of Auger electrons as a function of kinetic energy. These electrons are
emitted following the creation
of
a core hole in the electron shells by radiation of an
incident electron beam. The kinetic energy is independent of the energy of the
incident beam, and the intensity
of
an Auger peak relates
to
the concentration of
atoms
or
ions in the volume being analyzed.
As
in
XPS,
changes in chemical and
oxidation states are reflected by the shifts in the peak position. Whether or not the
chemical state can be recognized depends on the width of the Auger peak. A very
wide peak cannot be used to provide information on the chemical state. The
intensity
of
a peak
or
the peak area is a complex function of the angle of incidence
and the current of the primary beam, the inelastic mean free path
of
the escaping
electron, the local angle of the detected electrons, etc. It is essential to understand
these factors to conduct proper composition analysis.
Chapter
2.
Characterization
of
interfaces
29
I
Unsirei
I
I
fiber
Sized
fiber
Fig.
2.13.
Spectra
of
unsized and sized carbon fibers obtained from AES. After Cazeneuve et
al.
(1990).
Although this technique is not normally used for thin polymer films for the
reasons described before, it can be used for analyzing the surface of polymer
composites containing conductive fillers, e.g. carbon fibers. In addition, because of
the surface specificity, the sampled area can be maintained almost identically to the
beam cross-section
so
that the scanning Auger microscope
(SAM)
can have a spatial
resolution that is much better than that of microprobe analysis.
2.3.6.
Secondary ion mass spectroscopy
SIMS
is a technique of direct mass analysis where the ion sputter is removed from
the surface and, as a result of the ion bombardment,
it
is analyzed. By measuring
both positive and negative ions, two different types
of
mass spectra are obtained.
Positive
SIMS
is especially sensitive to low
2
elements, which have low electroneg-
ative and ionization potential, while the negative
SIMS
is most sensitive to low
Z
elements with high electronegativity. The
SIMS
spectrum shown in Fig. 2.14
(Denison et al., 1988a,
b)
as a function of mass number is typical of that obtained
from a carbon fiber surface.
SIMS
has the ability to detect an extremely small weight range (approximately
lopL5
g), and can provide chemical information on polymers and composites by
detection
of
ion fragments such as CH+,
CzHf,
CN+,
MOH+
and MN, where M is
another atom such as
P,
S,
or metal atom.
SIMS
can analyze rapidly all elements
and their isotropes without a problem of charge build-up due to its moderate energy
beam of ions (about 1-20 keV). Spatial resolution (about
5
nm) of microfocused ion
beams on an organic sample is comparable to those of
XPS
or
AES
without the need
of an extremely high vacuum
(7.5
x
Torr).
SIMS
also has a greater depth
of
resolution than that of the methods based on electron spectroscopy (e.g. AES and
XPS),
but in terms
of
quantitative use,
SIMS
still lags behind the other two
30
Engineered interfaces
in
fiber reinforced composites
Atomic
Mass
Units
(amu)
Fig.
2.14.
A
typical
spectrum
of
a carbon
fiber
obtained
from
SIMS.
After
Denison
et
ai.
(1988a,
b).
techniques by several years. There are two important features that make SIMS of
particular value (Castle and Watts, 1988):
(i) Hydrogen can be detected in the spectrum, a capability which is not possible in
the other methods.
(ii) Isotopes can be distinguished and thus the source of the material on the fiber
surface can
be
discovered by using tracers. Therefore, it is possible
to
distinguish
the oxygen derived from the atmosphere or matrix material from the oxygen
incorporated during an oxidative treatment of carbon fibers.
2.3.7.
Ion
scattering spectroscopy
In ISS, a sample is bombarded with gas ions such as helium or neon at a fixed
incident angle, as shown in Fig.
2.15,
to obtain information about the atoms present
in the top layer of the surface. The high sensitivity of
ISS
permits detection of
elements at the ppm level. The
ISS spectrum normally consists
of
a single peak of
scattered ion intensity at an energy
loss
that is characteristic of the mass of the
surface atom. Information regarding chemical bonding at the interface region can be
generated from the yield pattern
of
scattered ions as a function of the primary ion
energy.
The combined ISSjSIMS is an extremely useful surface analytical technique that
can provide several types of data from the same surface. Both ISS and SIMS employ
ion beams, and thereby both methods can utilize the same ion source for the surface
probe, as schematically shown in Fig.
2.16.
Addition of a specially designed ion lens
and quadruple mass spectrometer can make the whole system much more efficient.
The value of information obtained from the combination
of
these two systems is
Chapter
2.
Characterization
of
interfaces
31
Energy
analyzer
/
P
Scattered
f
ion
beam
_
P
Primary ion beam
-
(Mass selected)
-
Crystal
Fig.
2.15.
Schematic diagram
of
ion scattering experiment.
further increased by yielding positive and negative ion mass spectra from elements
as well as from molecular fragments. This combination uses energy analysis
of
backscattered beam ions, hydrogen detection and molecular ion identification by
mass analysis
of
both negative and positive secondary sputtered ions. The
ISS/SIMS
technique is particularly useful for polymer matrix composites
to
determine the elemental
distributions and the presence of
F
or Si originating from mold release agents.
2.3.8.
Solid
state nuclear magnetic resonance spectroscopy
Solid state NMR spectroscopy is used to determine molecular structures by
analyzing the static and dynamic features of the material. In NMR experiments,
both a magnetic field and a radio frequency field are applied
to
a solid sample or a
solution resulting in an absorption
of
energy, which is detected as an NMR.
Spectrometers are also available for high resolution solid state NMR. Nuclei in
32O
analyzer
Electron energy
I
I
anatyzer
*:
I
-=t\
fl
I
-
-
Fig.
2.16.
A
combination
of
SIMS
and
ISS.
After Lee
(1989).
32
Engineered interfaces in fiber reinforced composites
bc
HSCH CH
CH
SIIOCH~)~
c
‘b2a2
(a)
3.k
200
150
100
50
0
PPM
Fig.
2.17.
NMR
Spectra
of
(a)
a
polymerized coupling agent and
(b)
a coupling agent
on
a glass surface.
After Zaper and Koenig
(1985).
different chemical environments resonate at different frequencies and thus differ in
their chemical shifts. Chemical shifts are used to assign these resonances to the
specific structure
of
the sample. The nuclear environment of
a
nucleus results in
multiple resonances that are also used to determine structural information. Recent
development of high power proton decoupling cross-polarization and magic angle
sample spinning
(MAS)
techniques have made it possible to study composite
interfaces, in particular silane treated glass fiber interfaces (Zaper and Koenig, 1985;
Drumm and Ulicny,
1989;
Hoh
et
al.,
1990),
by using
NMR
spectroscopy. Fig. 2.17
shows a typical example of
a
NMR
spectrum
of
a composite interface.
2.3.9.
Wide-angle
X-ray
scattering
A
technique for the characterization of polymer crystallinity as a bulk material or
around the stiff fibers/particulates in composites is based on
WAXS.
The
WAXS
method
is
actually more of a bulk analytical tool than a surface technique, but it has
been developed mainly for monitoring crystallinity in thermoplastics and fiber
composites made therefrom.
Fig. 2.18 illustrates the nature of the intensity profiles in pure polyetheretherke-
tone
(PEEK)
and carbon fiber reinforced
PEEK
composites in the transmission and
reflection modes, respectively. The quenched amorphous and slowly cooled
crystalline components from
PEEK
can be separated. The three prominent
diffraction peaks from the crystalline components in Fig. 2.18(a) correspond to
the three uniform rings which can be detected in X-ray photographs. In contrast, no
clearly measurable signal is identified from the
PEEK
amorphous phase indepen-
dent of the carbon fiber content.
Chapter
2.
Characterization of interfaces
33
ZI
v)
c
al
c
c
c(
t
I
1 1
I
I
I
10
15 20 25
30
35
(a)
20
(degrees)
I
I
I
I
1
15
20
25
30
35
(b)
28
(degrees)
Fig.
2.18.
(a) Transmission
WAXS
scans
of
pure PEEK sheets
of
thickness
1
mrn;
(b)
reflection
WAXS
scans
of
carbon fiber-PEEK matrix composites. After Lee
(1989).
2.3.10.
Small-angle light scattering and small-angle X-ray scattering
Small-angle light scattering
(SALS)
is
a
technique developed to determine the
morphological structures on a scale larger than the wave length 1-100
pm
of
the
radiation used. Spherulites are structures
of
semicrystalline polymers that are in this
size range. In
SALS,
a
monochromatic, collimated and plane polarized laser beam is
used to excite
a
thin polymer film. The scattered radiation is analyzed with a second
polarizer, aligned with the first polarizer, and the scattering pattern is recorded on
photographic film or by electron detectors.
As
light interacts with the polymer, there
is polarization
of
the electronic charge distribution. The scattering
of
visible light is
associated with variations in the anisotropy and reflective index or polarizability
of
34
Engineered interfaces
in
fiber reinforced
composites
the specimen, which is influenced by the molecular structure. Therefore, the light
scattering technique provides information about molecular structure and orienta-
tion. Typically, spherulite structures in crystalline polymers are characterized by
complementary
SALS
and polarized light microscopy, where the scattering angle in
the
SALS
pattern
is
used to determine the size
of
the spherulite. In a similar
approach, SAXS can be used to characterize the structure and dimensions
of
rigid
fillers or fibers in
a
thin polymer (Young et al., 1985).
2.3.1
I,
Measurement
of
contact angle
2.3.11.1.
Contact angle on aBat surface
Measurements of the contact angle are extremely useful for determining the
wettability
of
a solid surface by a liquid. Various techniques for measuring the
contact angle have been reviewed by Neumann and Good (1979) and Adamson
(1982).
The most commonly used method is to measure it directly from
a
drop of
liquid resting on a flat surface of the solid, that is the 'sessile drop method', as shown
in Fig. 2.19. Various techniques given in what follows can be employed in
conjunction with this method to measure accurately the contact angle
of
a liquid
droplet on a flat solid surface:
(i) Through a comparator microscope filled with a goniometer scale.
(ii) From photographs taken
at
an angle
so
that a portion
of
the liquid drop
is
reflected from the surface, the angle meeting the direct and reflected images then
being twice the contact angle.
(iii) A captive bubble method can be used wherein
a
bubble formed by
manipulation of a micrometer syringe is made to contact the solid surface.
(iv) From photographs of the bubble profile directly by means
of
a goniometer
tele-microscope (Adamson et al.,
1970).
This technique has the advantages that it
is easy
to
swell or shrink the bubble to obtain receding or advancing angles and
adventitious contamination can be minimized.
In addition to the sessile drop method which measures the contact angle directly,
Neumann and Renzow (1 969) have developed the Wilhelmy slide technique to
measure it to
0.1"
precision.
As
shown in Fig.
2.20,
the meniscus at a partially
immersed plate rises to a finite length,
h,
if the contact angle,
8,
is finite.
6
is
calculated from
Sessile
Drops
Sessite bubble
Fig. 2.19. Use
of
sessile
drops
or
bubbles
for
the determination
of contact
angles.
After
Adamson (1982).
Chapter
2.
Characterization
of
interfaces
35
-
-
-
-
-
Fig.
2.20.
Wilhelmy
slide
technique
for
contact angle measurement. After
Adamson
(1982).
(2.13)
where
a
is the capillarity constant. The termination
of
the meniscus is quite sharp
under proper illumination (unless
8
is
small), and
h
can be measured by means of a
traveling microscope.
2.3.11.2.
Contact angle
on
a
rough
surface
The foregoing discussion considers the wetting of a smooth planar surface. The
derivation for the contact angle equation given by
Eq.
(2.11) can be adapted
in
an
empirical manner to the case of a non-uniform solid surface, whether the surface is
rough (with a roughness index) or is a composite consisting of small patches of
various kinds. Details
of
this subject have been reviewed by Adamson (1982) and a
summary is given here.
Good (1952) showed that the surface roughness alone may change the advancing
contact angle,
Or,
on a rough surface, compared with the contact angle,
8,
on a
smooth surface of identical surface chemistry. This change in the contact angle can
be expressed by
cos
or
=
rf
cos
e
(2.14)
where
rf
is the roughness factor, which is the ratio of actual to nominal surface areas
of the solid.
If
8
is less than
90°,
then roughening will result in a smaller
8,
on
the
chemically equivalent but rough surface. This will increase the apparent surface
tension of the solid surface,
ysv.
In contrast, however, if for a smooth surface
0
is
greater than
90°,
roughening the surface will increase
Or
still further, leading to a
decrease
in
ysv
.
36
Engineered interfaces in
fiber
reinforced composites
2.3.11.3.
Contact angle on a cylindrical
surface
The techniques for measuring the contact angle of droplets on planar surfaces
have been discussed above. The measurement of the contact angle for wettability of
a cylindrical surface of the order of
10
pm in diameter as
for
advanced fibers
requires a more sophisticated approach than
is needed for a simple planar surface.
A
widely used method is based
on
the Wilhelmy balance method by use of gravimetry
(Kaelble et al., 1974; Hammer and Drzal,
1980).
The contact angle may be
determined by measuring the force required to immerse or remove a single fiber
from a liquid of known surface tension at constant velocity. Hammer and Drzal
(1980) determined the polar and dispersive components of a small diameter graphite
fiber by measuring the contact angle.
A single fiber was immersed in a liquid and the
force,
F,
exerted by the liquid on the fiber was measured with microbalance due to
the wetting
of
the fiber. The force,
F,
is related
to
the surface tension of the liquid,
yLv, by the equation
F
=
yLvnd
COS
e
,
(2.15)
where
d
is the fiber diameter. The polar and dispersive components
of
the fiber
surface tension,
(7:
and
7:)’
are determined based on the following equation:
(2.16)
A
plot of
yL
(1
+
cos e)/2(yt)1/2 versus
(y;/yt)li2
will yield
a
straight line with the
slope and intercept providing a solution for the components
yg
and
$,
respectively,
for the fiber.
A simple and direct method of contact angle measurement has also been proposed
(Yamaki and Katayama, 1975; Carroll, 1976) by observing the shape of the liquid
droplet attached to a single fiber, the so-called ‘droplet aspect ratio method’. The
liquid is assumed to form a symmetrical droplet about the fiber axis as shown
schematically in Fig.
2.21.
Neglecting the effect of gravity, the droplet shape can be
defined by the following expression:
J5
=
2b
F(4,K)
+
nE(4,41
I
(2.17)
where the parameters are:
e
L=-,
XI
(2.18)
(2.19)
(2.20)
Chapter
2.
Characterization
of
interfaces
37
K
=
dl
-
(!y
(2.21)
=
sin-ld-
n2
-
1
.
n2
-
a2
(2.22)
F(4,
K)
and
E($,
K)
are elliptical integrals of the first and second kind, respectively.
n
can be plotted versus
L
for a range of small values of contact angle,
8.
By
measuring the relative dimensions of the droplet,
XI
and
x2,
as illustrated in
Fig. 2.21,
8
can then be evaluated (Carroll, 1976).
Nardin and Ward (1987) successfully used this method to evaluate surface
treatment for polyethylene fibers.
A
linear correlation was observed between the
fiber
ys
measured by this method using a glycerol contact angle and the interfacial
shear strength measured from fiber pull-out tests for chemically treated fibers.
Wagner and coworkers (Wagner, 1990; Wagner et al., 1990) extended the droplet
aspect-ratio method by introducing
a
computer program based on an initial estimate
of
8,
which allows the above equations to be solved iteratively, giving a more
accurate value of
8.
Experimental evidence on composite materials has shown that the methods of
contact angle measurement are useful in detecting changes in carbon fiber surface
energy due
to
oxidative treatments, which can enhance the composite interlaminar
shear strength
(ILSS).
The surface energy values increase with increasing surface
concentrations of oxygen and nitrogen-containing groups, as determined from
AES
and corresponding
ILSS
of the composite laminates (Gilbert et al.,
1990),
as shown
in Table 2.7. In a similar study, differences in wetting behavior of sized/unsized and
surface treated/untreated carbon fiber immersed in a number of different thermo-
plastics (Weinberg,
1987) as well
as
in commercial silicon oil and epoxy resin (Lee
et al., 1988) were observed by a wettability study. There is excellent correlation
between the contact angle and composite transverse flexural strength for carbon
fiber-PEEK matrix composites (Bucher and Hinkley, 1992).
In contrast to carbon fibers, no simple correlation has been reported between the
work of adhesion to various polymer resins determined from the contact angle
'I
-
Fiber'
Fig.
2.21.
A
liquid droplet
attachcd
to
a
monofilament.
Gilbert
et
al.
(1990).
38
Engineered interfaces in fiber reinforced composites
Table 2.7
Interlaminar shear strength
(ILSS),
AES atomic percent, contact angle,
0,
and surface energy,
ys.
data for
untreated and electrochemically oxidized pitch-based carbon fiber"
Carbon fiber
ILSSb
(MPa) AES atomic
YO
at
the surface
0
("/glycerol) ysv (mJ/m2)
0
N
LM untreated
58 2.4
0.5
57.8 40.6
PTC treated
72
5.1
3.2 42.3 49.4
IM untreated
39
1.5
0
57.2 41.1
PTC treated
56' 6.9 3.4 35.4 53.0
HM untreated
36
2.9
0
62.4 38.3
PTC treated
52' 9.3 2.4 43.0 48.9
"After Gilbert et al. (1990).
bCompression/tension failure in the short beam shear test.
measurement and the amount of silane coating applied to the glass fibers (Berger
and Eckstein,
1984;
Weinberg
1987).
This
is
apparently because good wetting
is
not
the primary mechanism for improved adhesion for these fibers. This
also
suggests
that predictions about the work
of
adhesion should be limited to non-reactive
systems, where no chemical bonds dominate the adhesion at the fiber-matrix
interface.
References
Adamson, A.W. (1982). In
Physical Chemistry ofSurfaces,
4th Edition, John Wiley and Sons, New York,
Adamson, A.W., Shirley, F.P. and Kunichika, K.T. (1970). Contact angle on molecular solids.
J.
Colloid
Interface Sei.
34,
461468.
Amateau, M.F. (1976). Progress in the development of graphite-AI composites using liquid infiltration
technology.
J, Composite Mater.
10,
289-296.
Baillie, C.A., Castle, J.E., Watts, J.F. and Bader,
M.G.
(1991). Chemical aspects
of
interface adhesion
between electrolytically oxidised carbon fibers and epoxy resins. In
Proc.
ICCM/S,
Composites Design,
Manufacture and Application.
(S.W. Tsai and
G.S.
Springer, eds.), SAMPE Pub. Paper 11E.
Becher, P.F. and Tiegs, T.N. (1987). Toughening behavior involving multiple mechanisms: whisker
reinforcement and zirconia toughening.
J.
Am.
Ceram.
Soc.
70, 651-654.
Berger, E.J. and Eckstein, Y. (1984). In
Adhesive Joints
(Mittal, K.L.
ed.),
Plenum Press, New York,
p. 51.
Blackburn, L.D., Herzog, J.A., Meyerer, W.J., Snide, J.A., Stuhrke,
W.F.
and Brisbane,
A.W.
(1966).
MAMS internal study on metal matrix composites, MAM-TM-66-3.
Bucher,
R.A.
and Hinkley, J.A. (1992). Fiber/matrix adhesion in graphite/peek composites.
J.
Thermoplastic Composite Mater.
5,
2-13.
Buxton, A and Baillie, C.A. (1995). Predicting the behavior of the carbon-fiber/epoxy interface under
different service conditions.
Composite Interfaces
3,
41 1423.
Carroll, B.J. (1976). Thc accurate measurement of contact angle, phase contact areas, drop volume, and
Laplace excess pressure in drop-on-fiber system.
J.
Colloid. Interface Sei.
57,
488495.
Castle, J.E. and Watts, J.F. (1988). The study of interfaces in composite materials by surface analytical
techniques. In
Interfaces in Polymer, Ceramic and Metal Matrix Composites (Proc.
ICCI-11)
(H. Ishida
ed.),
Elsevier Science, New York, pp. 57-71.
pp. 294-3 18, 332-268.