greg morris candlestick charting explained pdf phần 6 ppsx
Bạn đang xem bản rút gọn của tài liệu. Xem và tải ngay bản đầy đủ của tài liệu tại đây (1.48 MB, 15 trang )
Chapter 3
Scenarios and Psychology Behind the Pattern
The market has been trading lower, as evidenced by another long black
day. The next day, prices open higher, trade still higher, and then close at
the same price as before. This is a classic indication of short-term support
and will cause much concern from any apathetic bears who ignore it.
Apathetic bears are short the market, and quite comfortable with their short
position. If they ignore the Matching Low as a possible trend reversal, it
will cause them much concern.
An interesting concept is presented with this pattern. The psychology
of the market is not necessarily with the action behind the daily trading,
but with the fact that the trading closes at the same price on both days.
Reversal candle Patterns
Related Patterns
The Matching Low closely resembles the Homing Pigeon pattern, but,
because the closes are equal, the second day does not quite fit the defini-
tion of being engulfed.
Examples
Figure 3-124
Pattern Flexibility
The length of the bodies of the two days may be either long or short
without affecting on the meaning of the pattern.
Pattern Breakdown
Figure
3-123
The Matching Low pattern reduces to a long black line, which is usually
bearish (Figure 3-123). Confirmation would be highly recommended.
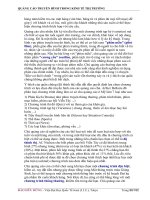
Continuation patterns are included in a separate chapter from reversal pat-
terns only to make later reference easier. Keep in mind that once a pattern
has been identified, it is suggesting a direction for future price movement.
It really doesn't matter if that future price movement is the same as before
or a reversal. Continuation patterns, according to the Sakata Method, are a
time of rest in the market. Whatever the pattern, you must make a decision
your current position, even if that decision is to stay where you are.
The format of discussion for this chapter is identical to that of the
previous chapter on reversal candle patterns. In condensed form, that for-
mat is
Pattern name
Japanese name and interpretation
Commentary
raphic of classic pattern(s)
uies of recognition
cenarios / psychology behind the pattern
attern flexibility
Continuation Patterns
Upside Tasuki cap
and Downside Tasuki Gap
(uwa banare tasuki and shita banare tasuki)
Confirmation is recommended.
Figure 4-2
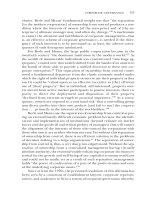
e typical Tasuki line occurs when the price opens lower from a white
,and then closes lower than the previous day's low. When the price
is higher from a black day's close and then closes higher than its high
ie opposite case. Tasuki lines are mentioned in a number of sources of
estick literature, but they do not contribute enough to be considered
dividual patterns. A Tasuki is a sash for holding up sleeves. The
i Gaps involve the Tasuki line after a gap in the direction of the
nt market trend.
Upside Tasuki Gap (Figure 4-1) is a white candlestick which has
d above the previous white candlestick, then followed by a black
icstick that closes inside that gap. This last day must also open inside
Chapter 4
the second white day's body. An important point is that the gap made
between the first two days is not filled. The philosophy is that one should
go long on the close of the last day. The same concept would be true in
reverse for a Downside Tasuki Gap (Figure 4-2).
Rules of Recognition
1. A trend is under way, with a gap between two candlesticks of the
same color.
2. The color of the first two candlesticks represents the prevailing
trend.
3. The third day, an opposite-color candlestick opens within the body
of the second day.
4. The third day closes into the gap but does not fully close the gap.
Scenarios and Psychology Behind the Pattern
The psychology behind a Tasuki Gap is quite simple: Go with the trend of
the gap. The correction day (the third day) did not fill the gap and the
previous trend should continue. This is looked upon as temporary profit
taking. The Japanese widely follow gaps (windows). Therefore, the fact
that the gap does not get filled or closed means that the previous trend
should resume.
The literature is sometimes contradictory on gaps. One normally ex-
pects a gap to provide support and/or resistance. The fact that the gap is
tested so quickly is reason to believe that the gap may not provide its usual
analytic ability.
continuation Patterns
Pattern Flexibility
The first day's color is not as important as the color of the second and third
days. It is best that it be the same color as the second day, which would
fully support the ongoing trend.
The Upside Tasuki Gap pattern reduces into a long line with a white body
at the lower end (Figure 4-3). The only support here can be in the fact that
the breakdown is a long white line which is normally considered bullish.
The Downside Tasuki Gap reduces to a long black line which is usually
bearish. Because of the lack of strong support, further confirmation is
recommended.
Related Patterns
The Tasuki lines by themselves are somewhat opposite of the Piercing
Line and the Dark Cloud Cover, which are reversal patterns. The Upside
and Downside Tasuki Gap patterns are very similar to the Upside and
Downside Gap Three Methods patterns discussed later in this chapter. You
Chapter 4
Continuation Patterns
will see that they are also in direct conflict with each other. It might be
best to see the statistical results of the pattern testing in later chapters.
Figure
4-5B
Commentary
w nhi means "in a row" and narabiaka means "whites in a row." The
CmeJTlklture
refers
to
Side-by-Side
Lines,
both
black
and
white,
but
Japanese literature
r
themselves. The
nnlv indicates a pause or a staiemaie wncu uicy <uc uj
only
maiwic
y ^ ^^
lfaes
^^
haye
d m the
pattern of importance ncic
direction of the current trend.
Continuation Patterns
Bullish Side-by-Side White Lines
Two white candlesticks of similar size are side-by-side after gapping
above another white candlestick. Not only are they of similar size, but the
opening price should be very close. The Bullish Side-by Side White Lines
(Figure 4-6) is also referred to as an Upside Gap Side-by-Side White Lines
(uwappanare narabiaka).
Bearish Side-by-Side White Lines
Side-by-Side White Lines which gap to the downside are very rare. These
are also called Downside Gap Side-by-Side White Lines (Figure 4-7).
Despite what appears to be obvious, these two white lines are looked upon
as short covering. This action, like many continuation patterns, represents
the market taking a rest or buying time.
It would be a normal expectation to have two Side-by-Side Black Lines
for this continuation pattern. A downside gap to Side-by-Side Black Lines
would certainly indicate a continuation of the downtrend. This pattern,
however, is not of much use because it portrays the obvious. Another
derivation of these lines would be Side-by-Side White Lines which do not
gap, but are in an uptrending market. These are called Side-by-Side White
Lines in Stalemate (Hdzumari narabiaka). These indicate that the market is
approaching its top and with limited support.
Rules of Recognition
1. A gap is made in the direction of the trend.
2. The second day is a white candle line.
3. The third day is also a white candle line of about the same size and
opens at about the same price.
Chapter 4
Scenarios and Psychology Behind the Pattern
Bullish Side-by-Side white Lines
The market is in a uptrend. A long white candlestick is formed, which
further perpetuates the bullishness. The next day, the market gaps up on
the open and closes still higher. However, on the third day, the market
opens much lower, in fact, as low as the previous day's open. The initial
selling that caused the lower open ends quickly and the market climbs to
yet another high. This demonstrates the force behind the buyers, and the
rally should continue.
Bearish Side-by-Side White Lines
A downtrend is further enhanced with a long black candle line followed by
a large downward gap open on the next day. The market trades higher all
day, but not high enough to close the gap. The third day opens lower, at
about the same open as the second day. Because of the resistance to further
downside action, shorts are covered, causing the third day also to rally and
close higher, but again not high enough to close the gap. If enough short
covering was accomplished and the rally attempt was not very convincing,
the downtrend should continue.
Pattern Flexibility
Because Side-by-Side White Lines are used only after gapping, there is not
much flexibility in this pattern. The two white lines should be of similar
body length, but this length is not as important as the fact that they gapped
in the direction of the trend. Their open prices should be close to the same,
though.
Continuation Patterns
The Upside Gap Side-by-Side White Lines reduce to a long white candle-
stick which fully supports the bullish continuation (Figure 4-8). The
Downside Gap Side-by-Side White Lines reduce to a black candlestick
with a long lower shadow (Figure 4-9). This single candle line does not
fully support the bearish continuation and suggests further confirmation.
Related Patterns
There are no patterns comparable to the Side-by-Side White Lines. The
Breakaway pattern has some similarities in that the second and third days
gap in the direction of trend.
continuation Patterns
Chapter 4
Rising Three Methods
and Falling Three Methods
(uwa banare sanpoo ohdatekomi and shita banare sanpoo ohdatekomi)
No confirmation is required.
Figure 4-12
Commentary
The Three Methods (Chapter 5) include the bullish Rising Three Methods
and the bearish Falling Three Methods. Both are continuation patterns that
represent breaks in the trend of prices without causing a reversal. They are
days of rest in the market action and can be used to add to positions, if
already in the market.
Rising Three Methods
A long white candlestick is formed in an uptrend (Figure 4-11). After this
long day, a group of small-bodied candlesticks occur which show some
resistance to the previous trend. These reaction days are generally black,
but most importantly, their bodies all fall within the high-low range of the
first long white day. Remember that the high-low range includes the shad-
ows. The final candlestick (normally the fifth day) opens above the close
of the previous reaction day and then closes at a new high.
Continuation Patterns
Falling Three Methods
The Falling Three Methods pattern is the bearish counterpart of the Rising
Three Methods pattern. A downtrend is underway, when it is further per-
petuated with a long black candlestick (Figure 4-12). The next three days
produce small-body days that move against the trend. It is best if the
bodies of these reactionary days are white. It is noted that the bodies all
remain within the high-low range of the first black candlestick. The next
and last days should open near the previous day's close and then close at
a new low. The market's rest is over.
Rules of Recognition
1. A long candlestick is formed representing the current trend.
2. This candlestick is followed by a group of small real body candle-
sticks. It is best if they are opposite in color.
3. The small candlesticks rise or fall opposite to the trend and remain
within the high-low range of the first day.
4. The final day should be a strong day, with a close outside of the
first day's close and in the direction of the original trend.
Scenarios and Psychology Behind the Pattern
The concept behind the Rising Three Methods comes from early Japanese
futures trading history and is a vital part of the Sakata Method. The Three
Methods pattern is considered a rest from trading or a rest from battle. In
modern terminology, the market is just taking a break. The psychology
behind a move like this is that some doubt creeps in about the ability of the
trend to continue. This doubt increases as the small-range reaction days
take place. However, once the bulls see that a new low cannot be made,
the bullishness is resumed and new highs are set quickly. The Falling
Three Methods pattern is just the opposite.
Chapter 4
Continuation Patterns
Pattern Flexibility
Because this pattern normally consists of five candle lines, it is somewhat
rare to find in its classic form. Some leeway can be allowed in the range of
the reaction days. They may go slightly above or below the range of the
first day. It is best, if this is allowed, that they cover the range of the first
day completely. If they do not and tend in one direction, the pattern can
become a Mat Hold pattern, if it occurs in an uptrend.
The Rising Three Methods pattern reduces to a long white candlestick,
which fully supports the bullish continuation (Figure 4-13). The Falling
Three Methods pattern reduces to a long black candlestick, which fully
supports the bearish continuation (Figure 4-14).
Examples
Figure
4-15A
Related Patterns
A pattern similar to the bullish Rising Three Methods is the Mat Hold
pattern. It is also a bullish continuation pattern but allows greater flexibil-
ity in the reaction days. That is, the small black days that are between the
two long white days do not have to be within the range of the first white
day. These reaction days are generally higher relative to the first candle-
stick. Seeing the two patterns side-by-side will show that the uptrend was,
and is, much stronger for the Mat Hold pattern.
Chapter 4
Figure
4-158
Continuation Patterns
Separating Lines
(iki chigai sen)
Confirmation is required, especially for the bullish case.
Commentary
The Separating Lines have the same open and are opposite in color. They
are similar, but opposite of the Meeting Lines. The second day of these
patterns is a Belt Hold candlestick. The bullish pattern (Figure 4-16) has a
white bullish Belt Hold and the bearish pattern (Figure 4-17) has a black
bearish Belt Hold. Ikichigaisen means lines that move in opposite direc-
tions. Sometimes these are called Dividing (furiwake) Lines.
Rules of Recognition
1. The first day is the opposite color of the current trend.
2. The second day is the opposite color of the first.
Chapter 4
3. The two bodies meet in the middle, at the open price.
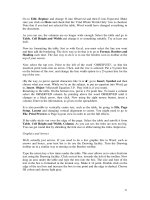
Scenarios and Psychology Behind the Pattern
An uptrend is in place when a long black day occurs. This is not normal
for a strong market and will produce some skepticism. However, the next
day opens much higher, in fact, it opens at the previous black day's open-
ing price. Prices then move higher for the rest of the day and close higher,
which suggests that the prior uptrend should now continue. This scenario
is for the bullish Separating Line; the bearish scenario is quite similar, but
opposite.
Pattern Flexibility
Separating Lines should each be long lines: however, there is no require-
ment that this be so. Strong furiwake lines would be two long bodies
without any shadows (marubozu) at the points where they meet.
Continuation Patterns
indecision in the market and therefore does not fully support the bullish
continuation of this pattern. The bearish Separating Lines pattern reduces
to a candle line with a black body near the lower portion of the range
(Figure 4-19). This line can be considered bearish and therefore supports
the bearish continuation pattern.
Related Patterns
The Meeting Lines, which are not continuation, but reversal patterns, are
similar in concept.
Examples
Figure 4-20A
The bullish Separating Lines pattern reduces to a Long-Legged Doji line
(Figure 4-18). A Doji, and especially the Long-Legged Doji, represents
Chapter 4
Figure 4-20B
Continuation Patterns
Mat Hold
(uwa banare sante oshf)
Bullish continuation pattern.
No confirmation is required.
Figure 4-21
Commentary
The Mat Hold pattern is a modified version of the Rising Three Methods.
The first three days start out like the Upside Gap Two Crows, with the
exception that the second black body (third day) dips into the body of the
first long white day (Figure 4-21). This is followed by another small black
body that closes even lower, but still within the range of the first white
body. The fifth day sees a large gap opening, with a strong rise to a close
above the high of the highest of the three black days. This suggests that the
trend will continue upward and that new positions can be taken here.
The Mat Hold Pattern shows greater strength as a continuation signal
than the Rising Three Methods. The reaction days are basically higher than
the ones in the Rising Three Methods. In other words, the Mat Hold does
not take quite the rest, or break from trend, that the Rising Three Methods
does.
Chapter 4
Rules of Recognition
1. A long white day is formed in an uptrending market.
2. A gap up with a lower close on the second day forms almost a
star-like day.
3. The following two days are reaction days similar to the Rising
Three Methods.
4. The fifth day is a white day with a new closing high.
Scenarios and Psychology Behind the Pattern
The market is continuing its rise, with a long white day confirming the
bullish action. The next day prices gap open and trade in a small range,
only to close slightly lower. This lower close (lower than the open) is still
a new closing high for the move. The bulls have only rested, even though
the price action surely brings out the bears. The next couple of days cause
some concern that the upward move may be in jeopardy. These days open
about where the market closed on the previous day and then close slightly
lower. Even by the third such day, the market is still higher than the open
of the first day (a long white day). An attitude that a reversal has failed
develops and prices rise again to close at a new closing high. This fully
supports the bulls' case that this was just a pause in a strong upward trend.
Pattern Flexibility
The arrangement of the three small black days should show consecutive
declines, much like the Rising Three Methods. The reaction days are alto-
gether higher than those in the Rising Three Methods.
Continuation Patterns
Pattern Breakdown
The bullish Mat Hold pattern reduces to a long white candlestick, which
fully supports its bullish continuation (Figure 4-22).
Figure
4-22
Related Patterns
Rising Three Methods is a more rigid pattern. Even though this pattern
begins somewhat like the Upside Gap Two Crows, the closing of the third
day into the body of the first day eliminates that possibility. One must also
be on guard for a possible Three Black Crows pattern starting with the
second day, especially if it is a long day.
Continuation Patterns
Three-Line Strike
(sante uchi karasu no bake sen)
Confirmation is definitely required.
commentary
Bullish Three-Line Strike
This is a four-line pattern that appears in a defined trend. It can be looked
upon as an extended version of either the Three Black Crows pattern
(bearish) or the Three White Soldiers pattern (bullish). This pattern is a
resting or pausing pattern; the rest is accomplished in only one day. Breaks
in trend are almost always healthy for the trend. Some Japanese literature
refers to this pattern as the Fooling Three Crows for the bearish version.
The bullish case could also be called Fooling Three Soldiers.
Three white days with consecutively higher highs are followed by a long
black day (Figure 4-24). This long black day opens at a new high and then
plummets to a lower low than the first white day of the pattern. This type
of action completely erases the previous three-day upward march. If the
previous trend was strong, this should be looked upon as just a setback