Báo cáo y học: "A comparative analysis of DNA methylation across human embryonic stem cell lines" docx
Bạn đang xem bản rút gọn của tài liệu. Xem và tải ngay bản đầy đủ của tài liệu tại đây (737.27 KB, 12 trang )
RESEARCH Open Access
A comparative analysis of DNA methylation
across human embryonic stem cell lines
Pao-Yang Chen
1,2
, Suhua Feng
1
, Jong Wha Joanne Joo
3
, Steve E Jacobsen
1,4,5*
and Matteo Pellegrini
1,5,6*
Abstract
Background: We performed a comparative analysis of the genome-wide DNA methylation profiles from three
human embryonic stem cell (HESC) lines. It had previously been shown that HESC lines had significantly higher
non-CG methylation than differentiated cells, and we ther efore asked whether these sites were conserved across
cell lines.
Results: We find that heavily methylated non-CG sites are strongly conserved, especially when found within the motif
TACAG. They are enriched in splice sites and are more methylated than other non-CG sites in genes. We next studied
the relationship between allele-specific expression and allele-specific methylation. By combining bisulfite sequencing
and whole transcriptome shotgun sequencing (RNA-seq) data we identified 1,020 genes that show allele-specific
expression, and 14% of CG sites genome-wide have allele-specific methylation. Finally, we asked whether the
methylation state of transcription factor binding sites affects the binding of transcription factors. We identified variations
in methylation levels at binding sites and found that for several transcription factors the correlation between the
methylation at binding sites and gene expression is generally stronger than in the neighboring sequences.
Conclusions: These results suggest a possible but as yet unknown functional role for the highly methylated
conserved non-CG sites in the regulatio n of HESCs. We also identified a novel set of genes that are likely
transcriptionally regulated by methylation in an allele-specific manner. The analysis of transcription factor binding
sites suggests that the methylation state of cis-regulatory elements impacts the ability of factors to bind and
regulate transcription.
Background
Epigenetic regulation, such as cytosine DNA methylation,
is important in gene regulation. Inappropriate methyla-
tion and silencing of tumor suppressor genes, and the
inappropriate loss o f DNA methylation of oncogen es,
have been recognized in recent years as key factors in the
development of cancer [1]. DNA methylation changes are
also critical in the differentiation of cells, as seen for
example in embryonic stem cells (ESCs) [2].
It is possible that D NA met hylation mediates thes e
effects by altering interactions between transcription
factors (TFs) and DNA. TFs bind to specific sequences
on DNA (that is, TF binding sites (TFBSs)) to initiate
transcription [3]. DNA methylation may regulate transcrip-
tional programs by directly impacting the binding of TFs
to DNA, although to date there is little direct evidence of
this. However, it is thought that promoter CpG islands are
generally unmethylated to facilitate DNA binding with
transcription factors [4], and changes of methylation at
promoter CpG islands can directly influence gene expres-
sion levels. It has also been shown that several cis-regula-
tory elements can directly influence the methylation of
CpG islands within the promoter regions [5,6]. Nonethe-
less, genome-wide relationships between TF activities and
the methylation state of cis-regulatory elements have to
date not been convincingly established.
One aspect of DNA methylation-induced transcrip-
tional regulation that has been extensively studied is
allele-specific transcription from either the maternal or
paternal chromo somes [7]. Some of these allele-specific
events may be regulated by DNA methylation though
mechanisms such as imprinting [8], inactivation of ×
chromosomes [9], or non-imprinted allele-specific
methylation [10]. Imprinting leads to the expression of
* Correspondence: ;
1
Department of Molecul ar, Cell, and Developmental Biology, University of
California, Los Angeles, CA 90095, USA
Full list of author information is available at the end of the article
Chen et al. Genome Biology 2011, 12:R62
/>© 2011 Chen et al.; licensee BioMed Central Ltd. This is an open access article distributed under the terms of the Creative Commons
Attribution License (http://creati vecommons.org/licenses/by/2.0), which p ermits unrestricted use, distribution, and reproduction in
any medium, provided the original work is properly cited.
only the paternal or maternal allele, depending on the
locus. A recent study on the mouse brain reported that
more than 1,300 loci are affected by the parent-of-origin
allelic effect [11] and are candidates for imprinted
genes. In addition, it has also been reported that about
10% of all human genes are regulated by non-imprinted
allele-specific methylation [10]. The allele-specific
methylation of these genes is associated with genetic
polymorphisms and may also correlate with allele-speci-
fic expression. Other allelically imbalanced genes have
been shown to have random mono-allelic expression
[12]. It is estimated that one-third of these genes with
random mono-allelic expression are d etermined b y
alleles rather than parent of origin and are likely to be
regulated by cis-acting factors [13,14]. Nonetheless, to
date it has not been possible to simultaneously study
allele-specific methylation and trans criptio n in a single
sample, and therefore the degree to which these are
related is still not known.
DNA methylation-driven transcriptional regulation is
known to play a significant role in the establishment of
cell ular differentiation program s. To investigate the role
of DNA methylation in these cellular programs, several
studies have reported the comparisons of methylation
profiles between ESCs (or multipotent progenitors) and
differentiated cells [15-18] and induced pluripotent stem
cells [19,20]. These vertical comparisons provide valu-
able insights into the dynamic changes of methylation in
development. For example, they reported that non-CG
methylation is present at low levels in human ESCs
(HESCs), but disappears upon induction of differentia-
tion of the ESCs, and is restored in induced pluripotent
stem cells [15], suggesting there may be a functional
role for non-CG methylation in pluripotent stem cells.
However, less is known about the conservation and
variability of DNA methylation across different stem cell
lines. A recent analysis of about 1% of the genome of
HESC lines shows that, by monitoring DNA methylation
and gene expression, it is possible to identify cell line-spe-
cific defects that could interfere with their differentiation
or the functional properties of derived cell types [19].
Using genome-wide bisulfite sequencing (BS-seq) [21], we
have recently determined the DNA methylation profile of
the human embryonic stem cell line HSF1 [22]. BS-seq is
able to generate genome-wide DNA methylation pro files
at single base resolution, much improved from previous
profiling methods limited by low resolution [23,24] or
sequence-specific biases [25]. Here we report a compari-
son of the methylation profile of HSF1 with those from
two other HESC lines: H1 [15] and H9 [16] (also known
as WA09). We are for the first time able to address ques-
tions about the conservation of methylation at non-CG
sites across HESC lines. Furthermore, we have developed
a novel approach to measure allele-specific expression by
combining BS-seq and RNA-seq data from the same sam-
ple. RNA-seq provides digital measurement of transcrip-
tion at single base resolution, and thus allows us to
perform genome-wide scans for mono-allelically expressed
genes by as sociating ex onic SNPs (detected from BS-seq
data) with their allelic expression levels (from RNA-seq).
From BS-seq data we also identified CG sites that are dif-
ferentially methylated between the two chromosomes,
resulting in allele-specific methylation. Hence, we can
identify genes with allele-specific expression and methyla-
tion. Using our methodology, we found that one-third of
the genes have allele-specific expression, and identified a
set of differentially methylated genes that are enriched for
allele-specific expression. Finally, we measured the methy-
lation levels at TFBSs throughout the genome and corre-
lated them with gene expression levels. We were able to
compare the methylation levels at the same binding site
across all three cell lines. We identified several factors that
show significant correlation that are even more correlated
at the binding sites than the neighboring sequences, sug-
gesting for the first time that their binding affinities are
directly regulated by the methylation of cis-regulatory
elements
Results
We aligned bisulfite converted reads from the HSF1, H1
and H9 cell lines using BS Seeker [26] to reduce any
mapping bias that might have been caused by different
mapping approaches used in the original publications
(see Materials and methods). We mapped 684 million,
763 million and 792 million reads to unique positions in
the genome for HSF1, H1 and H9 with an average cov-
erage of 10x, 20x, and 16x, respectively (Table S1 in
Additional file 1). Methylation levels at each cytosine
were determined by measuring the ratio of Cs to Cs
plus Ts that align to each genomic cytosine. The data
can be browsed through at [27].
Global methylation differences
We compared global methylation levels between the three
cell lines. We estimat e average meth ylation levels across
the genome (that is, the chance that a cytosine is methy-
lated) by computing the mean value of the number of
methylated reads over the total number of reads mapped
to each cytosine. For these estimates we consider only
cytosines that are covered by at least four reads. As
expected, most CG sites are highly methylated (see Table 1
for global methylation levels). From the histogram of
methylation levels (Figure S1 in Additional file 1), we
observe a bimodal distribution of methylation, which indi-
cates a significant part of CG sites are weakly methylated.
In contrast, non-CG sites are generally not methylated or
weakly methylated, although their methylation levels vary
depending on the adjacent nucleotides. Interestingly , we
Chen et al. Genome Biology 2011, 12:R62
/>Page 2 of 12
observe significant differences in the global methylation
levels between cell lines; the CG methylation level is high-
est in H1 at 85%, followed by HSF1 at 75%, and lowest in
H9 at 72%. A similar trend is also observed for non-CG
methylation. The differences in methylation levels may be
due to a combination of effects, such as the unstable
dynamic gain and loss of methylation reported in ESCs
[28,29], and protocol- and lab-specific differences between
the data sets (for example, passage number in Table S1 in
Additional file 1).
We performed a genome-wide screen for regions that
are differentially methylated between pairs of cell lines,
and identified between 1.4 a nd 2% of the genome that is
significantly differentially methylated at CG sites. Of these
regions, 6% are overlapping between the three cell lines
(false discovery rate (FDR) = 0.5%; see Materials and
methods). The se overlapping differ entially methylated
regions are enriched in promoters, exons, and most signifi-
cantly in CpG islands (Figure S2a in Additional file 1). The
overlapping differentially methylated CHG (where H is A,
TorC)regionsaremostenrichedinexons,andCpG
islands (Figure S2b in Additional file 1). This result con-
trasts with previous reports that concluded that CpG
islands did not h ave significant methylation variability
across samples, which was primarily constrained to the
shores of the islands [30]. Both promoter CG methylation
and non-CG methylation within genes have been reported
to correlate with gene expression [6,15]. Thus, the enrich-
ment of differential methylation in these regions m ay
influence transc riptional rates, although a direct causal
connection cannot be established with our data. Figure
S3a in Additional file 1 shows that, as expected, signifi-
cantly differentially methylated CpG islands are negatively
correlated with gene expression (see Additional file 2 for
lists of associated genes). The correlation in CpG island
shores is, however, less clear (Figure S3b in Additional file
1). An analysis of the gene ontology terms for genes asso-
ciated with these differentially methylated CpG islands
shows that their functions are enriched for transcription
regulation, neuron differentiation, and genetic imprinting
(via David bioinformatics resources [31]).
Lowly methylated CG sites are conserved
The recent analysis of methylomes has shown that
unlike differentiated cells, HESC lines have significant
levels of non-CG methylation that account for up to
25% of all methylated cytosines. Whether these methy-
lated non-CG sites are c onserved across diff erent lines
was not previously known. We c omputed the conserva-
tion of methylation by carrying out pairwise compari-
sons of the three cell lines at single base resolution. The
conserved and unconserved sites are defined as those
that have either concordant or discordant methylation
levels between the cell lines. Cytosines were categorized
into three groups according to their methylation levels.
For CG sites, the grouping is low methylation (0 to
33%), median methylation (34 to 66%), and high methy-
lation (67 to 100%), while for non-CG sites the groups
are no methylation (0%), l ow methylation (0 to 3 0%),
and high methylation (31 to 100%). The cutoff values
for CG methylation are higher than non-CG because
CG sites are significantly more methylated than non-CG
sites, and their distributions of methylation levels ar e
bimodal. The methylation at a cytosine site is consid-
ered conserved i f this cytosine is categorized into
the same group in both cell lines; otherwise it is
unconserved.
The number of cytosines in the groups is compared to a
null model that assumes the independence of methylation
between the two cell lines. Thus, the more significant the
deviatio n between th e ob served data and the null model,
the more significant the conservation of methylation
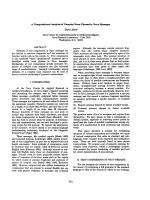
between the two cell lines. Figure 1a shows a summary of
the results from the three pairwise comparisons (see Fig-
ure S4 in Additional file 1 for the pairwise comparisons).
We find that lowly methylated CG sites and highly methy-
lated non-CG sites are strongly conserved. On average, 6%
of the CG sites are conserved in a low methylation state in
pairwis e comparisons of cell lines. These conserved sites
are enriched in promoter regions (Figure S5 in Additional
file 1) and CpG islands, which are generally demethylated.
TACAG sites are conserved and highly methylated
In contrast to CG sites, we find that only the highly
methylated non-CG sites are conserved across the three
ESC lines, while the poorly and non-methylated sites are
not. Overall, conserved highly methylated non-CG sites
are rare (only 0.2% of all non-CG sites) and are enriched
in genes (Figure S6 in Additional file 1).
We performed an analysis of the sequenc e motifs asso-
ciated with non-CG sites that are conserved highly methy-
lated, unconserved methylated, and unmethylated. The
unconserved methylated sites are those highly methylated
in one cell line and unmethylated in the others. We found
the motif TACAG is enriched in conserved highly methy-
lated non-CG sites, whereas unconserved but generally
methylated sites are enriched for CA (or less strongly CT)
(Figure 1b). Lister et al. [15] have previously reported that
the TACAG motif is enriched for methylation. Here we
Table 1 Methylation levels (percentage) of H1, HSF1 and
H9 cell lines in various genome contexts
HESC line CG CHG CHH CA CT CC CAG TACAG
H1 84.70 3.62 1.48 3.56 1.09 0.67 5.84 21.87
HSF1 74.96 2.99 1.39 2.76 1.14 0.93 4.38 12.96
H9 (WA09) 71.74 1.76 0.73 2.02 0.55 0.26 3.02 14.13
H = A, C, or T. In CC context, the reported values is based on the first C.
Chen et al. Genome Biology 2011, 12:R62
/>Page 3 of 12
further establish that the ‘TA’ dinucleotide sitting immedi-
ately upstream of ‘CAG’ is typically observed with con-
served methylation, suggesting a strong methylation
preference holds across human ESC lines. The methyla-
tion level of TACAG sites is 22%, which is strikingly
higher than other non-CG contexts (for example, CHG is
3.6%, CA is 3.6% and CAG is 5.8%).
The TACAG motif is methylated at a cytosine that we
refer to as C HG (where H is A, T or C). CHG sites are
generally enriched in exons, and frequently o bserved at
splice sites. The methylation of CHGs is slightly higher
in exons than in introns (Figure S7 in Additional file 1).
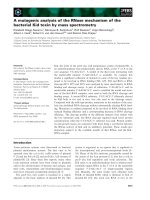
At the third position upstream of the 3’ splice site
where the sequence CHG is highly enriched (due to the
presence of the canonical acceptor sequences), we
observe high levels of methylation (Figure 2; Figure S8
in Additional file 1). More than 99% of the cytosines at
this position are in CAG sites, and 8% are in TACAG
motifs. Since CAG and TACAG sites are much more
methylated than all CHG sites, the methylation level at
this position is higher than the average found in introns
and the entire genome. A similar trend is also o bserved
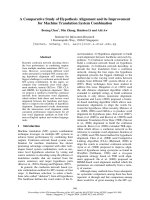
at 5’ splice sites (Figure S9 in Additional file 1). Since
CHG methylation is usually enriched in genes [15], we
found that CHG in splice sites is even more methylated
than other CHG sites within genes (Figure 3). While the
mechanistic connection between DNA methylation and
splicing is still not clear, Laurent et al. [16] also
reported high levels of CG methylation at the 3’ splice
sites. Furthermore, we found that, in all cell lines,
(a)
(b)
Unconser ved methylated Unmethylated
0
5
10
15
20
25
30
High methylation Low (median)
methylation
No (low)
methylation
Discordant
methylation
Conserved Unconserved
Fold increase
Methylation Group
CG
Non-CG
Conser ved methylated
Figure 1 Conservatio n and DNA methylation of C G and non-CG sites. (a) Fold enrichment of CG and non-CG sites grouped by their
methylation and conservation. (b) Sequence motifs for ‘conserved highly methylated’, ‘ unconserved methylated’ and ‘ unmethylated’ non-CG
sites. The motifs show the averaged result from the pairwise comparisons between the three cell lines.
Chen et al. Genome Biology 2011, 12:R62
/>Page 4 of 12
alternatively spliced exons have lower CG and non-CG
methylation compared to interior ex ons (Figure S10 in
Additional file 1), suggesting that a relationship may
exist between methylation of exons and alternative
splicing.
Symmetry of CG and non-CG methylation
In mammals, DNA methylation is established b y the de
novo methyltransferase DNMT3 [32-34] during early
embryogenesis. The maintenance methyltransferase
DNMT1 methylates hemi-methylated CG sites during
DNA replication, lea ding to symmetrically methylated
CG sites [15,35]. Whether there is any mechanism for
recognizing hemi-methylated CHG sites and methylating
the other strand is still not known. To assess the sym-
metry of methylation at CG and CHG sites, we analyzed
two-by-two contingency table s containing t he methyla-
tion status of C and G (that is, C on the antisense
(a)
(b)
0%
1%
2%
3%
4%
5%
6%
7%
8%
9%
-20-19-18-17-16-15-14-13-12-11-10-9-8-7-6-5-4-3-2-112345678 91011121314151617181920
INTRON EXON
% highly methylated
CHG
Distance to 3' spliced site s
0
20000
40000
60000
80000
100000
120000
-20-19-18-17-16-15-14-13-12-11-10-9-8-7-6-5-4-3-2-112345678 91011121314151617181920
INTRON EXON
Counts of CHG
Distance to 3' spliced site s
Figure 2 Distribution of CHG sites at 3’ splice sites and their methylation levels. (a) Counts of CHG sites. (b) Percentage of highly
methylated CHG in 3’ splice sites.
4
7
25
11 11
31
0
5
10
15
20
25
30
35
CHG CA G T ACAG
Methylation level (%)
non splice site s splice si tes
Figure 3 Methylati on levels of non-CG sites within the gene
body in splice sites and non-splice sites.
Chen et al. Genome Biology 2011, 12:R62
/>Page 5 of 12
strand) as the two factors. Confirming previo us analyses
[15], we found that more than 77% of CG sites are sym-
metrically methylated on both strands, whereas o nly
about 0.2% of CHG sites are symmetrically methylated.
The observed counts in the table a re compared against
the expected values based on the assumption that
methylation at C and G is independent. Interestingly, we
found that, in all cell lines, the methylation in lowly
methylated CG sites (that is, < 30%) is much more sym-
metric (Figure S11 in Additional file 1) than expected,
which may be associated with the symmetric demethyla-
tion found within CpG islands [4]. On the other hand,
wefoundthatthesymmetric methylation at highly
methylated CHG sites (that is, > 30%) is observed signif-
icantly more than expected (Figure S12 in Additional
file 1). The symmetry of methylation in lowly methy-
lated CG and highly methylated CHG sites is consistent
with the observation that both these types of sites are
conserved across cell lines.
Allele-specific expression
We developed a novel methodology to study the relation-
ship between allele-specific transcription and methylation
on a genome-wide scale. To accomplish this, we inte-
grated the BS-seq data with RNA-seq data to first per-
form a genome-wide scan for genes with allele-specific
expression. Using BS-seq data from the H1 cell line, we
searched for genes that contain SNPs located within tran-
scribed regions (exonic SNPs; see Materials and methods
for details). Since bisulfite converted DNA creates ambi-
guities between cytosines and thymines, we discarded
reads with Cs and Ts that ma pped to Cs on either strand
of the genome. The two alleles in an exonic SNP arise
from differences between the two parental alleles. The
allele to which the majority of RNA-seq reads map (from
H1 RNA-seq data) is considered the major allele and the
other the minor allele (that is, highly expressed and lowly
expressed allele). Genes with allele-specific expression
may have significantly uneven numbers of RNA-seq
rea ds aligning to m ajor and minor alleles. In our dataset,
we found 7,109 exonic SNPs covering 3,704 genes. To be
called a SNP, a locus had to have a coverage of at least
eight reads, and a ratio between 0.5 and 0.6 for the major
allele. For each gene we calculated the probability that
the major and minor alleles a re unbalanced based on a
binomial test computed from the number of reads cover-
ing the major and minor alleles. For this test the null
hypothesis is that two a lleles are equally covered and
genes with P-values < 0.0027 (corresponding to a 1%
FDR) are deemed mono-allelically expressed. In total, we
identified 1,020 genes with allele-specific expression, or
28% of the total genes with at least one exonic SNP. The
full list of t hese genes with allele-specific expression is
available in Table S3 in Additional file 3.
The number of our predicted genes with allele-specific
expression is close to the number (1,306 loci) reported
in a recent genome-wide survey in mouse [11]. The per-
centage of our genes is close to the previously reported
value of 28% that were shown to have strong signals for
allelic imbalance in other studies [36]. Figure S13 in
Additional file 1 shows that, in general, the genes with
allele-specific expression have higher gene expression
levels than the genes without.
We obtained a list of 75 imprinted genes from the lit-
erature [37,38] that we expect to show allele-specific
expression (see Additional file 4 for a list of imprinted
genes). Of these, 14 were covered by our SNPs and
could therefore be analyze d using our binomial test. We
observed significant P-value scores for 7 of the 14
imprinted genes, confirming that the known imprinted
genes are enriched for allele-specific expression (P =
0.018, hypergeometric test). The other seven imprinted
genes failed to show significant enrichment in our list
due to low SNP coverage (only one or two SNPs), which
limits the power of our test.
Allele-specific methylation
We next searched for genes that are methylated in an
allele-specific manner, and asked whether these gene s
are associated with allele-specific expression. From our
analysis we do not know the paternal and maternal gen-
otypes, but can identify cytosines that are differentially
methylated between two parents, that is, the methylation
status may be high in the paternal chromosomes and
low in the maternal one (or vice versa). From the SNPs
weareabletoassignreadstooneofthetwoalleles.
The cytosines covered by these reads can be tested for
differential methylati on. A candidate cytosine is consid-
ered differentially methylated if the methylation levels
between the reads from th e two parents are significantly
different (see Materials and methods). Overall, we found
that 14% of the candidate cytosines are differentially
methylated (these sites are available through the genome
browser at [27]). Differentially methylated promoter sites
are difficult to detect because CG sites are generally
demethylated and also p romoter regions are small. We
searched for genes enriched with diffe rentially methy-
lated sites in three cell lines. As a result, we found 110
genes are significantly enriched wit h different ially
methylated cytosines in at least one cell line ( see Addi-
tional file 5 for the gene list). Of these, ten were found
in multiple cell lines and eight of these have at least one
exonic SNP and could b e tested for allele-specific
expression. Strikingly, we found that six of the eight
genes with allele-specific methylation also show allele-
specific transcription. We hypothesize that the allele-
specific expression of these genes is regulated by DNA
methylation, and that these genes may represent
Chen et al. Genome Biology 2011, 12:R62
/>Page 6 of 12
previously unknown imprinted genes. While most genes
with allele-specific expression are not enriched with
allele-specific methylation, many of them may still b e
transcriptionally regulated by a single site with allele-
specific methylation.
In order to b etter understand the distribution of dif-
ferentially methylated CG sites and its relationship with
allele-specific expression, we reconstructed the methyla-
tion status for the major and minor alleles of all genes.
We tested whether the segregation of the major and
minor alleles in the exonic SNPs results in two distinct
methylation patterns on each chromosome, one of
which is highly methylated and the other one unmethy-
lated (or weakly methylated). We were able to associate
methylation patterns at the CG sites with major and
minor alleles if the SNPs and the CG sites are spanned
by the same read (see Materials and methods).
We expect for genes showing both allele-specific
methylation and expression, the major forms arise from
one parental chromosome, and the minor from the
other. mir663 (HUGO Gene Nomenclature Committee
(HGNC) ID [HGNC:MIR663]) is found to have a cluster
of 12 differentially methylated CG sites located within
its gene body of 93 bp. Although with only one exonic
SNP, mir663 is not significant in our test of allele-speci-
fic expression. It has distinct methylation patterns
between the two parental chromosomes that can be
associated with allel e-specific expression (Figure 4), sug-
gesting one chromosome is fully methylated while the
other fully unmethylated. However, for most genes this
bimodal trend of methylation patterns is only observed
in local regions spanning a few CG sites in the gene
body, suggesting the effects of allele-specific methylation
may appear only at specific sites instead of spanning
throughout the gene body.
Differential DNA methylation in transcription factor
binding sites
It has been previously reported that TFBSs tend to be
de-methylated [4,6,15] in order not to destabilize the
interaction between DNA binding proteins and their tar-
get sequences. However, we observed a high variance of
methylation at TFBSs (Figure S14 in Additional file 1),
suggesting that methylation does occur in some sites.
To determine the effects of the methylation of cis-regu-
latory binding motifs on transcriptional regulation, we
compared the changes of methylation levels between
pairs of cell lines at binding sites with the changes of
the expression levels of their associated genes.
The coordinates of TFBSs were downloaded from
Motifmap [39] (sites with FDR < 0.1). We determined
the methylation level of these sites in the three cell
lines, and associated each site with its corresponding
gene expression data (obtained from the Gene Expres-
sion Omnibus database [GSE9448]). We were able to
include 14,000 to 25,000 TFBSs from 125 to 164 motifs
(45 to 64 TFs, varied by pairwise comparisons of cell
lines). For each motif associated with a TF, we calcu-
lated the gl obal correlation coeffic ient between the
change in methylation and the change in gene
Figure 4 Dist inct methylation patterns between the two reconstructed parental sequences of mir663. Differentially methylated CG sites
are found within mir663. BS-seq mapping shows intermediate methylation levels. The reconstruction of two parental chromosomes reveals that
methylated cytosines are associated with expressed alleles.
Chen et al. Genome Biology 2011, 12:R62
/>Page 7 of 12
expression over all the TFBSs where differential methy-
lation was observed (see Additional file 6 for a list of
TFs, the methylation level at the motifs and at the
neigh boring sequences, and the correlation coefficients).
If we observed a significant correlation, we hypothesized
that the DNA methylation state of the binding site
affects the function of the associated TF. Furthermore,
we compared the correlation with that in neighboring
sequences, defined as ± 500 bp around the binding sites,
to assess whether the factor is being affected by specific
changes in methylation of the binding site, instead of
more general methylation changes in the surrounding
region. In these comparisons we matched the two cell
lines being compared, the genomic context, and the
motif, and restricted the analysis to those that had at
least ten binding sites and a P-value of the Pearson cor-
relation coefficient less than 0.05. We ide ntified 22
motifs that satisfy these criteria, 17 of which show
higher correlation with gene expression than neighbor-
ing sequences. We conclude that, for these motifs, the
binding of the associated TFs depends on the methyla-
tion state of the cytosine(s). To our knowledge, this is
the first systematic demonstration that TF-DNA interac-
tions are sensitive to cytosine methylation.
Among the DNA methylation sensitive motifs we
identified SP1 [HGNC:SP1], which regulates the expres-
sion of genes involved in a variety of processes, such as
cell growth [40], apoptosis [41], and embryonic develop-
ment [42]. The motif M00932 in SP1 shows greater
anti-correlation than the neighboring sequences, which
suggests a specific association with the methylation of
the binding sites. Other TFs we identified, such as RP58
(aka [HGNC:ZNF238]), yielded a positive correlation
between methylation changes and expression levels (that
is, greater methylation on the motif increased expression
levels). RP58, a transcriptional repressor found at tran-
scriptionally silent heterochromatin, associates with
DNMT3A, independently of its de novo methylation
activity, to repress transcription [43,44]. The methyla-
tion level at the motif M00532 in RP58 is also more
correlated with expression than the neighboring
sequences. Two motifs showed opposite correlation
trends with their neighboring sequences: CREB (cAMP
response element-binding) [HGNC:CREB] a nd MEIS1A
(isoform of [HGNC:MEIS1]). The CREB binding sites
are positively correlated with expression whereas the
neighboring sequences are anti-correlated. T he positive
correlation may be due to the fact that CREB is known
to be able to repress transcriptional activity [45].
MEIS1A binding sites are anti-correlated with expres-
sion whereas its neighborin g sequences are positively
correlated. The MEIS1A carboxyl terminus harbors a
transcriptional activation domain that is stimulated by
protein kinase A in a manner dependent on the co-
activator of CREB [46]. So it is possible that the methy-
lation status at their binding sites is associated with the
binding of CREB and MEIS1A that jointly affect the
expression of associated genes.
Discussion
Global methylation levels
We performed a comprehensive comparison of the
methylation patterns in three human ESC lines to
explore their differences as we ll as their similarities. We
found that their absolute methylation levels are differ-
ent. The reason for this may be due to a number of fac-
tors, including different library preparation techniques
used in the three different studies, variabilities between
sequencing runs, or bona fide biological differences
between the methylation levels of the three cell lines.
We suspect that the 13% difference between these lines
is greater than the variatio n in global methylation found
across biological r eplicates and different runs, which is
typically significantly smaller. It is also shown in a
recent study that cell passage-related ‘biological var ia-
tion’ in methylation is present but minim al on the scale
of the genome [47]. We therefore hyp othesize that these
differences represent true variation in global methylation
levels between the three lines. However, until a systema-
tic study of all thre e lines is pe rformed by a single lab
using identical protocols for all three lines, it may be
difficult to deter mine the relative influence of these fac-
tors. Nonetheless, it is interest ing to note that there are
known phenotypic differences between the three lines
that could potentially be due to variabilities in their glo-
bal DNA methylation l evels. It has been demonstrated
that some HESC lines have a propensity to differentiate
into specific lineages [19]. For example, HUE 8 more
efficiently differentiates into pancreatic cells than other
lines [ 48], and H1 yields robust hematopoietic lineages
whereas HSF1 does not (unpublished data). Further-
more, it has been reported that the differential e xpres-
sion patterns in noncoding microRNAs between HESC
lines result in distinct differentiation properties [49],
indicating that epigenetic phenomena may be regulating
these diverse differentiation preferences.
Conservation of non-CG methylation
Previous studies have shown that the met hylation on
non-CG sites is widespread in HESCs, but absent in dif-
ferentiated cells such as fibroblasts. By comparing the
genome-wide methylation profiles of three HESC lines,
we were able to determine whether these methylated
non-CG sites are conserved across different HESC lines.
We hypothesized that if they are conserved, they are
more likely to be functional, whereas if they are not
conserved, they may simply result from higher levels of
the DNA methyltransferase DNMT3 in HESCs with
Chen et al. Genome Biology 2011, 12:R62
/>Page 8 of 12
respect to differentiated cells, leading to non-specific
methylation of non-CpG sites [32].
We observed that the vast majority of non-CG sites
are methylated at low levels (that is, less than 30%),
indicating that only a small fraction of the cells exhibit
methylation at any site within the HESC cell lines.
These sites were poorly conserved across the three cell
lines, suggesting that they may arise from non-specific
activity of methyltransferases. In contrast to these obser-
vations,wefoundthathighlymethylated(greaterthen
30%) non-CG sites are strongly conserved between the
three lines, and are symmetrically methylated. This sug-
gests that t hese sites, unlike the lowly methylated ones,
may be specifically targeted by DNA methyltransferases.
In support of this hypothesis we observed that specific
sequence motifs are preferred at these sites, indicating
that the higher methylation levels may be driven by
sequence specificities of the methyltransferases.
Using our data alone, it is not possible to determine
the functional r ole, if an y, of these sites. However, we
have found that not only are these highly methylated
non-CG sites enriched in splice sites, they are also more
methylated than other non-CG sites in genes; they may
therefore play a role in regulating transcription in
HESCs. Non-CG methylation is found to be more corre-
lated with transcription than CG methylation, and may
be preventing spurious transcription initiations [50].
While it is as yet not clear whether the splicing machin-
ery is in any way regulated by the methylation of these
sites, it is intriguing that this is yet one more piece of
evidence indicating that splicing at chromatin are
coupled with DNA methylation in complex ways
[22,51,52].
Allele-specific expression and methylation
Genetic and epigenetic differences between the two
parental chromosomes lead to the widespread occur-
rence of unbalanced transcription of the two alleles.
Somestudiesestimatethatasmuchasone-thirdof
genes (20 to 50%) are transcribed in a significantly
unbalanced fashion [13,14,36]. We have developed a
novel methodology that exploits genome-wide bisulfite
converted DNA sequences to identify locations i n the
genome that harbor polymorphisms between the two
parental chromosomes to identify allele-specific methy-
lation. This methodology allows us to characterize
both the genetic and epigenetic differences between
the two chromosomes.
We combined the data generated by BS-seq and RNA-
seq techniques and developed a novel approach to
detect genes with allele-specific expression. Our analysis
provides the first genome-wide scan for genes with
allele-specific expression that jointly incorporates gen-
ome-wide DNA methylation data. Overall, we found
that about one-third of all genes show significant allele-
specific expression. We determined that about 14% of
all CG sites are differentially methylated between the
two parental chromosomes. Finally, we found ten genes
that are enriched with differentially methylated sites in
multiple ESC lines. Six of these genes also have allele-
specific expression patterns, suggesting that this imbal-
ance is mediated by allele-specific methylaton. The
remaining genes with allele-specific expression were not
enriched for differentially methylated CG sites but many
of them harbored one or more differentially methylated
sites that could be causing the transcriptional imbalance.
Finally, using our approach we are able to ‘phase’ the
methylation patterns of t he major and minor a lleles (as
determined by the RNA-seq data). For the genes that
were enriched for allele-specific methylation, we found
that one of the two parental chromosomes was comple-
tely methylated while the other was unmethylated.
These results suggest that our methodology is able to
detect genome-wide allele-specific methylation and tran-
scription, as well as phase the methylation pattern of
individual genes, thus discovering new genes that are
transcriptionally regulated by allele-specific methylation
events.
Methylation of cis-regulatory elements
The physical interactions between TFs and their DNA
targets have been extensively characterized in many
structural studies [53]. It is reasonable to speculate that
the methylation status of cytosines in the binding site
could significantly affect the binding affinity [42], but
this hypothesis has been difficult to test on a genome-
wide scale. To address this question, we performed a
systematic analysis of the correlation between changes
in methylation status at binding sites and the resulting
changes in gene expression across the three HESC lines.
The expectation was that if TFs are sensitive to the
methylation state of their target sequences, then we
should observe a significant correlation between this
and the resulting gene expression levels.
Using this approach we identified several TFs with sig-
nificant correlat ion between the differential methylation
in binding sites and their associated expression, suggest-
ing that their binding affinities are affected by the DNA
methylation status of the target sequence. We found
that most of the methylation-sensitive TFs are more
correlated with the methylation levels of the b inding
sites with expression than neighboring sequences, sug-
gesting that the cis-regulatory elements are directly
responsible for these effects. The TFs that showed a sta-
tistically significant correlation with methylation p lay
important roles in cellular differentiation. We therefore
conclude that the methylation state of cis-regulatory ele-
ments affects transcriptional programs, and the
Chen et al. Genome Biology 2011, 12:R62
/>Page 9 of 12
regulation of these sites is critical for the maintenance
of pluripotent states.
Conclusions
We performed a comparative analysis of the genome-
wide DNA methylation profiles from three HESC lines.
We find that while non-CG sites with low methylation
levels are not c onserved, heavily methylated non-CG
sites are strongly conserved, especially when found
within the motif TACAG in splice sites. By combining
BS-seq and R NA-seq data we identified a novel set of
genes that are likely transcriptionall y regulated by
methylation in an allele-s pecific manner. In the analysis
of TFBSs, we found several TFs that showed a correla-
tion between methylation and gene expression levels.
The correlation between the methylation at binding
sites and expre ssion are generally stronger than in the
neighboring sequences, sugge sting that the methylation
state of cis-regulatory elements impacts the ability of
TFs to bind and regulate transcription.
Material and methods
Aligning bisulfite-converted reads
The bisulfite converted reads were aligned against human
genome (hg18) using BS Seeker. It converts both the reads
and the genome to a three letter alphabet and uses Bowtie
[54] to align reads to the reference genome, where up to
three mismatches are allowed in our analysis. It is the only
aligner that is able to handle reads generated from differ-
ent library protocols using pre-methylated adapters (H1,
H9), or the Dpn1 adapter (HSF1). The pair-end reads
from H9 data are mapped as if t hey were single ended.
Finally, BS Seeker post-processes the alignments to
remove non-unique and low quality mappings. Reads with
more than two methylated non-CG sites in a row were
considered non-converted and were discarded. Table S1 in
Additional file 1 shows the mapping results. We have less
mapped reads in H1 and suspect this could be due to the
different mapping criteria and the possible adapter con-
tamination in several read files.
Extracting conserved differentially methylated regions
To detect genomic regions where one cell line is more
methylated than the other, we surveyed all 1-kb win-
dows and calculated the ratio of the methylation levels
in the windows between the more methylated cell line
and the less methylated one. If the standard Z score of
this ratio exceeds two, then this region is considered dif-
ferentially methylated. The conserved differentially
methylated regions are the overlapping differentially
methylated regions from all three pairwise comparisons.
In our analysis we found 0.11% of the genome is con-
served differentially methylated (see Additional file 7 for
a list of the conserved differentially methylated regions).
To estimate the FDR of the fraction of the conserved
differentially methylated regions, we first randomized
the order of the average methylation levels calculated
from the genome of each cell line. We then calculated
the fraction of the conserved differentially methylated
regions in this randomized permutation. The average
fraction of the conserved differentially methylated
regions from 300 simulations is 0.0006% (standard
deviation = 4.7E-7), which gives an estimate of FDR of
0.54%.
Identifying SNPs
The identification of SNPs was performed in two steps.
The first step was to find heterozygous SNPs between
two parents. Using BS-seq data, we searched for SNPs
to which at least two different alleles are aligned. Speci-
fically, the read coverage at each position has to exceed
eight, and the two main alleles cover more than 75% of
the reads. The alleles on reads mapped to the negative
strand are also included. Since bisulfite sequencing con-
verts unmethylated read C into T on genomic C, read C
and T mapped to genomic C on either strand are not
included. Finally, the count of allele per genomic posi-
tion is the average of their read counts from both
strands. Betw een these two alleles, the diff erence of
reads has to be within 20% of their total so the two
alleles have close counts of reads.
The second step is to find among these parental SNPs
within transcripts the exonic SNPs expressed in only
one parental allele. Using RNA-seq data we screened
the parental SNPs for those covered by at least four
mRNAreads.TheallelewithmoremRNAreadsisthe
major allele and the other the minor allele. The result-
ingSNPsaretheexonicSNPs expressed in only one
parental allele. Within the H1 data we found 610,237
(0.02% of genome) heterozygous SNPs, of which 1.6%
are exonic SNPs with allele-specific expression.
Identifying differentially methylated cytosines
Using our list of SNPs, we first separated BS reads
mapped to these into two groups based on the two
alleles. From the patterns of methylation in these two
groups we can reconstruct the methylation state of the
two parental chromosomes. For the reads that segre-
gated into two parental groups, we were able to test if
the cytosine is differentially methylated between the two
parent s. Given the probability of observing a methylated
read in one p arent, which can be estimated from the
methylation level from the reads in the parental group,
we performed a binomial test to see if the observed
methylated reads exceeded expectation. The test was
performed twice by switching the parental groups and
the larger P-value was recorded. We used a 5% FDR to
impose a threshold for P-values. When cytosines have
Chen et al. Genome Biology 2011, 12:R62
/>Page 10 of 12
P-valueslessthanthisthreshold,itimpliesthatthe
methylation levels between the two parental groups are
significantly different.
Additional material
Additional file 1: Supplementary information. Includes supplementary
Table S1 and Figures S1 to S14.
Additional file 2: Supplementary Table S2. List of genes associated
with differentially methylated CpG islands.
Additional file 3: Supplementary Table S3. List of the 1,020 genes that
are predicted to have allele-specific expression.
Additional file 4: Supplementary Table S4. List of 75 imprinted genes
from the literature.
Additional file 5: Supplementary Table S5. List of the 110 genes that
are enriched with differentially methylated CG sites in at least one cell
line.
Additional file 6: Supplementary Table S6. List of motifs in
transcription factors and the correlation coefficients between change of
methylation and the associated changes of gene expression at their
binding sites, and at the neighboring sequences.
Additional file 7: Supplementary Table S7. List of differentially
methylated regions overlapped across the three HESC lines.
Abbreviations
bp: base pair; BS-seq: whole genome bisulfite sequencing; ESC: embryonic
stem cells; FDR: false discovery rate; HESC: human embryonic stem cell;
HGNC: HUGO Gene Nomenclature Committee; RNA-seq: whole
transcriptome shotgun sequencing; SNP: single nucleotide polymorphism;
TF: transcription factor; TFBS: transcription factor binding site.
Acknowledgements
The authors thank Shawn Cokus and Weihong Yan for the data visualization
on genome browser, Amander Clark for providing embryonic stem cell DNA
(HSF1) and discussion. P-YC is funded by Eli and Edythe Broad Center of
Regenerative Medicine and Stem Cell Research at UCLA. SF is Special Fellow
of the Leukemia and Lymphoma Society. J-WJ is founded by The Louis and
Thelma Lippman Fellowship. SEJ is an investigator of the Howard Hughes
Medical Institute. This work was supported by an Innovation Award from the
Eli and Edythe Broad Center of Regenerative Medicine and Stem Cell
Research at UCLA (to SEJ and MP), and by the Department of Energy Office
of Science (DE-FC02-02ER63421 to MP).
Author details
1
Department of Molecul ar, Cell, and Developmental Biology, University of
California, Los Angeles, CA 90095, USA.
2
Institute of Genomics and
Proteomics, University of California, Los Angeles, CA 90095, USA.
3
Interdepartmental Program in Bioinformatics, University of California Los
Angeles, Los Angeles, CA 90095, USA.
4
Howard Hughes Medical Institute,
University of California, Los Angeles, Los Angeles, CA 90095, USA.
5
Broad
Center of Regenerative Medicine and Stem Cell Research, University of
California, Los Angeles, Los Angeles, CA 90095, USA.
6
Molecular Biology
Institute, University of California, Los Angeles, CA 90095, USA.
Authors’ contributions
PC, SEJ and MP designed the study. SF performed the experiments. PC, JJ,
SEJ and MP analyzed the data. PC and MP wrote the paper. All authors read
and approved the final manuscript.
Received: 18 March 2011 Revised: 10 May 2011 Accepted: 6 July 2011
Published: 6 July 2011
References
1. Jones PA, Baylin SB: The epigenomics of cancer. Cell 2007, 128:683-692.
2. Hemberger M, Dean W, Reik W: Epigenetic dynamics of stem cells and
cell lineage commitment: digging Waddington’s canal. Nat Rev Mol Cell
Biol 2009, 10:526-537.
3. Wasserman WW, Sandelin A: Applied bioinformatics for the identification
of regulatory elements. Nat Rev Genet 2004, 5:276-287.
4. Straussman R, Nejman D, Roberts D, Steinfeld I, Blum B, Benvenisty N,
Simon I, Yakhini Z, Cedar H: Developmental programming of CpG island
methylation profiles in the human genome. Nat Struct Mol Biol 2009,
16:564-571.
5. Brandeis M, Frank D, Keshet I, Siegfried Z, Mendelsohn M, Nemes A,
Temper V, Razin A, Cedar H: Sp1 elements protect a CpG island from de
novo methylation. Nature 1994, 371:435-438.
6. Siegfried Z, Eden S, Mendelsohn M, Feng X, Tsuberi BZ, Cedar H: DNA
methylation represses transcription in vivo. Nat Genet 1999, 22:203-206.
7. Schimenti J: Monoallelic gene expression in mice: who? When? How?
Why?. Genome Res 2001, 11:1799-1800.
8. Reik W, Walter J: Evolution of imprinting mechanisms: the battle of the
sexes begins in the zygote. Nat Genet 2001, 27:255-256.
9. Hellman A, Chess A: Gene body-specific methylation on the active ×
chromosome. Science 2007, 315:1141-1143.
10. Zhang Y, Rohde C, Reinhardt R, Voelcker-Rehage C, Jeltsch A: Non-
imprinted allele-specific DNA methylation on human autosomes.
Genome Biol 2009, 10:R138.
11. Gregg C, Zhang J, Weissbourd B, Luo S, Schroth GP, Haig D, Dulac C: High-
resolution analysis of parent-of-origin allelic expression in the mouse
brain. Science 2010, 329:643-648.
12. Gimelbrant A, Hutchinson JN, Thompson BR, Chess A: Widespread
monoallelic expression on human autosomes. Science 2007,
318:1136-1140.
13. Pant PV, Tao H, Beilharz EJ, Ballinger DG, Cox DR, Frazer KA: Analysis of
allelic differential expression in human white blood cells. Genome Res
2006, 16:331-339.
14. Serre D, Gurd S, Ge B, Sladek R, Sinnett D, Harmsen E, Bibikova M, Chudin E,
Barker DL, Dickinson T, Fan JB, Hudson TJ: Differential allelic expression in
the human genome: a robust approach to identify genetic and
epigenetic cis-acting mechanisms regulating gene expression. PLoS
Genet 2008, 4:e1000006.
15.
Lister R, Pelizzola M, Dowen RH, Hawkins RD, Hon G, Tonti-Filippini J,
Nery JR, Lee L, Ye Z, Ngo QM, Edsall L, Antosiewicz-Bourget J, Stewart R,
Ruotti V, Millar AH, Thomson JA, Ren B, Ecker JR: Human DNA methylomes
at base resolution show widespread epigenomic differences. Nature
2009, 462:315-322.
16. Laurent L, Wong E, Li G, Huynh T, Tsirigos A, Ong CT, Low HM, Kin
Sung KW, Rigoutsos I, Loring J, Wei CL: Dynamic changes in the human
methylome during differentiation. Genome Res 2010, 20:320-331.
17. Meissner A, Mikkelsen TS, Gu H, Wernig M, Hanna J, Sivachenko A, Zhang X,
Bernstein BE, Nusbaum C, Jaffe DB, Gnirke A, Jaenisch R, Lander ES:
Genome-scale DNA methylation maps of pluripotent and differentiated
cells. Nature 2008, 454:766-770.
18. Ji H, Ehrlich L, Seita J, Murakami P, Doi A, Lindau P, Lee H, Aryee M,
Irizarry R, Kim K, Rossi D, Inlay M, Serwold T, Karsunky H, Ho L, Daley G,
Weissman I, Feinberg A: Comprehensive methylome map of lineage
commitment from haematopoietic progenitors. Nature 2010, 467:338-342.
19. Bock C, Kiskinis E, Verstappen G, Gu H, Boulting G, Smith ZD, Ziller M,
Croft GF, Amoroso MW, Oakley DH, Gnirke A, Eggan K, Meissner A:
Reference maps of human ES and iPS cell variation enable high-
throughput characterization of pluripotent cell lines. Cell 2011,
144:439-452.
20. Lister R, Pelizzola M, Kida YS, Hawkins RD, Nery JR, Hon G, Antosiewicz-
Bourget J, O’Malley R, Castanon R, Klugman S, Downes M, Yu R, Stewart R,
Ren B, Thomson JA, Evans RM, Ecker JR: Hotspots of aberrant epigenomic
reprogramming in human induced pluripotent stem cells. Nature 2011,
471:68-73.
21. Cokus SJ, Feng S, Zhang X, Chen Z, Merriman B, Haudenschild CD,
Pradhan S, Nelson SF, Pellegrini M, Jacobsen SE: Shotgun bisulphite
sequencing of the Arabidopsis genome reveals DNA methylation
patterning. Nature 2008, 452:215-219.
22. Chodavarapu RK, Feng S, Bernatavichute YV, Chen PY, Stroud H, Yu Y,
Hetzel JA, Kuo F, Kim J, Cokus SJ, Casero D, Bernal M, Huijser P, Clark AT,
Kramer U, Merchant SS, Zhang X, Jacobsen SE, Pellegrini M: Relationship
Chen et al. Genome Biology 2011, 12:R62
/>Page 11 of 12
between nucleosome positioning and DNA methylation. Nature 2010,
466:388-392.
23. Rauch TA, Wu X, Zhong X, Riggs AD, Pfeifer GP: A human B cell
methylome at 100-base pair resolution. Proc Natl Acad Sci USA 2009,
106:671-678.
24. Irizarry RA, Ladd-Acosta C, Carvalho B, Wu H, Brandenburg SA, Jeddeloh JA,
Wen B, Feinberg AP: Comprehensive high-throughput arrays for relative
methylation (CHARM). Genome Res 2008, 18:780-790.
25. Rollins RA, Haghighi F, Edwards JR, Das R, Zhang MQ, Ju J, Bestor TH:
Large-scale structure of genomic methylation patterns. Genome Res 2006,
16:157-163.
26. Chen PY, Cokus SJ, Pellegrini M: BS Seeker: precise mapping for bisulfite
sequencing. BMC Bioinformatics 2010, 11:203.
27. HESC Methylation Tracks at UCLA [ />HsaDNAmeth].
28. Ooi SK, Wolf D, Hartung O, Agarwal S, Daley GQ, Goff SP, Bestor TH:
Dynamic instability of genomic methylation patterns in pluripotent stem
cells. Epigenet Chromatin 2010, 3:17.
29. Humpherys D, Eggan K, Akutsu H, Hochedlinger K, Rideout WM,
Biniszkiewicz D, Yanagimachi R, Jaenisch R: Epigenetic instability in ES
cells and cloned mice. Science 2001, 293:95-97.
30. Doi A, Park IH, Wen B, Murakami P, Aryee MJ, Irizarry R, Herb B, Ladd-
Acosta C, Rho J, Loewer S, Miller J, Schlaeger T, Daley GQ, Feinberg AP:
Differential methylation of tissue- and cancer-specific CpG island shores
distinguishes human induced pluripotent stem cells, embryonic stem
cells and fibroblasts. Nat Genet 2009, 41:1350-1353.
31. Huang da W, Sherman BT, Lempicki RA: Systematic and integrative
analysis of large gene lists using DAVID bioinformatics resources. Nat
Protoc 2009, 4:44-57.
32. Ramsahoye BH, Biniszkiewicz D, Lyko F, Clark V, Bird AP, Jaenisch R: Non-
CpG methylation is prevalent in embryonic stem cells and may be
mediated by DNA methyltransferase 3a. Proc Natl Acad Sci USA 2000,
97:5237-5242.
33. Aoki A, Suetake I, Miyagawa J, Fujio T, Chijiwa T, Sasaki H, Tajima S:
Enzymatic properties of de novo-type mouse DNA (cytosine-5)
methyltransferases. Nucleic Acids Res 2001, 29:3506-3512.
34. Law JA, Jacobsen SE: Establishing, maintaining and modifying DNA
methylation patterns in plants and animals. Nat Rev Genet 2010,
11:204-220.
35. Athanasiadou R, de Sousa D, Myant K, Merusi C, Stancheva I, Bird A:
Targeting of de novo DNA methylation throughout the Oct-4 gene
regulatory region in differentiating embryonic stem cells. PLoS One 5:
e9937.
36. Lo HS, Wang Z, Hu Y, Yang HH, Gere S, Buetow KH, Lee MP: Allelic
variation in gene expression is common in the human genome. Genome
Res 2003, 13:1855-1862.
37. Luedi PP, Dietrich FS, Weidman JR, Bosko JM, Jirtle RL, Hartemink AJ:
Computational and experimental identification of novel human
imprinted genes. Genome Res 2007, 17:1723-1730.
38. Morison IM, Paton CJ, Cleverley SD: The imprinted gene and parent-of-
origin effect database. Nucleic Acids Res 2001, 29:275-276.
39. Xie X, Rigor P, Baldi P: MotifMap: a human genome-wide map of
candidate regulatory motif sites. Bioinformatics 2009, 25:167-174.
40. Yoshida-Hata N, Mitamura Y, Oshitari T, Namekata K, Harada C, Harada T,
Yamamoto S: Transcription factor, SP1, in epiretinal membranes of
patients with proliferative diabetic retinopathy. Diabetes Res Clin Pract
2010, 87:e26-28.
41. Ming L, Sakaida T, Yue W, Jha A, Zhang L, Yu J: Sp1 and p73 activate
PUMA following serum starvation. Carcinogenesis 2008, 29:1878-1884.
42. Marin M, Karis A, Visser P, Grosveld F, Philipsen S: Transcription factor Sp1
is essential for early embryonic development but dispensable for cell
growth and differentiation. Cell 1997, 89:619-628.
43. Fuks F, Burgers WA, Godin N, Kasai M, Kouzarides T: Dnmt3a binds
deacetylases and is recruited by a sequence-specific repressor to silence
transcription. EMBO J 2001, 20:2536-2544.
44. Aoki K, Meng G, Suzuki K, Takashi T, Kameoka Y, Nakahara K, Ishida R,
Kasai M: RP58 associates with condensed chromatin and mediates a
sequence-specific transcriptional repression. J Biol Chem 1998,
273:26698-26704.
45. Lamph WW, Dwarki VJ, Ofir R, Montminy M, Verma IM: Negative and
positive regulation by transcription factor cAMP response element-
binding protein is modulated by phosphorylation. Proc Natl Acad Sci USA
1990, 87:4320-4324.
46. Goh SL, Looi Y, Shen H, Fang J, Bodner C, Houle M, Ng AC, Screaton RA,
Featherstone M: Transcriptional activation by MEIS1A in response to
protein kinase A signaling requires the transducers of regulated CREB
family of CREB co-activators. J Biol Chem 2009, 284:18904-18912.
47. Harris RA, Wang T, Coarfa C, Nagarajan RP, Hong C, Downey SL,
Johnson BE, Fouse SD, Delaney A, Zhao Y, Olshen A, Ballinger T, Zhou X,
Forsberg KJ, Gu J, Echipare L, O’Geen H, Lister R, Pelizzola M, Xi Y,
Epstein CB, Bernstein BE, Hawkins RD, Ren B, Chung WY, Gu H, Bock C,
Gnirke A, Zhang MQ, Haussler D, et al: Comparison of sequencing-based
methods to profile DNA methylation and identification of monoallelic
epigenetic modifications. Nat Biotechnol 2010, 28:1097-1105.
48. Osafune K, Caron L, Borowiak M, Martinez RJ, Fitz-Gerald CS, Sato Y,
Cowan CA, Chien KR, Melton DA: Marked differences in differentiation
propensity among human embryonic stem cell lines.
Nat Biotechnol 2008,
26:313-315.
49. Wu H, Xu J, Pang ZP, Ge W, Kim KJ, Blanchi B, Chen C, Sudhof TC, Sun YE:
Integrative genomic and functional analyses reveal neuronal subtype
differentiation bias in human embryonic stem cell lines. Proc Natl Acad
Sci USA 2007, 104:13821-13826.
50. Portela A, Esteller M: Epigenetic modifications and human disease. Nat
Biotechnol 2010, 28:1057-1068.
51. Andersson R, Enroth S, Rada-Iglesias A, Wadelius C, Komorowski J:
Nucleosomes are well positioned in exons and carry characteristic
histone modifications. Genome Res 2009, 19:1732-1741.
52. Kolasinska-Zwierz P, Down T, Latorre I, Liu T, Liu XS, Ahringer J: Differential
chromatin marking of introns and expressed exons by H3K36me3. Nat
Genet 2009, 41:376-381.
53. Sabogal A, Lyubimov AY, Corn JE, Berger JM, Rio DC: THAP proteins target
specific DNA sites through bipartite recognition of adjacent major and
minor grooves. Nat Struct Mol Biol 2010, 17:117-123.
54. Langmead B, Trapnell C, Pop M, Salzberg SL: Ultrafast and memory-
efficient alignment of short DNA sequences to the human genome.
Genome Biol 2009, 10:R25.
doi:10.1186/gb-2011-12-7-r62
Cite this article as: Chen et al.: A comparative analysis of DNA
methylation across human embryonic stem cell lines. Genome Biology
2011 12:R62.
Submit your next manuscript to BioMed Central
and take full advantage of:
• Convenient online submission
• Thorough peer review
• No space constraints or color figure charges
• Immediate publication on acceptance
• Inclusion in PubMed, CAS, Scopus and Google Scholar
• Research which is freely available for redistribution
Submit your manuscript at
www.biomedcentral.com/submit
Chen et al. Genome Biology 2011, 12:R62
/>Page 12 of 12