Báo cáo y học: " Global and unbiased detection of splice junctions from RNA-seq data" pptx
Bạn đang xem bản rút gọn của tài liệu. Xem và tải ngay bản đầy đủ của tài liệu tại đây (725.25 KB, 9 trang )
METH O D Open Access
Global and unbiased detection of splice junctions
from RNA-seq data
Adam Ameur
*
, Anna Wetterbom, Lars Feuk, Ulf Gyllensten
Abstract
We have developed a new strategy for de novo prediction of splice junctions in short-read RNA-seq data, suitable
for detection of novel splicing events and chimeric transcripts. When tested on mouse RNA-seq data, > 31,000
splice events were predicted, of which 88% bridged between two regions separated by ≤100 kb, and 74%
connected two exons of the same RefSeq gene. Our method also reports genomic rearrangements such as
insertions and deletions.
Introduction
High-throughput sequencing of mRNA opens unprece-
dented opportunities to identify the spectrum of splice
events in a sample on a global scale. The typical
approach for detecting splicing in RNA-seq experiments
has been to map the reads to a junctio n library consist-
ing of predefined exon- exon boundaries [1-6]. Although
these strategies can successfully recover many splice
events, they do not analyze splicing from a truly global
and unprejudiced perspective. Only splice junctions pre-
sent in the library can be identified, and it is simply not
feasible to match against all possible combinations of
exons. For example, a genome with 100,000 (10
5
) exons,
which is a low estimate for mammalian genomes, would
yield 10
10
combinations. To address this problem, the
size of the junction library must be reduced dramati-
cally, and consequently, most methods consider only the
candidates involving known exons within the same gene.
A severe limitation with this approach is that splicing
events involving previously unknown exons cannot be
identified. Also, this type of analysis is restricted to the
relatively small number of species in which coordinates
of genes and exons have been found.
To overcome some of these limitations, the splice-
junction library can instead be created directly from the
RNA-seq data without relying on any genome annota-
tions. This approach is taken by the two packages
G-Mo.R -Se [7] and TopHat [8]. With these methods, all
reads are first mapped to the reference genome, and
transcribed fragments are identified through analy sis of
the coverage profile. The ends of these fragments are
then combined into a library of putative exon bound-
aries to which the previously unmapped reads are
aligned. Although this str ategy has some advantages
over methods that construct the library from known
annotations, the problem of analyzing all possible exon
combinations remains. G-Mo.R-Se and TopHat solve
this problem by considering only putative junctions that
span between neighboring (but not necessarily adjacent)
transcribed fragments and those that contain a canonic
(GT/C-AG) splice site. These restrictions imply that a
substantial number of true splice junctions (for example,
those with long introns or noncanonic splice sites) are
outside of the detection range. A further limitation is
that these methods are based on accurate de novo iden-
tification of exon boundaries from raw RNA-seq data,
which in itself is a computationally challenging task,
especially for transcripts expressed at lower levels.
An important application of deep RNA sequencing is
the discovery of fusion transcripts in cancer, and two
consecutive methods have been proposed by Maher and
colleagues [9]. Initially the authors used a combination
of long reads (>200 bp) from the Roche 454 sequencer
and shorter reads from the Illumina (Solexa) platform,
and later they shifted to using paired-end sequencing
(2 × 50 bp) [10]. Although these strategies can success-
fully discover fusion transcripts, they have a number of
important drawbacks. First, it is both costly and labor
intensive to use two different sequencing platforms, as
was done in their primary study. Second, the mate-pair
approach complicates the analysis, because the expected
* Correspondence:
Department of Genetics and Pathology, Rudbeck laboratory, Uppsala
University, SE-751 85 Uppsala, Sweden
Ameur et al. Genome Biology 2010, 11:R34
/>© 2010 Ameur et al.; licensee BioMed Central Ltd. This is an open access article distributed under the terms of the Creative Commons
Attribution Lice nse (http://c reativecommons.org/licenses/by/2.0), w hich permits unrestricted use, distribution, and reproduction in
any medium, provided the original work is properly cited.
insert size must be taken into account when estimating
the expected distance between two mates in the
sequenced transcript. This will be particularly proble-
matic for mates that span over several splice junctions.
Also, preparation of mate-pair libraries require larger
amounts of RNA than the fragment libraries used in
most RNA-seq experiments. The amount of RNA can
be a crucial limitation, especially when studying clinical
samples.
Here we present an alternative approach to identify
splice junctions. The junctions are predicted de novo
without any preassumed s et of allowed exon bound-
aries. This implies that all types of splicing events in
the RNA sample can be detected in a completely
unbiased way, including previously unknown splice
junctions and fusion transcripts. Also, we rely entirely
on short reads (~50 bp) from fragment libraries, which
is the type of RNA-seq data normally generated by
using the Illumina or SOLiD platforms. By applying
our method to available RNA-seq data from mouse
cells [6], we showed that splice junctions can be identi-
fied at almost nucleotide precisionandwithaverylow
false-discovery rate (FDR). Moreover, this strategy also
allows unbiased detection of in sertions, deletions, and
other types of genomic rearrangements within tran-
scribed sequences. Indels and coding repeat expansions
are important in a large number of human disorders
[11]. The potential for simultaneous detection of
expression levels and coding-sequence variation in a
single analysis pipeline will be beneficial for patient-
sample analysis. We have implemented our method in
a software called SplitSeek. The SplitSeek results can
be directly uploaded to the UCSC genome browser
[12] and used as input to the BEDTools s oftware suite
[13], which enables the user to visualize and analyze
the predicted events in a genomic context.
Results
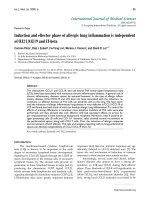
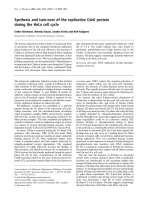
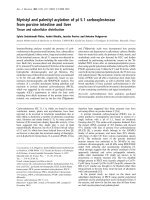
Our strategy consists of a co mbination of a split-reada-
lignment and the novel SplitSeek program (see Figure 1).
In the alignment, every read is split into two nonover-
lapping parts, or “anchors,” that are aligned separately.
The two anchors are then extended as long as they still
match the reference sequence. If a splice junction is
located in the gap between the two anchors, then the
two parts are matched to different genomic positions
(that is, the two exons in the junction). The SplitSeek
program then performs a number of analy sis steps to
predict the exon boundaries. First, all instances of split
reads are found, and their genomic positions and
nucleotide sequence are r ecorded. They comprise the
initial set of candidates, and all resulting splice events
will be found among these. However, many reads exist
in which the junction is located in one of the anchors
rather than in the gap. To identify such additional junc-
tion reads, we scan all reads in which only one of the
anchors was aligne d. If such an anchor can be extended
to the exact position as a previously identified candidate
junction, and the sequence in the two reads aligns per-
fectly within the first five bases of the other exon (gray
lines in Figure 1), then the read is considered to confirm
the junction. This implies that SplitS eek can find junc-
tion reads in which as few as five bases overlap with the
other exon. In the final step, all identified junction reads
are grouped, and user-defined cut-offs are applied to
obtain a final set of exon boundaries. Because this
method is unbiased, it will report all types of events in
which a read must be split to match the reference gen-
ome, including small insertions and deletions.
In this study, we evaluated our method on public
RNA-seq data from single mouse oocytes [6], sequenced
on the SOLiD platform. The analysis was performed on
two independent samples, oocyte1 (with 11.6 million
reads) and oocyte2 (23.5 million reads), and oocyte1
+2, a combination of all reads from the two samples.
Thesedataconsistof50-bpreads,andthealignment
was performed by using the AB/SOLiD whole-transcrip-
tome-alignment software with anchor lengths in the
range between 21 and 24 (see Methods for details). The
highest number of uniquely mapped split reads was
obtained for lengths 22 and 23 (see Table 1), probably
because shorter splits do not align uniquely to the gen-
ome, whereas the longer do not give a sufficiently large
gap. We therefore selected 22 as t he anchor length in
the remaining analysis.
We required each junction to be supported by at
least two uniquely positioned reads in t he SplitSeek
analysis, and a summary of the results is presented in
Table 2. Between 17,397 and 31,532 junctions were
predicted in the three samples, with 93% to 88% of
them bridging between regions on the same chromo-
some, separated by ≤ 100 kb, and ≥74% mapping
within five bases of a known exon-exon boundary in
an RefSeq gene. The numbers suggest that our
method has a very low false-positive r ate, and to sup-
port this further, we estimated the false-discovery rate
(FDR) for all junctions within 1 Mb and 100 kb,
respectively (see Methods for details). The FDR was
<1 in 1,000 for junctions within 1 Mb and <1/10,000
for those within 100 kb. Naturally, the FDR will be
higher for splicing events that are farther apart than
1 Mb or on different chromosomes. However, such
instances comprise a small subset of all junctions, and
they can either be disregarde d or be examine d indivi-
dually, depending on the aim of the study. Also, it is
possible to increase the specificity by requiring three
uniquely positioned reads or more for each predicted
junction.
Ameur et al. Genome Biology 2010, 11:R34
/>Page 2 of 9
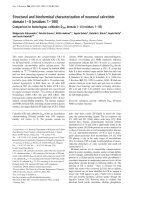
The SplitSeek predictions show high specificity, but
we were also interested to evaluate the sensitivity.
Therefore, we compared the SplitSeek results with
RNA-MATE [5], a method that recursively maps reads
to a junction library of known exons. By applying the
RNA-MATE program to the oocyte1 dataset (see Meth-
ods for details), we found 20,562 exon boundaries sup-
ported by at least two reads, slightly more than the
17,397 junctions predicted by SplitSeek (see Table 2).
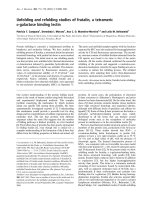
As shown in Figure 2a, 11,395 splice junctions were
detected in common, meaning that SplitSeek confirms
55% of the RNA-MATE predictions. There could be
several possible reasons that the remaining 45% are not
detected by SplitSeek and we believe it is due to a
combination of (a) junctions at which no read is cen-
tered over the boundar y and thereby is undetectable by
SplitSeek; (b) junctions uniquely mappable when using
an exon-junction library but not with the anchor-extend
alignment; and (c) junctions falsely detected by RNA-
MATE. Of the SplitSeek boundaries, 6,420 were not
found by RNA-MATE, and 1,007 (16%) of these were
long-range splicings of ≥100 kb, a number that could be
indicativeofthefalse-positiverateamongthejunctions
predicted only by SplitSeek. Interestingly, as many as
4,069 (63%) of the 6,420 SplitSeek-only predictions coin-
cide with RefSeq exon boundaries. These can be
explained partly by the fact that the RNA-MATE library
was not completely up to date (see Methods), but as
many as 2,519 of these junctions were present in the
library file, which demonstrates that a substantial num-
ber of splice events are detectable only by SplitSeek.
However, a large number of exon boundaries were
reported by both methods, and for these, we could see a
clear correlation in the number of reads predicted to
cover the junctions (see Figure 2b). The scatterplot
shows a systematic bias toward more reads/junction for
SplitSeek, probably because SplitSeek can use reads in
Figure 1 Overview of the split-read strategy.Eachreadissplitintotwopieces,or“anchors,” of equal length (red and blue), with a gap
between them. The anchors are aligned independently, and only the instances in which both align uniquely to the reference sequence are
considered. Then, the alignments are extended as long as they still match the reference sequence. The SplitSeek program identifies all candidate
junction reads from the split-read alignments where the boundary is located in the gap between the anchors. Then additional junction reads are
detected from the set of reads that partly align to a previously detected candidate junction, and where the remaining, nonaligned, part of the
read (grey lines) has a 5-bp identical sequence compared with the corresponding part of the same candidate read. SplitSeek then groups all
potential junction reads, applies cut-offs, and reports the results.
Table 1 Number of split read alignments
Oocyte 1 Oocyte 2
Anchor length 21 110468 203159
Anchor length 22 157138 284468
Anchor length 23 158487 284579
Anchor length 24 143293 257316
Ameur et al. Genome Biology 2010, 11:R34
/>Page 3 of 9
whichonlyfivenucleotidesaresequencedfromthe
other exon, whereas this overhang must be longer for
library-based methods. A peculiar observation is a group
of points in the upper left corner, with many reads for
SplitSeek and few for RNA-MATE. We thi nk that these
largely represent cases in which RNA-MATE predicts
two or more highly similar splice events located only a
few bases apart, whereas SplitSeek groups them into one
single junct ion. In such cases, the RNA- MATE junc-
tions, each with varying number of reads, will be com-
pared with one single SplitSeek prediction based on all
junction reads, and consequently, some of the points
might end in the top-left corner of Figure 2 b. However,
it remains unclear whether these highly similar junctions
reflect real splicing events or if they are artifacts from
the library construction and mapping procedures. In
conclusion, this comparison suggests that junction
library-based methods and SplitSeek can complement
each other to detect more splice variants in known
genes.
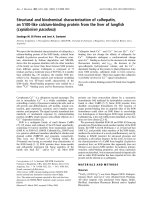
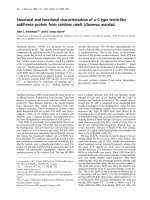
As seen in Figure 3, an almost a linear correlation
exists between the number of SplitSeek predictions and
the total number of reads in the three samples. This
demonstrates that we have not yet reached saturation
and would detect many more splice junctions by deeper
sequencing, as indicated by extrapolated dotted lines in
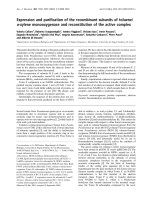
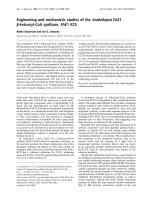
Figure 3. The SplitSeek results can be viewed in the
UCSC genome browser [14], as illustrated by two exam-
pleregionsinFigure4.Thefirstexampleshowsagene
with many predicted exon-exon boundaries, including
alternative splicing (Figure 4a), whereas the second
demonstrates the possibility of detecting insertions/dele-
tions in the sample (Figure 4b). In both cases, the Split-
Seek predictions agree with annotated splice junctions,
Table 2 Splice junctions and insertions reported by SplitSeek with anchor length 22
Oocyte 1 Oocyte 2 Oocyte 1+2
Number processed reads 11,565,660 23,488,851 35,054,511
Predicted splice junctions 17,397 23,703 31,532
Within chromosome 16,205 (93.1%) 21,495 (90.7%) 27,957 (88.7%)
Within 1 Mb 16,128 (92.7%) 21,374 (90.2%) 27,757 (88.0%)
Within 100 kb 16,094 (92.5%) 21,323 (90.0%) 27,685 (87.8%)
Match to a RefSeq exon-exon boundary
a
14,264 (82.0%) 18,139 (76.5%) 23,235 (73.7%)
Expected false within 1 Mb (FDR) 12.9 (8.0·10
-4
) 17.6 (8.2·10
-4
) 23.4 (8.4·10
-4
)
Expected false within 100 kb (FDR) 1.3 (8.0·10
-5
) 1.8 (8.2·10
-5
) 2.3 (8.4·10
-5
)
Predicted insertions 275 553 834
a
Each of the exon boundaries located within 5 bp of predicted junction.
Figure 2 Comparison of predictions from RNA-MATE and SplitSeek. (a) Venn diagram showing the number of predicted junctions by the
two methods. (b) Predicted number of junction reads for all for all 11,395 exon boundaries reported by both RNA-MATE (x-axis) and SplitSeek
(y-axis).
Ameur et al. Genome Biology 2010, 11:R34
/>Page 4 of 9
insertions, and deletions almost at nucleotide resolution.
The reason that the position is not always exact is that
the first few nucleotides in an intron may coincide with
the first bases of the next exon, thereby resulting in a
slight overextension of the anchor during the alignment
procedure.
As mentioned earlier, a special feature of our split-
read strategy is that it also can find indels (see Figure
4b). In these oocyte RNA samples, SplitSeek predicted
834 small insertions of up to six nucleotides, supported
by at least two unique reads (Table 2), and 647 of these
were found inside RefSeq exons. More specifically,
502 (78%) of these 647 in sertions are located in the
3’ UTR (see Table 3), where a higher degree of genetic
variation is expected compared with the coding regions,
because such events do not affect the amino acid
sequence of the translated protein. By comparison, the
combined lengths o f 3’UTRs make up 46% of the total
length of RefSeq exons, indicating a selective constraint
against small insertions in coding sequence compared to
untranslated regions. Deletions are somewhat more
complicated to identify since they appear identical to
splice junctions. Here we considered only the cases in
Figure 3 Number of predicted splice junctions (y-axis) as a
function of the total number of processed reads (x-axis). The
number of predicted junctions (black line) increases almost linearly
with the number of reads. The green and orange lines represent
two subgroups of predicted junctions: those where the two
boundaries are separated by ≤100 kb, and those connecting two
exon boundaries of a RefSeq gene. Predicted insertions and
deletions are combined and represented by the red line.
Figure 4 SplitSeek results vie wed in the UCSC genome browser. (a) Predicted splice junctions in the gene Fpgs. (b) The two grey boxes
give a schematic view of how deletions and insertions are detected. The genome browser image below shows the SplitSeek results in the last
exon and 3’ UTR of the Nol10 gene on chromosome 12. Three events are predicted, a splice junction (to the left), a deletion (in the middle,) and
an insertion (to the right). The predicted insertion and deletion are both supported by the mRNA AK148210, as indicated by the orange arrows
at the bottom.
Ameur et al. Genome Biology 2010, 11:R34
/>Page 5 of 9
which the two alignments are located within the same
exon to represent a putative deletion, because it is unli-
kely that this would correspond to a true splicing event.
In this manner, we predict ed 536 delet ions, with
343 (64%) located in the 3 ’UTRs (Table 3). The lower
percentage of deletions in 3’UTRs compared with inser-
tions could be due to a small proportion of splice events
being reported as deletions. SplitSeek can also output
other types of rearrangements, including inversions and
translocations, although such events will typically not be
found in RNA-seq data.
In the SplitSeek results, ~12% of the junctions
bridged between regions separated by ≥100 kb, and
26% did not connect two RefSeq exon boundaries (see
Table 2). In many studies, these types of predictions
might be the ones of highest interest because they
could reveal novel and unexpected splicing. Up until
now, it has been difficult (if at all possible) to study
such events on a global scale, and therefore, we
screened the SplitSeek results to see whether we could
find any example of novel and long-range splicing.
Interestingly, several of these predictions have strong
evidence. Figure 5 shows two examples of long-range
junctions (>100 kb) that bridge between RefSeq exons
and regions that were previously annotated by gene
prediction and EST data. Both examples in Figure 5
strongly suggest that an exon is missing in the current
RefSeq annotations. This demonstrates that SplitSeek
can detect novel splice events and be used as a way to
extend known gene models.
Discussion
Our results demonstrate that SplitSeek has a high speci-
ficity, and the number of false positives could be
reduced even further by requiring more unique reads to
cover each junction. A more difficult task is to increase
the sensitivity, but our comparison with the RNA-
MATE program [5] suggests that one possible way is to
use SplitSeek in combination with a complementary
method that aligns the reads to a library of known exon
boundaries. However, this comparison is focused only
on splicing between annotated exons, whereas one of
the strengths of SplitSeek is that it can perform other
typesofanalysisinwhichRNA-MATEorother
available tools cannot be directly applied. These inc lude
identification of splice sites in uncharacterized tran-
scripts, detection of long-range fusion transcripts, and
detection of small indels in transcribed sequences.
About 12% of the predicted junctions bridge between
regions separated by ≥100 kb (see Table 2). Although a
few of them can probably be explained by long introns
(for example, Figure 5), this can not account for all
detected long-range splicing and especially not the
junctions bridging between different chromosomes.
Instead, it is likely that many of them are false positives
because of alignment issues or properties of the gen-
ome sequence. As an example, we may falsely detect
splicing between different genes that belong to the
same family just because of high sequence similarity in
the exons. However, we cannot rule out that a substan-
tial number of these unexpected splicing events are
indeed true, and these would be interesting to investi-
gate further. In that case, it might be reasonable to
consider only the events bridging between regions
identified as significantly transcribed from the RNA-
seqdatatofilteroutalargepartofthefalse-positive
long-range splicings.
The main limiting factor in the SplitSeek method is
that there must be at least one read almost centered
ove r an exon boundary; otherwise, it will not be detect-
able. When using 50-bp reads and 22-bp anchors a s in
this study, seven (14%) o f 50 of the junction reads have
this property. With a length of 75 bp and still splitting
into 2 × 22 bp, this proportion w ould increase to
32 (43%) of 75, and this would likely increase the num-
ber of detected splicing events significantly. Another
benefit of longer reads is that they could allow longer
anchor lengths in the alignment, which might be neces-
sary to discover junctions that are not uniquely map-
pable with shorter reads. However, it also is possible to
increase the throughput by simply performing a deeper
sequencing by using more of the 50-bp reads, and it is
not obvious which is the op timal approach for this
application. Although several benefits exist of using
longer reads, some drawbacks might also occur, such as
lower-quality base calls at the ends of the reads and dif-
ficulties in identifying splicing between very short exons.
Because of the recent improvements in throughput
of the next-generation sequencing platforms, we
believe that this strategy will make it feasible to inves-
tigate the entire spectrum of splicing events or gene
fusionsinanRNAsampleinacompletelyunbiased
way. We also want to emphasize the possibility of find-
ing insertions, deletions, and o ther types of genetic
rearrangements with the SplitSeek approach. This
moves beyond the scope of RNA-seq data analysis,
because it can equally well be used for DNA samples
sequenced with high coverage.
Table 3 Number of predicted small insertions and
deletions within RefSeq exons and 3’UTRs
Oocyte 1 Oocyte 2 Oocyte 1+2
Insertions in RefSeq exons 222 412 647
Insertions in 3’ UTR 174 (78.4%) 320 (77.7%) 502 (77.6%)
Deletions in RefSeq exons 169 355 536
Deletions in 3’ UTR 113 (66.9%) 229 (64.5%) 343 (64.0%)
Deletions are required to be >5 bp from any RefSeq exon boundary.
Ameur et al. Genome Biology 2010, 11:R34
/>Page 6 of 9
Conclusions
We have developed a strategy for de novo detection of
splice junctions in RNA-seq data. The exon-exon
boundaries are identified almost at nucleotide resolution
and with a low false-positive rate, <1 in 10,000 for junc-
tions within 100 kb. Our method makes it possible to
study splice junctions and fusion genes while also quan-
tifying the gene expression, all from the same RNA-seq
data. In addition, our method reports insertions and
deletions in coding and noncoding parts of transcripts.
We expect this to be an important application in a wide
range of RNA-seq projects.
Materials and methods
Data acquisition and alignment
The raw RNA-seq data on mouse oocytes were down-
loaded from Gene Expression Omnibus [15], with acces-
sion number GSE:14605. The reads were aligned and
extended by using version 1.0 of the whole transcrip-
tome analysis tool available from Applied Biosystems
[16]. This software splits each read into two parts, or
“anchors,” which are aligned separately and extended as
far as possible while st ill matching the reference
sequence. We matched the reads by splitting into two
partsoflengths21to24,allowinguptotwo“ color
space” mismatches in each alignment. The minimum
score required for an alignment to be reported in the
final output was set to 20.
The SplitSeek program
Splice junctions were predicted from the alignment out-
put files by using the SplitSeek software, which consists
of two programs that are executed sequentially. In the
first step, all candidate junction reads are identified and
written to an intermediate BEDPE file. BEDPE is a file
format that was recently introduced to give a concise
description of paired-end sequence alignments [13].
This intermediate file is then used as input to a second
script that performs the remaining analysis. The algo-
rithm is split into two parts because the first program is
specific to the next-generation sequencing platform, in
this case, SOLiD, whereas the second script is more
general.
SplitSeek finds exon-exon boundaries that are sup-
ported by several split reads. In this case, we required
each junction to be covered b y at least two reads with
unique starting points. Other parameters that may be
specified by the user include the total number of reads
required to cover a predicted junction, and the maxi-
mum allowed distance between two candidate junction
reads that belong to the same predicted splice junction.
SplitSeek groups candidate junction reads by traversing
them in the order of their genomic coordinates and
joining those where the two exon boundaries are both
within the allowed distance. All groups in which the
number of reads is greater than the user-defined thresh-
old are then reported in the SplitSeek output. In some
Figure 5 Two long-range SplitSeek predictions (>100 kb) that extend known gene models. (a) A predicted junction that connects an
exon in the Ensembl Gene Prediction database with the second exon of the Phactr3 gene, suggesting the presence of an alternative
transcription start site. (b) A putative novel exon in the Sorcs2 gene that is currently only supported by EST data.
Ameur et al. Genome Biology 2010, 11:R34
/>Page 7 of 9
cases, SplitSeek may require an additional “ chrmap”
input file to ensure that the chromosome names of
SplitSeek predictions agree with those in the genome
databases. The user is allowed to specify an upper limit
on the distance between the junctions (for example,
100 kb), so that longer splicing events are not reported.
The SplitSeek results are presented in two different
formats, as a BED file and a BEDPE file. The BED file
can be uploaded and viewed in the UCSC genome
browser, whereas the BEDPE file can be used as input
to BEDTools [13] or other analysis software for compar-
ing genomic features. SplitSeek is implemented in perl,
and the program is available as Additional file 1. The
code also can be downloaded from the SOLiD software-
development community [17]. The current version is
available for data generated by the SOLiD system, but it
could be adapted to Illumina or other next-generation
sequencing platforms. What then would be required is
to perform a split read alignment and to write all candi-
date junction reads into a BEDPE formatted file to be
processed by SplitSeek.
Calculating False Discovery Rate
To make an estimate of the false discovery rate (FDR) in
our results, we assume a null hypothesis in which the
two parts of a splice event are uniformly distributed
over the genome sequence. We then estimated an FDR
for all splicing events within 1 Mb by comparing the
observed val ues with the expected. T o calculate the
number of expected events, we assume that the first
anchor has already been randomly mapped to the gen-
ome. In that case, the second anchor must be mapped
within a ± 1-Mb window surrounding the first anchor
for the criteria to be fulfilled. The size of this window is
2×10
6
bases. Because the mouse reference sequence
(mm9) used in the alignment consists of about 2.7 × 10
9
bases, the probability that t wo randomly placed splicing
boundaries are located within 1 Mb is ~2 × 10
6
/2.7 ×
10
9
≈ 7.4 × 10
-4
. Under the null hypothesis, the number
of expected splicing events within 1 Mb can therefore
be estimated by N × 7.4 × 10
-4
, where N is the total
number of predicted junctions. The FDR is then calcu-
lated as the ratio between expected/observed events. In
the same way, we calculated the FDR for results within
100 kb. The results are presented in Table 2.
Comparing SplitSeek to RNA-MATE
Version 1.01 of the RNA-MATE program was down-
loaded from the SOLiD software-d evelopment web page
[18], along with junction library files constructed from
all known genes, gene predictions, mRNA evide nce, and
EST evidence available at the time of creation (early
2007). The library files contains ~430,000 putative
junctions, each of length 60 bp. The RNA-MATE pro-
gramwasthenexecutedonthesamesetofreadsfrom
the oocyte1 dataset, as was used for SplitSeek. Matching
in RNA-MATE was done recursively with 50-bp and
45-bp tag lengths using three allowed mismatches a nd
default settings for all other parameters. The RNA-seq
data in this experiment is not strand specific, and there-
fore, all junction reads from both strands were com-
bined in the RNA-MATE output. All RNA-MATE exon
boundaries with at least two reads were considered posi-
tive. A positive RNA-MATE junction was considered to
coincide with a SplitSeek prediction if the difference was
at most 5 bp at both ends of the junction.
Additional file 1: SplitSeek. The SplitSeek program code, released as
free software under version 3 of the GNU General Public License [19].
Abbreviations
EST: expressed sequence tag; FDR: false discovery rate; RNA-seq: high-
throughput sequencing of RNA; 3’ UTR: three prime untranslated region.
Acknowledgements
We thank Jonathan Mangion, Applied Biosyst ems UK, for his helpful
suggestions regarding the software implementation. This work was
supported by the Swedish Natural Sciences Research Council.
Authors’ contributions
AA and UG designed the research; AA implemented the software and
conducted the analysis; and AA, AW, LF, and UG interpreted the results and
wrote the manuscript.
Received: 23 October 2009 Revised: 8 March 2010
Accepted: 17 March 2010 Published: 17 March 2010
References
1. Cloonan N, Forrest AR, Kolle G, Gardiner BB, Faulkner GJ, Brown MK,
Taylor DF, Steptoe AL, Wani S, Bethel G, Robertson AJ, Perkins AC, Bruce SJ,
Lee CC, Ranade SS, Peckham HE, Manning JM, McKernan KJ, Grimmond SM:
Stem cell transcriptome profiling via massive-scale mRNA sequencing.
Nat Methods 2008, 5:613-619.
2. Pan Q, Shai O, Lee LJ, Frey BJ, Blencowe BJ: Deep surveying of alternative
splicing complexity in the human transcriptome by high-throughput
sequencing. Nat Genet 2008, 40:1413-1415.
3. Sultan M, Schulz MH, Richard H, Magen A, Klingenhoff A, Scherf M,
Seifert M, Borodina T, Soldatov A, Parkhomchuk D, Schmidt D, O’Keeffe S,
Haas S, Vingron M, Lehrach H, Yaspo ML: A global view of gene activity
and alternative splicing by deep sequencing of the human
transcriptome. Science 2008, 321:956-960.
4. Wang ET, Sandberg R, Luo S, Khrebtukova I, Zhang L, Mayr C, Kingsmore SF,
Schroth GP, Burge CB: Alternative isoform regulation in human tissue
transcriptomes. Nature 2008, 456:470-476.
5. Cloonan N, Xu Q, Faulkner GJ, Taylor DF, Tang DT, Kolle G, Grimmond SM:
RNA-MATE: A recursive mapping strategy for high-throughput RNA-
sequencing data. Bioinformatics 2009, 25:2615-2616.
6. Tang F, Barbacioru C, Wang Y, Nordman E, Lee C, Xu N, Wang X, Bodeau J,
Tuch BB, Siddiqui A, Lao K, Surani MA: mRNA-Seq whole-transcriptome
analysis of a single cell. Nat Methods 2009, 6:377-382.
7. Denoeud F, Aury JM, Da Silva C, Noel B, Rogier O, Delledonne M,
Morgante M, Valle G, Wincker P, Scarpelli C, Jaillon O, Artiguenave F:
Annotating genomes with massive-scale RNA sequencing. Genome Biol
2008, 9:R175.
8. Trapnell C, Pachter L, Salzberg SL: TopHat: discovering splice junctions
with RNA-Seq. Bioinformatics 2009, 25:1105-1111.
Ameur et al. Genome Biology 2010, 11:R34
/>Page 8 of 9
9. Maher CA, Kumar-Sinha C, Cao X, Kalyana-Sundaram S, Han B, Jing X,
Sam L, Barrette T, Palanisamy N, Chinnaiyan AM: Transcriptome
sequencing to detect gene fusions in cancer. Nature 2009, 458:97-101.
10. Maher CA, Palanisamy N, Brenner JC, Cao X, Kalyana-Sundaram S, Luo S,
Khrebtukova I, Barrette TR, Grasso C, Yu J, Lonigro RJ, Schroth G, Kumar-
Sinha C, Chinnaiyan AM: Chimeric transcript discovery by paired-end
transcriptome sequencing. Proc Natl Acad Sci USA 2009, 106:12353-12358.
11. Chuzhanova NA, Anassis EJ, Ball EV, Krawczak M, Cooper DN: Meta-analysis
of indels causing human genetic disease: mechanisms of mutagenesis
and the role of local DNA sequence complexity. Hum Mutat 2003,
21:28-44.
12. Kent WJ, Sugnet CW, Furey TS, Roskin KM, Pringle TH, Zahler AM,
Haussler D: The human genome browser at UCSC. Genome Res 2002,
12:996-1006.
13. Quinlan AR, Hall IM: BEDTools: A flexible suite of utilities for comparing
genomic features. Bioinformatics 2010, 26:841-842.
14. UCSC Genome Bioinformatics. [].
15. Edgar R, Domrachev M, Lash AE: Gene Expression Omnibus: NCBI gene
expression and hybridization array data repository. Nucleic Acids Res 2002,
30:207-210.
16. AB WT Analysis Pipeline. [ />transcriptome].
17. SplitSeek. [ />18. RNA-MATE. [ />19. GNU Operating System Licences. [ />doi:10.1186/gb-2010-11-3-r34
Cite this article as: Ameur et al.: Global and unbiased detection of
splice junctions from RNA-seq data. Genome Biology 2010 11:R34.
Submit your next manuscript to BioMed Central
and take full advantage of:
• Convenient online submission
• Thorough peer review
• No space constraints or color figure charges
• Immediate publication on acceptance
• Inclusion in PubMed, CAS, Scopus and Google Scholar
• Research which is freely available for redistribution
Submit your manuscript at
www.biomedcentral.com/submit
Ameur et al. Genome Biology 2010, 11:R34
/>Page 9 of 9