Báo cáo y học: " Microarray-based genomic surveying of gene polymorphisms in Chlamydia trachomatis" ppsx
Bạn đang xem bản rút gọn của tài liệu. Xem và tải ngay bản đầy đủ của tài liệu tại đây (251.74 KB, 9 trang )
Genome Biology 2004, 5:R42
comment reviews reports deposited research refereed research interactions information
Open Access
2004Brunelleet al.Volume 5, Issue 6, Article R42
Method
Microarray-based genomic surveying of gene polymorphisms in
Chlamydia trachomatis
Brian W Brunelle
*
, Tracy L Nicholson
*
and Richard S Stephens
*†
Addresses:
*
Program in Infectious Diseases, University of California, Berkeley, CA 94720-7360, USA.
†
Francis I. Proctor Foundation, University
of California, San Francisco, CA 94143-0412, USA.
Correspondence: Richard S Stephens. E-mail:
© 2004 Brunelle et al.; licensee BioMed Central Ltd. This is an Open Access article: verbatim copying and redistribution of this article are permitted in all
media for any purpose, provided this notice is preserved along with the article's original URL.
Microarray-based genomic surveying of gene polymorphisms in Chlamydia trachomatis<p>By comparing two fully sequenced genomes of <it>Chlamydia trachomatis </it>using competitive hybridization on DNA microarrays, a logarithmic correlation was demonstrated between the signal ratio of the arrays and the 75-99% range of nucleotide identities of the genes. Variable genes within 14 uncharacterized strains of C. trachomatis were identified by array analysis and verified by DNA sequencing. These genes may be crucial for understanding chlamydial virulence and pathogenesis.</p>
Abstract
By comparing two fully sequenced genomes of Chlamydia trachomatis using competitive
hybridization on DNA microarrays, a logarithmic correlation was demonstrated between the signal
ratio of the arrays and the 75-99% range of nucleotide identities of the genes. Variable genes within
14 uncharacterized strains of C. trachomatis were identified by array analysis and verified by DNA
sequencing. These genes may be crucial for understanding chlamydial virulence and pathogenesis.
Background
New genomes are continuously being sequenced, offering
insight into relationships among a multitude of organisms.
Because of the relatively high cost, multiple genomes within a
species are rarely sequenced, as it is difficult to justify a full
genome effort for the relatively little novel, albeit potentially
important, information gained. Fortunately, microarrays can
be used to rapidly screen an entire genome for such data. Pre-
viously, identification of genomic variability using microarray
analysis was limited to those genes that were either absent or
highly divergent [1-7]. Only recently has the use of microar-
rays been expanded to detect differences among closely
related strains/isolates at the nucleotide level [8]. This
increased resolution offers a greater insight into the level of
diversification within a species or population, and this can
lead to the characterization of genes linked to unique biologi-
cal attributes such as pathogenesis.
The power of microarrays for comparative genomic purposes
is the ability to discover what may be only a few informative
loci among thousands. Additional evolutionary and biological
functionality tests can then be pursued on these few genes.
Rapid and sensitive assays such as microarrays are important
for organisms that are highly conserved and undergo little to
no horizontal gene movement (that is, recombination or plas-
mid acquisition). Traditional genotyping tests, such as pulse-
field gel electrophoresis (PFGE) or restriction fragment
length polymorphism (RFLP), are relatively insensitive in
such circumstances [9]. In these assays, the absence of gene
movement results in DNA fragments that differ in size solely
due to the loss and/or gain of specific restriction sites, which
will be a rare event in very similar genomes. Even if an RFLP
assay identifies variability between two samples, it provides
no specific information regarding the genes in which these
changes are located. It is these nucleotide changes that under-
lie the amino acid sequence and its corresponding protein
function that ultimately influences the fitness of an organism.
Our goal was to use microarrays as a comparative genomics
tool to identify nucleotide polymorphisms among the many
closely related strains of Chlamydia trachomatis.
C. trachomatis is an obligate intracellular bacterium with a
worldwide distribution. It has a genome of 1.04 megabases
(Mb) consisting of 894 open reading frames (ORFs) between
135 and 5,358 nucleotides long, with a median length of 867
nucleotides. Because of its sequestered lifestyle, acquisition of
Published: 18 May 2004
Genome Biology 2004, 5:R42
Received: 13 February 2004
Revised: 26 March 2004
Accepted: 1 April 2004
The electronic version of this article is the complete one and can be
found online at />R42.2 Genome Biology 2004, Volume 5, Issue 6, Article R42 Brunelle et al. />Genome Biology 2004, 5:R42
exogenous DNA is considered to have played a limited part in
the subsequent evolution of the species after the organisms
moved into their intracellular niche and became environmen-
tally and genetically isolated nearly a billion years ago [10,11].
Consequently, diversity in chlamydial genomes is mostly a
result of nucleotide substitutions and gene loss [12]. Over the
course of evolutionary history, the accumulation of these dif-
ferences has led to the present-day biovariants of C. trachom-
atis, such as those that infect humans or mice. Two
biovariants exist within the human-specific strains, which
together consist of more than 15 serovariants and occupy one
of three distinct biological niches upon infection. Among the
trachoma biovar, serovars A, B, Ba and C are associated with
ocular infection, and serovars D through K are associated
with urogenital infection. Serovars L1, L2 and L3 compose the
lymphogranuloma venereum (LGV) biovar and infect lym-
phatic tissue [13]. Despite these three distinct tissue tropisms
among the strains of C. trachomatis, their genomes are all
highly similar [14]. In addition to the human strains, there is
the closely related C. trachomatis murine biovar, mouse
pneumonitis (MoPn), which has been reported to originate
from the respiratory epithelial tissue of mice [15].
For C. trachomatis to achieve niche-specific functions with-
out acquiring exogenous DNA, nucleotide changes must have
occurred in some genes that could account for diverse biolog-
ical capabilities. An example of this is the loss of tryptophan
synthase function in the strains associated with ocular infec-
tion, a change that purportedly facilitates their persistence in
this particular biological niche [16-18]. All strains isolated
from ocular infections were found to have a defective gene
within the trp pathway; no strains of urogenital origin were
found to harbor such mutations within this region [16].
Although the loss of function was often a result of a single pol-
ymorphism within a gene in the trp pathway, it is evident that
such small changes can have a dramatic effect on the resulting
phenotype and success of an organism. The genes that pos-
sess such critical differences among the serovars of C. tracho-
matis may be identified through the use of microarrays.
Results
Limiting the effects of bias
Because microarrays are competition-based assays, DNA
sequences that are identical for a particular gene in the fluo-
rescently labeled test and reference strains will bind with
equal affinity to the corresponding immobilized fragment on
the array, thereby yielding equivalent signal ratios. A poly-
morphism is indicated by an increase in the signal ratio at a
particular gene region on the array, due to the preferential
hybridization of the most closely related reference DNA frag-
ment to the complementary test sequence.
If there are changes in the signal ratio that do not result from
variation in the nucleotide sequence of the test DNA, these
regions of the array need to be identified as they will skew the
data. To identify the loci in the C. trachomatis microarray
that may be intrinsically biased towards a higher signal ratio,
the reference/array strain (D/UW-3) was used as both the
analyte and reference DNA. In this test, every gene has a
100% match that should result in equal signals for each gene
region on the array. Most loci on the array produced equiva-
lent signals, although the results indicated a few anomalous
gene regions (data not shown). One such locus, ribE, was
found to have a high signal ratio in several of the other serov-
ars as well, which should correlate with a high degree of poly-
morphism in these strains. However, sequence analysis of the
ribE region from all the strains revealed little or no nucleotide
variation (99.6-100% identity; GenBank accession nos
AY542692-AY542704). It was found that 28 genes from the
D/UW-3 versus D/UW-3 array data were above the 95% con-
fidence interval as determined by a one-tailed Z-test, and
were therefore removed from subsequent experimental data-
sets in order to eliminate possible confounding bias in the
comparisons of other strains at these regions.
Microarray analysis of MoPn
The MoPn biovar of C. trachomatis was selected to establish
experimentally that microarray analysis could assess relative
levels of nucleotide variation between two related strains. As
the genomes of both MoPn and the source strain used to make
the microarray (D/UW-3) are known, and were found to be in
almost perfect synteny [19,20], the percent nucleotide iden-
tity between each DNA fragment on the array and its comple-
mentary orthologous sequence in MoPn was determined.
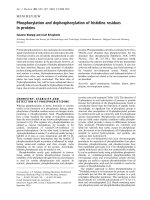
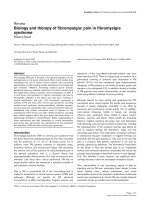
Overall, the spectrum of sequence identities among all gene
pairs from the array ranged from 43% to 99%, and each pair
in an integer continuum of 66-99% identity was represented
at least once (Figure 1). This range of identities is broader
than that characterized in previous studies [8] and proved to
Frequency of gene pair identities between MoPn and D/UW-3Figure 1
Frequency of gene pair identities between MoPn and D/UW-3. The
percent identity for each orthologous gene pair between C. trachomatis
serovars D/UW-3 and MoPn was established and rounded to the nearest
whole number. The number of times each nucleotide identity occurred
was then determined.
49 54 59 64 69 74 79 84 89 94 99
Identity (%)
Number of gene pairs
0
20
40
60
80
100
Genome Biology 2004, Volume 5, Issue 6, Article R42 Brunelle et al. R42.3
comment reviews reports refereed researchdeposited research interactions information
Genome Biology 2004, 5:R42
be robust for establishing the sensitivity of the relationship
with the array data.
When the nucleotide identity for each gene pair between 43%
and 99% was compared to its corresponding array signal
ratio, the results indicated a logarithmic relationship between
the two; as the level of nucleotide identity decreased from
99%, there was an exponential increase in the microarray sig-
nal ratio (Figure 2). Below 75% identity, however, the rela-
tionship diminished. Because a correlation exists between the
signal ratio and nucleotide identities between 75% and 99%,
microarrays can be used to assess the relative level of nucle-
otide differences in genes in otherwise unknown genomes.
Those regions below the 75% identity threshold can only be
assessed as highly divergent or perhaps absent.
Microarray analysis of C. trachomatis
Having demonstrated that nucleotide difference is correlated
with the microarray signal ratio, 14 different C. trachomatis
strains representing 14 human serovars (A, B, Ba, C, E, F, G,
H, I, J, K, L1, L2, L3) were tested to identify gene regions that
were polymorphic compared with the reference strain D/UW-
3. For each strain, the microarray data were ordered from
highest to lowest signal (see Additional data file 1). The high-
est rank, 1, indicates the highest signal ratio and therefore
represents the locus with the most variation between the test
and reference strains. Conversely, the low-ranking sites
should have little to no sequence polymorphism. As the C.
trachomatis genomes are all highly similar, the top-ranking
genes within each test strain were of significance, as these
should be the regions that contain the most nucleotide differ-
ences (Table 1).
Verification of array data
To confirm that the microarray analysis had identified nucle-
otide variability among the various genomes, several high-
ranking genes were chosen, on the basis of biological interest,
to be sequenced and compared to the reference DNA
sequence. These genes, which were predicted to be polymor-
phic from the array data, were found to contain nucleotide
differences that were evenly distributed throughout the
sequences (Table 2a). Several of the same genes from strains
in which the locus was not predicted to be variable were then
sequenced to verify the discriminatory powers of the assay; as
expected, these regions did not contain sequence polymor-
phisms (Table 2b). In addition, those genes that had previ-
ously been described to harbor few to no polymorphisms were
not found to have any significant signal ratios (that is, gseA,
trpB, 16S) [17,21]. The well-characterized and sequence-vari-
able ompA gene [22] was among the highest in rank and
nucleotide diversity among many of the strains. B/TW-5 was
the only strain used in this study with known gene deletions
as it is lacking the trp operon and several neighboring genes
(CT162-171) [18]. Congruent with these findings, the array
data from B/TW-5 indicated that these genes are absent or
otherwise highly divergent (Table 1). As this region was not
highly ranked in any of the other strains, the results indicated
that the trp operon was present in the remainder of the
strains. The CT868 gene region of strain L1/440 was interest-
ing because of the fact that its high signal ratio and high rank
were not entirely due to nucleotide variation (2.2% differ-
ence); there was also a 33 base-pair (bp) deletion in the L1/
440 sequence, indicating that the array is sensitive to inser-
tions/deletions as well as nucleotide variations and gene loss.
Differences between biological groups
An organism with a specific tissue tropism will have evolved
differences in its genome as a result of the selection of muta-
tions that promote its survival in that particular biological
niche. Therefore, those genes that are different within all the
strains of one of the three pathobiological groups of C. tracho-
matis (ocular, urogenital or lymphogranuloma) may have
been selected as a result of niche-specific pressures (Table 3).
For example, a gene identified as variable in serovars A, B, Ba
and C may confer an advantage in the ocular environment.
Such group-specific changes may be directly associated with
differences in phenotypes, and would be important for future
functional experiments. However, there were very few genes
overall that were classified as different within one biological
niche from all the strains tested. Of the 31 niche-specific
genes identified, 16 coded for hypothetical genes (5.3% of all
hypothetical ORFs) and 15 were from known genes (2.6% of
all named genes).
Discussion
The ability to use the C. trachomatis array as a screening tool
for DNA polymorphisms was first demonstrated by determin-
ing the nucleotide identities for each of 830 gene regions
Relationship between the signal ratios and sequence identities for the MoPn vs D/UW-3 DNA microarrayFigure 2
Relationship between the signal ratios and sequence identities for the
MoPn vs D/UW-3 DNA microarray. The average signal ratio of each
orthologous gene pair between C. trachomatis serovars D/UW-3 and MoPn
was log
2
transformed. These values were then compared to the
corresponding nucleotide identity for each gene pair, yielding a linear
association.
Identity (%)
Signal ratio
0.0
0.5
1.0
1.5
2.0
2.5
3.0
3.5
4.0
40 50 60 70 80 90 100
R42.4 Genome Biology 2004, Volume 5, Issue 6, Article R42 Brunelle et al. />Genome Biology 2004, 5:R42
Table 1
The ten highest-ranked signal ratios and their corresponding genes for each serovar
Rank Gene SR* SEM
†
Gene SR SEM Gene SR SEM
A/Har-1 B/TW-5 Ba/Apache-2
1 166 4.04 ± 0.63 163 8.21 ± 2.78 870 (pmpF)3.39±0.39
2 681 (ompA) 3.91 ± 0.34 166 6.65 ± 0.87 861 2.77 ± 0.16
3 679 (tsf) 3.56 ± 0.15 164 4.29 ± 0.46 851 (map)2.73±0.25
4 622 2.93 ± 0.21 167 4.09 ± 0.50 166 2.67 ± 0.19
5 51 2.84 ± 0.06 171 (trpA) 4.02 ± 0.73 860 2.63 ± 0.23
6 688 (parB) 2.81 ± 0.10 165 3.89 ± 0.56 874 (pmpI)2.61±0.16
7 870 (pmpF) 2.76 ± 0.16 170 (trpB) 3.81 ± 0.41 688 (parB)2.60±0.25
8 161 2.72 ± 0.11 162 3.80 ± 0.28 792 (mutS)2.60±0.32
9 49 2.55 ± 0.18 168 2.94 ± 0.19 852 (yhgN)2.58±0.32
10 672 (fliN) 2.53 ± 0.19 207 (pfkA) 2.90 ± 1.21 855 (fumC)2.58±0.20
C/TW-3 E/Bour F/IC-CAL3
1 166 3.66 ± 0.29 675 (karG) 3.60 ± 0.25 680 (rs2)6.28±1.69
2 681 (ompA) 2.59 ± 0.31 161 3.40 ± 0.33 679 (tsf)4.48±0.17
3 672 (fliN) 2.40 ± 0.15 870 (pmpF) 3.37 ± 0.20 681 (ompA)3.45±0.17
4 864 (xerC/D) 2.39 ± 0.11 688 (parB) 3.33 ± 0.21 677 (frr)3.17±0.34
5 161 2.38 ± 0.14 792 (mutS) 3.32 ± 0.31 873 2.87 ± 0.09
6 860 2.37 ± 0.16 836 (pheS) 3.20 ± 0.10 649 (ygfA)2.53±0.08
7 696 2.35 ± 0.10 839 3.11 ± 0.16 622 2.24 ± 0.17
8 675 (karG) 2.30 ± 0.11 694 3.11 ± 0.34 696 2.19 ± 0.12
9 694 2.28 ± 0.07 686 3.10 ± 0.16 49 2.04 ± 0.22
10 688 (parB) 2.28 ± 0.06 761 (murG) 3.07 ± 0.08 429 1.94 ± 0.20
G/UW-57 H/UW-4 I/UW-12
1 681 (ompA) 5.12 ± 0.69 161 2.77 ± 0.16 870 (pmpF)3.80±0.08
2 696 2.30 ± 0.03 622 2.65 ± 0.12 792 (mutS)3.15±0.18
3 291 (ptsN) 2.23 ± 0.22 761 (murG) 2.58 ± 0.16 161 3.12 ± 0.09
4 674 (yscC) 2.10 ± 0.13 839 2.53 ± 0.18 360 3.09 ± 0.03
5 175 (oppA) 2.10 ± 0.08 427 2.40 ± 0.11 686 2.97 ± 0.18
6 84 2.07 ± 0.01 870 (pmpF) 2.38 ± 0.09 840 (mesJ)2.94±0.17
7 539 (trxA) 2.03 ± 0.21 675 (karG) 2.38 ± 0.08 812 (pmpD)2.93±0.32
8 475 (pheT) 2.00 ± 0.83 688 (parB) 2.30 ± 0.09 688 (parB)2.91±0.11
9 672 (fliN) 1.99 ± 0.08 216 (xasA) 2.29 ± 0.08 49 2.90 ± 0.14
10 385 (ycfF) 1.97 ± 0.36 783 2.29 ± 0.22 598 2.89 ± 0.34
J/UW-36 K/UW-31 L1/440
1 369 (aroB) 3.83 ± 0.30 681 (ompA) 8.45 ± 1.42 166 3.45 ± 0.38
2 427 3.76 ± 0.23 84 4.07 ± 0.48 870 (pmpF)3.01±0.34
3 476 3.72 ± 0.37 175 (oppA) 2.86 ± 0.31 161 2.72 ± 0.28
4 870 (pmpF) 3.64 ± 0.25 291 (ptsN) 2.37 ± 0.10 760 (ftsW)2.69±0.20
5 792 (mutS) 3.53 ± 0.12 696 2.29 ± 0.09 868 2.66 ± 0.16
6 360 3.48 ± 0.15 557 (lpdA) 2.26 ± 0.09 167 2.59 ± 0.08
7 836 (pheS) 3.40 ± 0.18 298 (sms) 2.17 ± 0.11 144 2.59 ± 0.12
8 797 (pgsA) 3.38 ± 0.29 577 2.14 ± 0.19 872 (pmpH)2.53±0.21
9 839 3.35 ± 0.08 656 2.12 ± 0.11 761 (murG)2.47±0.13
10 507 (rpoA) 3.33 ± 0.14 461 (yaeI) 2.07 ± 0.11 839 2.46 ± 0.09
Genome Biology 2004, Volume 5, Issue 6, Article R42 Brunelle et al. R42.5
comment reviews reports refereed researchdeposited research interactions information
Genome Biology 2004, 5:R42
between two known genomes - C. trachomatis D/UW-3 and
C. trachomatis MoPn [19,20] - and then comparing these
identities to their corresponding signal ratios. As a locus
became more variable on the nucleotide level, its relative sig-
nal ratio concomitantly increased as a logarithmic function.
Previous studies using Helicobacter pylori microarrays con-
cluded that the relationship between gene identity and the
array signal was valid only for those regions above 81% [8].
However, the strains used in that analysis lacked sufficient
regions below 81% identity to assess the prospect of a lower
cut-off. As the two C. trachomatis genomes had a strong rep-
resentation of orthologous gene regions with a continuous
range of identities from 66% to 99%, it was determined that
the logarithmic relationship of the signal ratios diminished in
regions below 75% identity, thus delineating this as the lower
limit of the association.
One factor that may skew the logarithmic relationship
between signal ratios and the corresponding nucleotide iden-
tities for some of the gene regions is insertion and deletion.
Insertions and deletions can affect hybridization in two ways
depending on whether they are present in the test- or in the
reference-strain gene. An insertion in a test-strain gene will
cause the region to be longer than the complementary
sequence on the array, forcing the test DNA at that point to
fold during hybridization. A deletion in part of a test-strain
gene will prevent proper alignment with the target region, as
the DNA sequence on the microarray has a novel segment for
which the test strain lacks a complement for hybridization. In
addition, the test-strain DNA will not span the unique
sequence on the array to align with the nucleotides on both
sides. Either an insertion or a deletion will result in a signal
ratio higher than expected from the overall nucleotide iden-
tity of the gene region, as was seen with the 33 bp deletion in
gene CT868 of the L1/440 strain.
Another factor that could affect the correlation of the signal
ratio with nucleotide identity is the presence of multiple
homologous sequences within a genome. Even if a gene is
identical between a test and reference strain, regions of nucle-
otide similarity found elsewhere in the genome would com-
pete for hybridization to the target region on the array,
thereby skewing the signal ratio of the intended gene pair.
This may have a profound effect when one is studying genes
that have paralogs due to recent gene duplication events, as
they may confound the array data because of their regions of
similarity. In C. trachomatis this is not an issue, as its para-
logs [12] lack significant nucleotide similarity as a result of
their ancient duplication events pre-dating chlamydial diver-
sification. Therefore, enough changes have occurred to avoid
such bias.
Differences among C. trachomatis strains were identified by
microarray analysis and confirmed by subsequent DNA
sequencing. Specific genes that were found to vary in one or
more genomes may have become fixed either by chance or by
selection. If these genes were selected because they offered an
advantage in fitness, then they may contribute to phenotypic
differences between the serovars. A possible example of this
is the tsf (elongation factor TS (EF-TS)) gene, which is a GDP-
dissociation protein that plays an important role in protein
biosynthesis and may have a direct role in the chlamydial
developmental cycle [23]. This region was found to be poly-
morphic in strains A/Har1 and F/IC-Cal3, and the respective
nucleotide differences resulted in 12 and 13 amino-acid sub-
stitutions over a portion of the coding region when compared
to strain D/UW-3. Although none of the predicted binding
sites of EF-TS for EF-Tu was variable, conformational
changes in a protein involved in the regulation of other pro-
teins, especially those associated with the developmental
cycle, may have a direct effect on the overall fitness or pheno-
type of an organism.
L2/434 L3/404
1 166 9.90 ± 1.26 166 11.61 ± 0.29
2 167 5.72 ± 1.23 681 (ompA)6.46±0.39
3 84 5.68 ± 1.12 167 6.15 ± 0.46
4 165 5.27 ± 1.60 165 4.93 ± 0.55
5 173 3.82 ± 0.50 622 3.85 ± 0.23
6681 (ompA) 3.25 ± 0.37 173 3.69 ± 0.23
7 144 3.23 ± 0.21 144 3.67 ± 0.32
8 622 3.09 ± 0.12 619 3.23 ± 0.05
9 619 2.95 ± 0.29 870 (pmpF)2.71±0.19
10 870 (pmpF) 2.57 ± 0.05 293 (accD)2.65±0.03
*Average signal ratio;
†
Standard error of the mean.
Table 1 (Continued)
The ten highest-ranked signal ratios and their corresponding genes for each serovar
R42.6 Genome Biology 2004, Volume 5, Issue 6, Article R42 Brunelle et al. />Genome Biology 2004, 5:R42
Table 2
Sequence differences in those regions predicted to contain polymorphisms on the basis of microarray data
Serovar Gene SR* Rank
†
Difference (%)
‡
GenBank ID
§
(a) High-ranking genes
A/Har-1 CT679 (tsf) 3.6 3 7.9 AY539791
A/Har-1 CT622 2.9 4 2.2 AY539765
A/Har-1 CT870 (pmpF) 2.8 7 7.5 AY539793
A/Har-1 CT681 (ompA) 3.9 2 21.6 J03813
B/TW-5 CT870 (pmpF) 2.1 23 7.5 AY539794
B/TW-5 CT681 (ompA) 2.2 16 6.4 M17342
Ba/AP-2 CT870 (pmpF) 3.4 3 7.5 AY539795
Ba/AP-2 CT675 (karG) 2.6 25 2.9 AY539779
C/TW-3 CT870 (pmpF) 2.3 13 7.5 AY539796
C/TW-3 CT681 (ompA) 2.6 2 22.0 M17343
E/Bour CT622 2.8 30 9.2 AY539768
E/Bour CT675 (karG) 3.6 2 4.2 AY539781
F/IC-CAL3 CT622 2.2 7 9.1 AY539769
F/IC-CAL3 CT679 (tsf) 4.5 2 7.6 AY539790
F/IC-CAL3 CT681 (ompA) 3.5 3 15.8 X52080
G/UW-57 CT681 (ompA) 5.1 1 19.1 AF063199
H/UW-4 CT622 2.7 4 1.2 AY539771
J/UW-36 CT870 (pmpF) 3.6 14 7.5 AY539798
K/UW-31 CT681 (ompA) 8.5 1 21.2 AF063204
L1/440 CT622 2.5 17 13.3 AY539775
L1/440 CT868 2.7 9 2.2
¶
AY539792
L1/440 CT870 (pmpF) 3.0 4 14.6 AY539803
L2/434 CT144 3.2 7 10.8 AY539751
L2/434 CT293 (accD) 2.5 11 3.4 AY539763
L2/434 CT622 3.1 8 13.3 AY539776
L2/434 CT870 (pmpF) 2.6 10 14.6 AY539804
L2/434 CT681 (ompA) 3.2 6 10.5 M14738
L3/404 CT293 (accD) 2.7 10 3.4 AY539764
L3/404 CT681 (ompA) 6.5 2 21.1 X55700
L3/404 CT622 3.8 5 13.3 AY539777
L3/404 CT870 (pmpF) 2.7 9 14.6 AY539805
(b) Intermediate- to low-ranking genes
A/Har-1 CT293 (accD) 1.9 307 0.0 AY539752
B/TW-5 CT293 (accD) 1.5 406 0.0 AY539753
Ba/AP-2 CT293 (accD) 1.7 330 0.0 AY539754
C/TW-3 CT293 (accD) 1.6 403 0.0 AY539755
E/Bour CT293 (accD) 1.8 372 0.4 AY539756
F/IC-CAL3 CT293 (accD) 1.2 521 0.4 AY539757
G/UW-57 CT293 (accD) 1.3 365 0.0 AY539758
Genome Biology 2004, Volume 5, Issue 6, Article R42 Brunelle et al. R42.7
comment reviews reports refereed researchdeposited research interactions information
Genome Biology 2004, 5:R42
Genes that were found to be polymorphic within all serovars
of a particular biological or tissue tropism group may repre-
sent the selection of mutations due to niche-specific pressures
for survival within that environment. The fliN (flagellar
motor switch domain) gene, which is thought to serve a role
in the type III secretion system in C. trachomatis, was found
to be variable in serovars A-C and L1-L3. In other organisms
with type III secretion systems, this gene encodes a protein
involved in the switch complex, and amino-acid changes in
this region have been shown to have an effect on levels of
secretion [24]. By analogy, changes in the fliN gene of C. tra-
chomatis may have resulted in altered phenotypes, leading to
an increase in fitness for a particular biological niche and its
subsequent selection.
It appears that the three distinct tissue tropisms for strains of
C. trachomatis (that is, ocular, urogenital and lymph node)
are due to relatively few changes within the coding regions, as
there were only 31 genes that were classified as being variable
within all strains of a biological niche; interestingly, the
majority of these genes code for hypothetical proteins of
unknown function. With such globally low differences
between all the genomes of C. trachomatis, those few substi-
tutions that have become fixed within the population would
have conferred a benefit; otherwise they would have been lost
by chance. These genes could be essential in the goal of estab-
lishing the genetic basis for the different tissue tropisms of C.
trachomatis, as well as providing a basis for future function-
ality tests.
Conclusions
DNA microarray technology can serve as a rapid tool for iden-
tifying regions of polymorphisms in otherwise unknown iso-
lates of C. trachomatis as it has the potential to quickly reduce
a genome of a thousand genes to a handful of meaningful
sites. Without a genetic model for C. trachomatis, the nucle-
otide differences identified in this study may offer the best
insights into assessing gene function among phenotypically
distinct strains.
Materials and methods
Bacterial strains, growth conditions, and preparation of
genomic DNA
C. trachomatis strains (A/Har1, B/TW-5, Ba/Apache-2, E/
Bour, F/IC-Cal 3, G/UW-57, H/UW-4, I/UW-12, J/UW-36,
K/UW-31) were kindly provided by J. Schachter, University
of California, San Francisco. C. trachomatis strains (A/Har1,
B/TW-5, Ba/Apache-2, C/TW-3, D/UW-3, E/Bour, F/IC-Cal
3, G/UW-57, H/UW-4, I/UW-12, J/UW-36, K/UW-31, L1/
440, L2/434, L3/404, MoPn) were propagated in HeLa229
cell monolayers in T-150 flasks containing RPMI medium
(Invitrogen) supplemented with 10% fetal bovine serum and
50 µg/ml vancomycin. Chlamydial elementary bodies were
isolated by sonic treatments of cell suspensions and purified
by ultracentrifugation over 30% and 30/44% discontinuous
Renografin gradients (E.R. Squibb and Sons, Princeton, NJ)
as previously described [25]. Aliquots were frozen at -80°C in
sucrose-phosphate-glutamate buffer. Before hybridization,
chlamydial elementary bodies were washed and genomic
DNA from each strain was prepared by proteinase-K diges-
tion, phenol/chloroform extraction, and ethanol precipita-
tion [26].
Hybridizations and data analysis
PCR fragments representing an average of 60% of each ORF
from the genome of C. trachomatis strain D/UW-3 were spot-
ted in duplicate per microarray slide [27]. The gene region
represented by each array probe was chosen on the basis of
the ability to create primer pairs specific for amplification of
the longest possible target region, thereby preventing any
bias in the selection of particular regions. For each slide,
hybridization with the immobilized microarray DNA was
measured between the reference strain DNA (D/UW-3) and
one test strain DNA. Using random primers as stated in the
H/UW-4 CT293 (accD) 1.7 305 0.0 AY539759
J/UW-36 CT293 (accD) 2.0 299 0.0 AY539761
K/UW-31 CT622 1.3 375 0.0 AY539774
G/UW-57 CT675 (karG) 1.2 469 0.0 AY539783
K/UW-31 CT675 (karG) 1.3 475 0.0 AY539787
F/IC-CAL3 CT870 (pmpF) 1.2 489 0.0 AY539798
G/UW-57 CT870 (pmpF) 1.1 673 0.0 AY539799
K/UW-31 CT870 (pmpF) 1.2 626 0.0 AY539802
*Average signal ratio;
†
rank based on signal ratio within that strain;
‡
percent nucleotide difference of region between test strain and
reference strain;
§
GenBank accession number;
¶
contained 33-bp deletion.
Table 2 (Continued)
Sequence differences in those regions predicted to contain polymorphisms on the basis of microarray data
R42.8 Genome Biology 2004, Volume 5, Issue 6, Article R42 Brunelle et al. />Genome Biology 2004, 5:R42
BioPrime DNA Labeling System Kit (Invitrogen), D/UW-3
genomic DNA (0.2 µg) was labeled with Cy5 dye-labeled
nucleotides, whereas all test DNA (0.2 µg) were labeled with
Cy3 dye-labeled nucleotides (Invitrogen). Buffer exchange,
purification, and concentration of the labeled-DNA products
were accomplished as previously described [27]. The two
labeled-DNA samples to be compared were mixed, heat dena-
tured (95°C for 3 min), and applied to a chlamydial-DNA
microarray in a hybridization mixture containing 3.5 × SSC,
0.3% SDS, and 10 µg yeast tRNA [27]. All hybridizations took
place under a glass coverslip in a 75°C water bath overnight,
except for the MoPn versus D/UW-3 comparison, which was
conducted in a 65°C water bath overnight. The slides were
washed, dried, and scanned using a GenePix Scanner 4000A
and the resulting 16-bit TIFF images were analyzed using
GenePix Pro 4.0 software (Axon Instruments). Only spots
with greater than 60% of all pixels having intensities greater
than average background intensities were used for analysis.
To reduce the effects of variation in array quality, each
hybridization was performed at least twice, giving a minimum
of four data points for each gene region of a strain as the
genome is printed twice per slide. Data for duplicate readings
and each hybridization experiment were normalized on the
basis of the overall median percent intensity to eliminate
slide-to-slide variation.
Percent identity between strains D/UW-3 and MoPn
Each gene region from the D/UW-3 array was aligned with
the corresponding orthologous sequence from MoPn using
ClustalX [28], and Mega2 was used to assess the number of
nucleotide differences [29]. The percent identity for each
region was determined by dividing the number of identical
sites between two sequences by the total number of sites, and
then multiplying by 100.
Sequence analysis
For sequence analysis, the gene regions corresponding to the
array probe of interest were amplified by PCR and sequenced
in both the 5' and 3' direction on an ABI PRISM 377 DNA
Sequencer (Applied Biosystems) and were deposited in Gen-
Bank (accession numbers AY539751-AY539805; AY542692-
AY542704). Sequences for the ompA gene were taken from
Stothard et al. [30]. The percent nucleotide identity between
each test region and the reference sequence represented on
the array was calculated as described above.
Additional data files
A complete table (Additional data file 1) containing the signal
ratios for each gene (about 900) and their corresponding rank
within each serovar (14 each) is available with the online ver-
sion of this article. Table 1 of the text is a subset of these data.
Additional data file 1A complete table containing the signal ratios for each gene (about 900) and their corresponding rank within each serovar (14 each)A complete table containing the signal ratios for each gene (about 900) and their corresponding rank within each serovar (14 each)Click here for additional data file
Acknowledgements
We thank Gary K. Schoolnik and Kevin Visconti for assistance in printing
the microarray slides and Jeanne Moncada for help in the propagation of
several of the chlamydial strains. We also thank George F. Sensabaugh for
input and suggestions and P. Scott Hefty for laboratory assistance and crit-
ical review of the manuscript. This research was supported by the National
Institutes of Health grant AI042156.
References
1. Murray AE, Lies D, Li G, Nealson K, Zhou J, Tiedje JM: DNA/DNA
hybridization to microarrays reveals gene-specific differ-
ences between closely related microbial genomes. Proc Natl
Acad Sci USA 2001, 98:9853-9858.
2. Salama N, Guillemin K, McDaniel TK, Sherlock G, Tompkins L,
Falkow S: A whole-genome microarray reveals genetic diver-
sity among Helicobacter pylori strains. Proc Natl Acad Sci USA
2000, 97:14668-14673.
3. Israel DA, Salama N, Krishna U, Rieger UM, Atherton JC, Falkow S,
Peek RM Jr: Helicobacter pylori genetic diversity within the
gastric niche of a single human host. Proc Natl Acad Sci USA 2001,
98:14625-14630.
4. Dorrell N, Mangan JA, Laing KG, Hinds J, Linton D, Al-Ghusein H,
Barrell BG, Parkhill J, Stoker NG, Karlyshev AV, et al.: Whole
genome comparison of Campylobacter jejuni human isolates
using a low-cost microarray reveals extensive genetic
diversity. Genome Res 2001, 11:1706-1715.
5. Chan K, Baker S, Kim CC, Detweiler CS, Dougan G, Falkow S:
Genomic comparison of Salmonella enterica serovars and Sal-
monella bongori by use of an S. enterica serovar typhimurium
DNA microarray. J Bacteriol 2003, 185:553-563.
6. Bjorkholm B, Lundin A, Sillen A, Guillemin K, Salama N, Rubio C,
Gordon JI, Falk P, Engstrand L: Comparison of genetic diver-
gence and fitness between two subclones of Helicobacter
pylori. Infect Immun 2001, 69:7832-7838.
7. Behr MA, Wilson MA, Gill WP, Salamon H, Schoolnik GK, Rane S,
Small PM: Comparative genomics of BCG vaccines by whole-
genome DNA microarray. Science 1999, 284:1520-1523.
8. Kim CC, Joyce EA, Chan K, Falkow S: Improved analytical meth-
ods for microarray-based genome-composition analysis.
Genome Biol 2002, 3:research0065.1-0065.17.
9. Rodriguez P, Allardet-Servent A, de Barbeyrac B, Ramuz M, Bebear C:
Genetic variability among Chlamydia trachomatis reference
Table 3
Predicted niche-specific genes for each of the three different bio-
logical tropisms
Ocular* Urogenital
†
LGV
‡
CT158 CT161 CT116 (incE)
CT210 (hemL) CT166 CT144
CT216 (xasA) CT622 CT167
CT360 CT672 (fliN)CT223 (inc)
CT398 CT870 (pmpF)CT288
CT470 CT872 (pmpH)CT293 (accD)
CT675 (karG)CT312 (fer)
CT686 CT618
CT688 (parB)CT664
CT690 (dppD)CT696
CT694 CT760 (ftsW)
CT792 (mutS)
CT860
CT874 (pmpI)
*Ocular strains A/Har1, B/TW-5, Ba/Apache-2, C/TW-3;
†
urogenital
strains D/UW-3, E/Bour, F/IC-Cal 3, G/UW-57, H/UW-4, I/UW-12, J/
UW-36, K/UW-31;
‡
LGV strains L1/440, L2/434, L3/404.
Genome Biology 2004, Volume 5, Issue 6, Article R42 Brunelle et al. R42.9
comment reviews reports refereed researchdeposited research interactions information
Genome Biology 2004, 5:R42
and clinical strains analyzed by pulsed-field gel
electrophoresis. J Clin Microbiol 1994, 32:2921-2928.
10. Greub G, Raoult D: History of the ADP/ATP-translocase-
encoding gene, a parasitism gene transferred from a
Chlamydiales ancestor to plants 1 billion years ago. Appl Envi-
ron Microbiol 2003, 69:5530-5535.
11. Stephens RS: Chlamydial evolution: a billion years and
counting. In Chlamydial Infections, Proceedings of the Tenth International
Symposium on Human Chlamydial Infections:16-21 June 2002. Antalya,
Turkey Edited by: Schacter J, Chrstiansen G, Clarke IN, Hammerschlag
MR, Kaltenboek B, Kuo C-C, Rank GL, Ridgeway GL, Saikku P, Stamm
WE. International Chlamydia Symposium; 2002:3-16.
12. Kalman S, Mitchell W, Marathe R, Lammel C, Fan J, Hyman RW, Olin-
ger L, Grimwood J, Davis RW, Stephens RS: Comparative
genomes of Chlamydia pneumoniae and C. trachomatis. Nat
Genet 1999, 21:385-389.
13. Wang SP, Grayston JT: Micro-immunofluorescence antibody
responses to trachoma vaccines. Int Ophthalmol 1988, 12:73-80.
14. Stephens RS: Genomic autobiographies of Chlamydiae. In
Chlamydia: Intracellular Biology, Pathogenesis, and Immunity Edited by:
Stephens RS. Washington, DC: American Society for Microbiology;
1999:6-26.
15. Nigg C: Unidentified virus which produces pneumonia and
systemic infection in mice. Science 1942, 95:49-50.
16. Caldwell HD, Wood H, Crane D, Bailey R, Jones RB, Mabey D,
Maclean I, Mohammed Z, Peeling R, Roshick C, et al.: Polymor-
phisms in Chlamydia trachomatis tryptophan synthase genes
differentiate between genital and ocular isolates. J Clin Invest
2003, 111:1757-1769.
17. Fehlner-Gardiner C, Roshick C, Carlson JH, Hughes S, Belland RJ,
Caldwell HD, McClarty G: Molecular basis defining human
Chlamydia trachomatis tissue tropism. A possible role for
tryptophan synthase. J Biol Chem 2002, 277:26893-26903.
18. Shaw AC, Christiansen G, Roepstorff P, Birkelund S: Genetic differ-
ences in the Chlamydia trachomatis tryptophan synthase
alpha-subunit can explain variations in serovar pathogenesis.
Microbes Infect 2000, 2:581-592.
19. Read TD, Brunham RC, Shen C, Gill SR, Heidelberg JF, White O,
Hickey EK, Peterson J, Utterback T, Berry K, et al.: Genome
sequences of Chlamydia trachomatis MoPn and Chlamydia
pneumoniae AR39. Nucleic Acids Res 2000, 28:1397-1406.
20. Stephens RS, Kalman S, Lammel C, Fan J, Marathe R, Aravind L, Mitch-
ell W, Olinger L, Tatusov RL, Zhao Q, et al.: Genome sequence of
an obligate intracellular pathogen of humans: Chlamydia
trachomatis. Science 1998, 282:754-759.
21. Mamat U, Lobau S, Persson K, Brade H: Nucleotide sequence var-
iations within the lipopolysaccharide biosynthesis gene gseA
(Kdo transferase) among the Chlamydia trachomatis serov-
ars. Microb Pathog 1994, 17:87-97.
22. Yuan Y, Zhang YX, Watkins NG, Caldwell HD: Nucleotide and
deduced amino acid sequences for the four variable domains
of the major outer membrane proteins of the 15 Chlamydia
trachomatis serovars. Infect Immun 1989, 57:1040-1049.
23. Zhang Y, Tao J, Zhou M, Meng Q, Zhang L, Shen L, Klein R, Miller DL:
Elongation factor Ts of Chlamydia trachomatis: structure of
the gene and properties of the protein. Arch Biochem Biophys
1997, 344:43-52.
24. Kubori T, Yamaguchi S, Aizawa S: Assembly of the switch com-
plex onto the MS ring complex of Salmonella typhimurium
does not require any other flagellar proteins. J Bacteriol 1997,
179:813-817.
25. Koehler JE, Burgess RR, Thompson NE, Stephens RS: Chlamydia tra-
chomatis RNA polymerase major sigma subunit. Sequence
and structural comparison of conserved and unique regions
with Escherichia coli sigma 70 and Bacillus subtilis sigma 43. J
Biol Chem 1990, 265:13206-13214.
26. Davis LG, Kuehl WM, Battey JF: In Basic Methods in Molecular Biology
2nd edition. Edited by: Davis LG, Kuehl WM, Battey JF. Norwalk, CT:
Appleton and Lange; 1994:16-21.
27. Nicholson TL, Olinger L, Chong K, Schoolnik G, Stephens RS: Global
stage-specific gene regulation during the developmental
cycle of Chlamydia trachomatis. J Bacteriol 2003, 185:3179-3189.
28. Thompson JD, Gibson TJ, Plewniak F, Jeanmougin F, Higgins DG: The
CLUSTAL_X windows interface: flexible strategies for mul-
tiple sequence alignment aided by quality analysis tools.
Nucleic Acids Res 1997, 25:4876-4882.
29. Kumar S, Tamura K, Jakobsen IB, Nei M: MEGA2: molecular evo-
lutionary genetics analysis software. Bioinformatics 2001,
17:1244-1245.
30. Stothard DR, Boguslawski G, Jones RB: Phylogenetic analysis of
the Chlamydia trachomatis major outer membrane protein
and examination of potential pathogenic determinants. Infect
Immun 1998, 66:3618-3625.