Renewable energy technologies for developing countries phần 2 pdf
Bạn đang xem bản rút gọn của tài liệu. Xem và tải ngay bản đầy đủ của tài liệu tại đây (194.62 KB, 10 trang )
- 7 -
electric demand can be attributed to the actual, as opposed to the
assumed, prices. This is the cost-effective energy conservation, which
represents only a part of the eventual adjustment one can expect in the
gradual replacement of energy-consuming equipment.
Fig. 5&6 clearly indicate increase of energy use and consumption as
per growth of economy from 1970-2000 with projections upto 2020; the
highest energy-consumption projected will be in “Developing Asia” due
to highest growth in economy. The rates of economic development are
amongst the most important determinants of energy-demand in the long
term. The World Energy Consumption (WEC) study predicts an increase
in global energy-need in the range of 1.5 to 3 times by 2050 and 2 to 5
times by 2100. Taken together, energy requirements are envisaged to
increase at lower rates than economic growth. This means that energy-
intensity is presumed to decline across all scenarios; by 2100, it will fall
between 80 and 20 per cent of the 1990 levels. This translates into annual
declines of about 0.8% and more than 1.5%, with a median of about 1
percent. Thus, the lowest future energy-intensity improvements of 0.8% a
year are in line with the historical experience of industrialized countries.
To sum up, technology is the key indicator of economic development
and is essential for raising the standard of living, but it also should be
environment friendly. Technology development and its application needs
RD&E, which in turn, needs investments. The energy infra-structure grow
consistent by part of it will be shared by renewables, specially new emerging
RETs, such as Hydrogen and Fuel Cell technology. Improvement in
technology will gradually shift us from the fossil fuels to renewable
energies, around 10% to 15% by 2020 and, hopefully 30% by the year 2050.
Global Energy-Economy :
- 50% energy is consumed by 16% population
- 1.6 billion people have no access to commercial energy
- 55% increase in global energy-demand between 2000 and 2020
- Share of Developing Countries: 2000 (35%), 2020 (50%), 2100 (70%)
- 8 -
Figure 6 : Total World Energy-Consumption in
three cases, 1970-2020
Source : History: Energy Information Administration (EIA), Office of
Energy Markets and End Use, international Statistics Database and
International Energy Annual 1999, DOE/EIA-0219(99) (Washington, DC,
January 2001). Projections : EIA, World Energy Projection System (2001)
Figure 5 : World Energy-Consumption by Types of Natural
Resources 1970-2020
5. “World Energy Projection System”, 2001 E.I.A. Report (Figure 5).
6. “World Energy Projection System”, 2001 E.I.A. Report (Figure 6).
Source : History : Energy
Information Administration
(EIA), Office of Energy Markets
and End Use, international
Statistics Database and
International Energy Annual
1999, DOE/EIA-0219(99)
(Washington, DC, January
2001). Projections : EIA, World
Energy Projection System (2001)
- 9 -
CHAPTER 2
THE CASE FOR RENEWABLE
SOURCES OF ENERGY
1. Some basic considerations
The development and utilization of new and renewable sources of
energy must be viewed in the context of the present and future
energy-transition. New and renewable sources of energy can make a
significant contribution, but their role and potential in the short term
should not be overstated. It has been estimated that new and renewable
sources of energy at present meet only 5-10 per cent of global
energy-requirements, which may hopefully go up to 30% by the year
2050 A.D
1
. So, in the foreseeable future, hydrocarbon-supplies will
continue to play a very important role in meeting the global
energy-demand, although over a long period of time, that role will
decline to facilitate the energy-transition, a process should now be set in
motion to ensure the most efficient identification, exploration,
assessment, development and utilization of various energy sources,
including new and renewable sources of energy, which must be
considered as dynamic variables that will tend to increase with the
development, refinement, and popularization of technologies.
One may here consider the “struggle for existence” of the various
energy-forms, as seen by Cesare Marchetti
2
of I.I.A.S.A., see Figure 7, as
1. M.M.Qurashi, A.H. Chotani et al, “Renewable Sources of Energy in Pakistan”, Pak.
Acad. Sci. 1986, pp. 60-61.
2. Cesare Marchetti; of I.I.A.F.A., Austria, quoted in “Islamic Science revisited : some
vestiges of hope” by Erkka J. Maula, in International Converence on Science in
Islamic Polity : Paper presented on S&T potential and its Development in Muslim
World Vol. II, pp. 268-279. 1993.
- 10 -
a schematic indication of global trends in the various energy-technologies
over the span 1850 up to 2100 A.D. This shows quite distinctly that in the
recent past, the useful span of any one form of fossil energy has been of
the order of 250 years, with an outstanding popularity over 50 years or
so, the latest so far being gas (followed perhaps by nuclear energy).
A similar pattern is seen emerging for nuclear energy (with likely
peaking around 2090 A.D) and appears likely for the newer (renewable)
energy technologies (peaking after 2100 A.D), shown by the double line
in the right-hand part of Figure. 7. Thus, there has to be more or less
continuous effort for development of new renewable forms of energy.
The development of new and renewable sources of energy opens up
the prospect of increasing indigenous energy-supply and thereby
contributing to greater self-sufficiency. The development of new and
renewable sources of energy also creates new options to respond to the
energy requirements of the rural, industrial, transport, domestic and other
sectors, in accordance with national goals, priorities, and provides for a
more diversified and decentralized pattern of energy-supply. Like any
energy source or product, new and renewable sources of energy are
themselves both an “input” and an “output” of the development process.
Figure - 7 : Showing the schematic representation by C.
Marchetti of the rise and fall of the market shares of varius
energy-forms over the period from 1850 to 2100 A.D.
(Date of prediction : October 1982)
- 11 -
The role of new and renewable sources of energy should therefore be
perceived as a dynamic interaction between resources, technologies and
present and future requirements for energy, all serving national objectives
for economic and social development.
2. Agreement at World Summit on Sustainable
Development, Johannesburg, 2002 :
Diversify energy-supply by development of advanced, cleaner, more
efficient, affordable and cost-effective energy technologies, including
fossil fuel technologies and renewable energy technologies, hydro
included, and their transfer to developing countries on concessional terms
as mutually agreed.
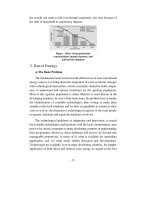
3. The environmental concerns and energy
The Present Situation : The conventional energy-generation options
can damage air, water, climate, land and wild life, through particulate and
gaseous emissions, as well as through raising levels of harmful radiations.
Renewable Energy Technologies (RETs) are much safer. This is the current
driving force in development and deployment of RETs.
The impact of energy-systems, through particulate matters, gases and
radiation, occurs all around, from household level to global scale. This
includes harvesting, combustion (fossil fuels as well as renewables), health
effects, green-house gases, biomass, coal, oil and gases, hydropower and
other renewables. Nuclear dangers contribute to various types of
environmental concerns for human society at a local, national, regional as
well as global level. The emissions caused by humans can be categorised
into two type : (i) energy-related activities : including combustion,
extraction, processing and distribution of fossil fuels and biofuels and (ii)
due to non-energy activities, burning agruculture-waste industrial process,
deforestation and uncontrolled waste burning. This does not include
volcanic activity, which contribute 76% Nitrogen Oxide. Energy related
activities pollute with 56% non-methane organic compounds, 46% CO
- 12 -
and 34% Methane. The Global distribution of particulate matter in the air
in urban areas is shown in Figure 8, which has been taken from the 2000
UNDP World Energy Assessment Report
3(a)
. Further,
- Sulphur and Nitrogen Oxides play a role in the formation of
acid-deposition, because they can be changed to acid in the atmosphere
and can cause acid-rains. These being a major precursor to the formation
of regional tropospheric ozone can cause climate-change. Carbon
Dioxide gas also acts as an indirect greenhouse, with potential of global
warming. In addition, Carbon Monoxide is toxic to human and is a
critical component of many photochemical reactions in the atmosphere
and it also reduces the ozone production.
- Non-methane volatile organic compounds consist of a variety of
chemical species and are very important in the chemistry of atmosphere,
due to the fact that these can destroy ozone.
- Ammonia can help to neutralize acid in the atmosphere; but when
it falls on the land, it can be converted into acids. Ammonia largely
comes out of animal waste, fertilizer and combustion. Most
ammonia-emissions are recorded from Asia and other developing
countries, due to the rural nature of these countries.
- The latest energy-projections indicate that global Sulphur dioxide
is likely to stay constant roughly between 1990 and 2020, at about 59
teragrams of Sulphur. This problem has been shifted to the developing
world, with emission in Latin America, Africa and Middle-east expected
to increase 30% between 1990 and 2020. The problem is in Asia, where it
is already as high as 17 teragram (1990-2020). China is the largest
contributor to Asian Sulphur-dioxide emissions, emitting about half of
the Asian continent, because of the extensively used coal-fired power
3. “World Energy Assessment: Energy and the challenges of Sustainability” 2000
UNDP Report.
a) “John P. Holdren (U.S) and Kirk R. Smith (U.S)”, Energy, the Environment, and
Health “World Energy Assessment: Energy and the challenges of Sustainability”
2000 UNDP Report, p. 75, p. 92, p. 93, p. 95, p. 96.
- 13 -
Note : In many cases, PM10 levels have been entirely estimated from measurements of total particles.
Source : WRI, 1998; WHO, 1998b
Figure 8 : Global Distribution of Urban PM
10
Concentration
- 14 -
plants, which can easily be replaced with natural gas in order to control
the emission.
- Ozone is an important air pollutant that can cause damage to crops,
trees and human health. It is a major component of the harmful smog that
forms around suspended particles during periods of high temperature,
intense solar radiation, low wind-speed and in the absence of
precipitation. High concentrations are common in mega cities of
Southern Asia, viz Bangkok, Hong Kong, Mumbai and Shanghai.
Two most important human-caused problems associated with
environmental pollution at the global scale, are :
(i) Emission of Greenhouse gases and
(ii) Depletion of Ozone
The most important greenhouse gases naturally present in the
Earth’s atmosphere are water vapour, carbon dioxide, Methane and
Nitrous Oxide, although water vapors cause large part of the greenhouse
effect. Energy-systems generate two-third of the human-caused
greenhouse gases, which are linked to potential climate change. It can
have direct impact on human health and the Earth’s ecosystem.
Projection for the future : Some projections for Industrial Carbon
Dioxide emissions are shown in Figure 9. In 1995, developing countries
were contributing 27% of emission, whereas they will share equally
(50%) with the industrialized countries in 2035. However, per-capita
emission from developing countries will remain smaller than that from
industrialized countries. W.H.O estimates that air pollution causes 2.7-3
million pre-mature deaths a year i.e 5-6% of global mortality.
In order to keep the levels of emission below those in future,
significant improvement in energy-system are required globally, and one
of the simplest solutions to the problem is to enhance the use of RETs
with lowest emission. Table 2.1 is a summary of some I.P.C.C. Scenarios
for stabilizing levels of Carbon dioxide levels over the 300 years from
2075 to 2375 A.D.
- 15 -
An illustration of the environmental risk-transition between scales is
seen in the figure 10(a), which plots the relationship between urban PM
10
(particulates smaller than 10 microns in diameter) concentrations and
country development status as indicated by their UNDP Human
Development Index (a function of income, literacy, and life expectancy).
Superficially, urban PM
10
concentration seems to follow the so-called
Figure 9 : Source of Industrial Carbon Dioxide Emissions, 1995
and 2035
To stabilize concentrations at
(parts per million by volume)
By about the year
Cumulative emissions in 1990-
2100 would need to be in the
range of (billions of tones of
carbon)
Average emission in 1990- 2100
would be in the range of (billions
of tones of carbon per year)
And peak emissions (billions
of tones of carbon per year)
In the year
450
2075
550-750
5.7-5.9
9.5
2012
550
2125
750-1,100
7.9-9.0
11
2030
650
2175
970-1,270
10.2-10.8
12.5
2050
750
2200
1,090-1,430
10.0-11.8
13.5
2060
1,000
2375
1,220-1,610
12.7
15
2075
Table 2.1: IPCC Scenarios for Stabilizing Carbon Dioxide Levels, 2075-2375
- 16 -
Kuznets environmental curve – that is, they first rise during development,
reach a peak, then decline. (The curve (see figure 10(a)) is named after
the Nobel Prize-winning economist Simon Kuznets, who noted in the
1960s that many countries go through a period of increasing income
inequality during development before becoming more equitable). From
the standpoint of the risk-transition, however, this curve only addresses
the community scale in the form of ambient urban air- pollution. It
ignores what happens at other scales, which may be more important.
The main concern about particulates is their impact on human
health. From a health standpoint, it is not so much urban concentrations
that are critical but human exposure, which is a function of not only
where the pollution is but also where the people are. Because people
spend a lot of time indoors and in other places close to local sources of
pollution-exposure patterns can be quite different from patterns of
ambient pollution. Thus, as shown in the figure-10(b) the household
sources dominate exposure in the poorest countries, therefore the pattern
of exposures is quite different than that of urban ambient concentrations.
Instead of rising and then falling, exposures decline continuously –
illustrating that the Kuznets curve misses the actual trend, meaning that
Source : McGranaban and others, 2000;
Smith and Akbar, 1999
Figure 10(a) : Environmental Risk
Transition