Báo cáo y học: "Synovial fluid level of aggrecan ARGS fragments is a more sensitive marker of joint disease than glycosaminoglycan or aggrecan levels: a cross-sectional study" pps
Bạn đang xem bản rút gọn của tài liệu. Xem và tải ngay bản đầy đủ của tài liệu tại đây (673.51 KB, 11 trang )
Available online />
Research article
Open Access
Vol 11 No 3
Synovial fluid level of aggrecan ARGS fragments is a more
sensitive marker of joint disease than glycosaminoglycan or
aggrecan levels: a cross-sectional study
Staffan Larsson, L Stefan Lohmander and André Struglics
Department of Orthopaedics, Clinical Sciences Lund, Lund University, SE-221 85 Lund, Sweden
Corresponding author: Staffan Larsson,
Received: 8 Feb 2009 Revisions requested: 16 Mar 2009 Revisions received: 19 May 2009 Accepted: 22 Jun 2009 Published: 22 Jun 2009
Arthritis Research & Therapy 2009, 11:R92 (doi:10.1186/ar2735)
This article is online at: />© 2009 Larsson et al.; licensee BioMed Central Ltd.
This is an open access article distributed under the terms of the Creative Commons Attribution License ( />which permits unrestricted use, distribution, and reproduction in any medium, provided the original work is properly cited.
Abstract
Introduction Aggrecanase cleavage at the 392Glu-393Ala bond
in the interglobular domain (IGD) of aggrecan, releasing Nterminal 393ARGS fragments, is an early key event in arthritis and
joint injuries. Here, we use a quantitative immunoassay of
aggrecan ARGS neoepitope fragments in human synovial fluid
to determine if this cleavage-site specific method better
identifies joint pathology than previously available less specific
aggrecan assays.
Methods Synovial fluid (SF) from 26 people with healthy knees
(reference) and 269 patients were analyzed in a cross-sectional
study. Patient groups were acute inflammatory arthritis, acute
knee injury, chronic knee injury and knee osteoarthritis (OA).
Aggrecan ARGS fragments were assayed by ELISA using the
monoclonal antibody OA-1. Total aggrecan content was
analyzed by an ELISA using the monoclonal antibody 1-F21, and
sulfated glycosaminoglycan by Alcian blue precipitation.
Results Aggrecan ARGS fragment concentrations in all groups
differed from the reference group (P < 0.001). The acute
inflammatory arthritis group had the highest median level, 177fold greater than that of the reference group. Median levels (in
Introduction
Proteolysis of aggrecan is an early and critical feature of cartilage degradation in arthritis and after knee injury, and is measurable as an elevation of aggrecan release from the cartilage
into the synovial fluid (SF) [1-4]. Although proteases, such as
matrix metalloproteases (MMPs), cathepsins and calpains, are
pmol ARGS/ml SF) were: reference 0.5, acute inflammatory
arthritis 88.5, acute knee injury 53.9, chronic knee injury 0.5 and
OA 4.6. In contrast, aggrecan and sulfated glycosaminoglycan
concentrations varied much less between groups, and only
acute inflammatory arthritis and acute knee injury were found to
have a two-fold increase in median levels compared to the
reference.
Conclusions Levels of aggrecan ARGS fragments in human
synovial fluid are increased in human arthritis, OA and after knee
injury, likely reflecting an enhanced cleavage at the 392Glu393Ala bond in the IGD by aggrecanase. An assay that
specifically quantified these fragments better distinguished
samples from joints with pathology than assays monitoring
aggrecan or glycosaminoglycan concentrations. The newly
developed ARGS fragment assay can be used to monitor
aggrecanase activity in human joint disease and experimental
models.
involved [5], aggrecanase plays a major role in aggrecan degradation in murine [6,7] and human [4,8-15] joint disease.
There are five known aggrecanase cleavage sites in aggrecan
[16]. The most severe aggrecanase cleavage in terms of
destructive loss of sulfated glycosaminoglycan (sGAG) from
the tissue, is at the 392Glu-393Ala bond in the interglobular
AA: acute inflammatory arthritis; ACL: anterior cruciate ligament; ADAMTS: a disintegrin and metalloproteinase with thrombospondin motifs; AEBSF:
4-(2-aminoethyl)-benzenesulfonyl fluoride; AI: acute knee injury; BSA: bovine serum albumin; CI: chronic knee injury; CV: coefficient of variation;
EACA: 6-aminohexonic acid; EDTA: ethylenediaminetetra acetic acid; ELISA: enzyme-linked immunosorbent assay; H2O2: hydrogen peroxidase; IGD:
interglobular domain; KS: keratan sulfate; mAb: monoclonal antibody; MEN: meniscal injury; MES: 2-(N-morpholino) ethanesulfonic acid; MMP: matrix
metalloproteases; NEM: N-ethylmaleimide; OA: osteoarthritis; PBST: phosphate buffered saline with TWEEN; PMSF: phenylmethylsulfonyl fluoride;
PVDF: polyvinylidene difluoride; REF: healthy knee reference; SF: synovial fluid; sGAG: sulfated glycosaminoglycan; TMB: tetramethylbenzidine.
Page 1 of 11
(page number not for citation purposes)
Arthritis Research & Therapy
Vol 11 No 3
Larsson et al.
(IGD) domain of aggrecan, releasing N-terminal
neoepitope fragments.
393ARGS
ARGS neoepitope aggrecan fragments released into the SF,
as detected by western blot or amino acid sequencing, have
been associated with joint diseases [4,8,9,17,18] and have
also been detected as a result of normal turnover [4,17].
When quantified by a western blot method, the proportion of
aggrecan in SF having the neoepitope ARGS was elevated in
arthritis and joint injury compared with individuals with healthy
knees [4]. Fragments carrying the same neoepitope were also
found in serum from patients with rheumatoid arthritis, but not
in healthy controls [15].
Results from several ELISAs have been presented that measure levels of aggrecan neoepitopes in medium from human
cartilage explants [10,11,13,19]. By measuring neoepitope
concentrations, aggrecanase cleavage at the 392Glu-393Ala
bond has been confirmed as a major contributor to aggrecan
loss from cartilage stimulated by cytokines [10,11,13-15].
However, with the exception of small-scale quantitative western blots [4], only assays of non-specific aggrecan fragments
[1,20], of newly synthesized aggrecan bearing the 846
epitope [21] or of sGAG [22] have been reported in studies of
human SF.
In this cross-sectional study, comparing people with healthy
knees with those with acute inflammatory arthritis, acute knee
injury, chronic knee injury, or knee osteoarthritis (OA), we
quantified the SF levels of the aggrecan ARGS neoepitope
with a modified sandwich ELISA [19], and compared it with
aggrecan assays not specific for this neoepitope. We hypothesized that ARGS neoepitope concentrations in SF would differ between these groups and be a more sensitive measure of
joint disease than previously used aggrecan or sGAG assays.
Materials and methods
Amino acid numbering
All amino acid numbering of aggrecan is herein based on fulllength human aggrecan, accession number [SwissProt:P16112], starting with the N-terminal 1MTTL-amino acid
sequence.
Materials
Alcian blue 8GS (C.I. 742240) was from Chroma-Gesellschaft (Köningen, Germany). 4-(2-aminoethyl)-benzenesulfonyl
fluoride (AEBSF), 6-aminohexonic acid (EACA), benzamidineHCl, BSA, chondroitin sulfate type C from shark cartilage (no.
C4384), ethylenediaminetetra acetic acid (EDTA), N-ethylmaleimide (NEM), 2-(N-morpholino) ethanesulfonic acid
(MES), phenylmethylsulfonyl fluoride (PMSF), and phosphate
buffered saline with TWEEN (PBST) buffer (0.01 M sodium
phosphate, 0.138 M sodium chloride, 0.0027 M potassium
chloride, 0.05% TWEEN 20; pH 7.4) were from Sigma (St.
Louis, MO, USA). Cesium chloride and guanidinium hydro-
Page 2 of 11
(page number not for citation purposes)
chloride were from Merck (Darmstadt, Germany). Molecular
weight markers 10 to 250 kDa (no. 161-0373) were from BioRad (Hercules, CA, USA). Human recombinant ADAMTS-4 (a
disintegrin and metalloproteinase with thrombospondin motifs,
aggrecanase-1) was from GlaxoSmithKline (Collegeville, PA,
USA) [23]. ECL Plus detection was from Amersham Biosciences (Buckinghamshire, UK). Polyvinylidene difluoride
(PVDF) membranes, Tris-acetate mini gels (3 to 8%), LDS
sample buffer, Tris-acetate SDS running buffer and transfer
buffer were from Invitrogen (Carlsbad, CA, USA). Non-fat dry
milk by Semper (Sundbyberg, Sweden) was from the local
supermarket.
Quick-Seal centrifuge tubes (2 ml no. 344625, 12.5 ml no.
342413), tube sealer (no. 342428), tube slicer (no. 303811)
were from Beckman Coulter (Palo Alto, CA, USA). The monoclonal antibody (MAb) OA-1, with or without biotinylation, recognizing the neoepitope sequence ARGSVIL (representing
the N-terminus of human aggrecan cleaved between 392Glu
and 393Ala in the interglobular domain) was kindly provided by
Michael Pratta (GlaxoSmithKline, Collegeville, PA, USA) [19].
Tetramethylbenzidine (TMB)-hydrogen peroxidase (H2O2)
solution (no. 50-76-00) and peroxidase labeled streptavidin
(no. 14-30-00) were from KPL (Gaithersburg, MD, USA).
Hyaluronidase from Streptomyces hyalurolyticus (EC 4.2.2.1),
chondroitinase ABC protease free (EC 4.2.2.4), keratanase
(EC 3.2.1.103) and keratanase II (from Bacilus species Ks 36)
were from Seikagaku (Tokyo, Japan). Keratan sulfate (KS) capture 96-well plates (no. 42.146.08) were from Biosource International (Camiro, CA, USA).
Subjects and samples
Knee SF from 26 knee healthy volunteers and 269 patients
were obtained from a cross-sectional convenience cohort,
where each individual, after informed consent, provided a sample at one time point only. Diagnosis was made by arthroscopy, radiography, assessment of SF and clinical examination
[1]. Samples were centrifuged at 3000 g and aliquots of the
supernatant were stored at -80°C. All patient-related procedures were approved by the ethics review committee of the
Medical Faculty of Lund University.
Diagnostic groups were healthy knee references (REF), acute
inflammatory knee arthritis (AA), knee OA, and injured knee
(anterior cruciate ligament rupture and/or meniscus tear)
grouped as acute knee injury (AI; 0 to 12 weeks after injury) or
chronic knee injury (CI; > 12 weeks after injury; Table 1). Joint
changes, assessed by arthroscopy and radiography, were
scored ranging from 1 to 10, where 1 represents a normal joint
by arthroscopy and radiography; 2 to 5 represents an increasing extent and severity of fibrillation and clefts in the joint cartilage by arthroscopy in joints appearing normal on
radiographs; and 6 to 10 represents increasing degrees of
radiographic joint space narrowing consistent with OA [24].
Available online />
Table 1
Characteristics of the study patients and reference group
OA score
Study group
Subject number
Male, %
Age, years
Time of sampling, weeks after injury or onset
no.
REF
26
62
27 (17 to 89)
-
1 (1 to 1)
16
AA
48
60
66 (30 to 92)
0.4 (0 to 510)
7 (3 to 9)
31
AI
69
81
27 (16 to 59)
1.4 (0 to 11.9)
1 (1 to 5)
67
CI
123
77
40 (16 to 70)
61 (12.7 to 1926)
2 (1 to 8)
121
OA
29
66
61 (25 to 92)
125 (0 to 772)
7 (2 to 9)
29
Age, time of sampling and OA score in median values (range).
REF = healthy knee reference; AA = acute inflammatory arthritis (46 acute pyrophosphate arthritis/pseudogout, one rheumatoid arthritis and one
acute reactive arthritis/Yersinia); AI = acute knee injury (47 anterior cruciate ligament ruptures and one posterior, with or without meniscus tear
and meniscus tear alone, 0 to 12 weeks after injury); CI = chronic knee injury (120 anterior cruciate ligament ruptures and three posterior, with or
without meniscus tear and meniscus tear alone, > 12 weeks after injury); OA = knee osteoarthritis. The OA score ranges from 1 to 10 where 1
represents a normal joint; see Materials and Methods for a detailed description.
Thirty-one samples lacked arthroscopic and/or radiographic
data needed for assessment of OA score.
To study injury-dependent aggrecan fragment release at different times after injury, these samples were grouped as meniscal
injury alone (MEN) or cruciate ligament rupture with or without
an associated meniscus injury (ACL), stratified by time after
injury (0 to 4, 4 to 12, 12 to 26, 26 to 52, or > 52 weeks).
Patient samples were selected from a biobank by one of the
authors (LSL) on the basis of clinical diagnosis, without reference to any previously available assay data.
Cartilage aggrecan digest as ARGS standard
From the pool of human knee OA cartilage (10 patients) proteoglycans were extracted with guanidinium hydrochloride (4
M) in the presence of proteinase inhibitors (10 mM EDTA, 100
mM EACA, 10 mM NEM, 5 mM benzamidine-HCl and 5 mM
PMSF) and aggrecan was then isolated by associative-dissociative cesium chloride density gradient centrifugation in the
presence of the proteinase inhibitors [25]. Fraction A1D1 was
collected and dialyzed against Millipore-water prior to freeze
drying [18]. As described, this fraction contains only large
aggrecan fragments, containing the IGD, without G1-IPEN
and G1-TEGE fragments [18]. Human aggrecan monomers
were quantified based on dry weight assuming a molecular
weight of 1.5 × 10⁶ g/mol.
Full-length human recombinant ADAMTS-4 was cloned,
expressed, and purified at GlaxoSmithKline (Collegeville, PA,
USA) [23]. ADAMTS-4 (3.1 nM) was incubated with the A1D1
fraction of human aggrecan (346 nM) for 30 hours at 37°C in
50 mM Tris-HCl, 100 mM sodium chloride (NaCl), 10 mM calcium chloride (CaCl2), pH 7.5, achieving complete conversion
of the G1-containing starting material to G1-TEGE fragments
and the corresponding ARGS fragments. The digest was
quenched with 25 mM EDTA and monitored for complete
digestion by G1, TEGE, and ARGS western blots (data not
shown). The digest was used as an ARGS standard in the
aggrecan ARGS ELISA.
Aggrecan ARGS ELISA
Quantification in SF of aggrecan fragments with the N-terminal
393ARGS was by a sandwich ELISA using an anti-KS antibody
as capture and the monoclonal neoepitope antibody OA-1 for
detection of specific fragments [19]. After modification for use
in SF, the assay was conducted as follows:
Sample treatment
ARGS standard (ADAMTS-4 digested cartilage A1D1 aggrecan) was treated with chondroitinase ABC as described [18].
SF samples were digested with hyaluronidase (0.01 turbidity
reducing unit/μl SF for three hours at 60°C in 50 mM sodium
acetate, 10 mM EDTA, 0.25 mM AEBSF, pH 6), treated with
chondroitinase ABC (0.8 mU/μl SF for 30 minutes at 37°C in
50 mM Tris-acetate, 75 mM sodium acetate, 15 mM EDTA,
0.125 mM AEBSF, pH 7.6), boiled in a water bath for five minutes, and spun (12,500 g, five minutes) collecting the supernatant.
ELISA
Duplicates of 300 μl of ARGS standards (ADAMTS-4
digested cartilage A1D1 aggrecan; 0.02 to 1 nM ARGS) or
supernatant of boiled and spun SF samples (final SF dilution
1:50 to 1:6400) were incubated in the presence of 1% w/v
BSA, 20 mM MES, 150 mM NaCl, pH 5.3 on KS capture
plates coated with an anti-KS antibody (Biosource International, Camiro, CA, USA) over night at 4°C on a plate shaker.
Following washes (6 × 400 μl PBST), plates were incubated
with biotinylated MAb OA-1 (150 μl/well, 1.5 μg/ml in PBST
with 0.1% w/v non-fat dry milk) for two hours at 37°C on a
plate shaker. Plates were washed (as above) and incubated
Page 3 of 11
(page number not for citation purposes)
Arthritis Research & Therapy
Vol 11 No 3
Larsson et al.
with horseradish peroxidase-conjugated streptavidin (150 μl/
well, 1 μg/ml in PBST) for one hour at room temperature on a
plate shaker. Following a wash, a five-minute incubation of
TMB-H2O2 solution (150 μl/well) and acidification with 1 M
phosphoric acid (150 μl/well), absorbance at 450 nm was
measured spectrophotometrically using a Multiscan Multisoft
plate reader (Labsystems, Helsinki, Finland) and the software
Ascent 2.4.2 (Thermo Electron, Waltham, WA, USA).
Spiking
SF from individuals with ARGS concentrations suited for analysis diluted at 1:50, 1:400, 1:800, and 1:1600 were spiked
with equimolar concentrations of ARGS standard (ADAMTS4-digested cartilage A1D1 aggrecan) and analyzed in the
ARGS ELISA.
ARGS neoepitope assays were performed with no knowledge
of clinical diagnosis or previous assay data.
Aggrecan and sGAG quantification in synovial fluid
Aggrecan content was analyzed by a slightly modified competition ELISA using the mAb 1-F21 recognizing a protein
sequence within or close to the KS domain [20,26]. The 1-F21
ELISA differed from the original [20] as follows: concentration
of chondroitinase-digested A1D1 was 1.25 μg/ml when coating; all washes were 3 × 200 μl; plates were blocked after
coating (1% BSA, 200 μl/well, 30 minutes at room temperature); the primary antibody 1-F21 was diluted to 1:10,000; the
secondary antibody (Dakopat nr. P447) was diluted to
1:2000.
Concentration of sGAG was measured by Alcian blue precipitation modified from Björnsson [22]. Samples and chondroitin
sulfate standards (25 μl) were precipitated for two hours at
4°C with 0.04% w/v Alcian blue, 0.72 M guanidinium hydrochloride, 0.25% w/v Triton X-100, and 0.1% v/v H2SO4 (0.45
ml). The precipitates were collected after centrifugation
(16,000 g, 15 minutes, 4°C), then dissolved in 4 M guanidinium hydrochloride, 33% v/v 1-propanol (0.25 ml), and transferred to 96-well micro-titer plates prior to absorbance
measurement at 600 nm.
These data were available from previous studies using these
samples [26-28].
For molar comparison of ARGS fragments and aggrecan, conversion from microgram sGAG/ml to pmol aggrecan/ml was
made assuming an average aggrecan molecular weight of 1.5
× 106 g/mol and assuming that 75% of this weight was sGAG
[4].
Western blot
Aggrecan fragments captured in the ARGS ELISA by the antiKS antibodies were analyzed by western blot. Following a
completed ARGS ELISA, plates were washed with PBST and
Page 4 of 11
(page number not for citation purposes)
incubated with 4 M guanidinium hydrochloride (150 μl/well)
for 30 minutes at room temperature on a plate shaker. To
obtain enough material for western blot analysis, the well contents of standard wells (74 wells) and wells of SF from 152
patients (152 wells) were pooled separately and dialyzed in
10,000 kDa cut-off dialysis cassettes (Slide-A-Lyzer, Pierce,
Rockford, IL, USA) against Millipore water containing protease
inhibitors [18]. Samples were freeze dried, dissolved in deglycosylation buffer and digested by chondroitinase, keratanase
and keratanase II [18]. Samples were precipitated in ice-cold
acetone, and pellets were dissolved in two times concentrated
sample buffer.
ADAMTS-4 digested aggrecan (used in the ELISA as standard) and a D1 fraction of pooled SF from 40 OA patients were
chondroitinase, keratanase and keratanase II digested [18].
All samples were run on a 3 to 8% Tris-acetate SDS-PAGE
gel, transferred to a PVDF membrane and ARGS fragments
were visualized using the MAb OA-1 [18].
Western blot quantification
Quantification of ARGS fragment in SF by western blot was
performed as described [4] using the same mAb for detection
(OA-1) and the same standard as in the ARGS ELISA.
Statistical analysis
For some patients the available volume of SF was not large
enough to perform all assays, which explains the variation in
numbers between assays. Of the 295 subjects, 113 had
ARGS fragment values below the level of detection (i.e. < 1
pmol ARGS/ml SF). Each was assigned a value of 0.5 pmol
ARGS/ml, or half the lower limit of detection. To assess differences among the study groups, either a two-tailed Mann-Whitney U rank sum test with Bonferroni correction was used after
Kruskal-Wallis testing, or a Chi-squared test, as appropriate.
For correlation analysis Spearman's rank order correlation (rS)
was used. P values below 0.05 were considered significant
unless otherwise noted. Statistical calculations were performed using Statistical Package for the Social Sciences
(SPSS, Chicago, IL, USA) for Windows version 15.0.
Results
Technical performance of the ARGS ELISA
SF samples needed to be diluted 1:50 or more for a linear
recovery at different dilutions; at dilutions below 1:50 the signal was reduced due to unknown matrix effects (results not
shown). With a linear measuring range for the standards of
0.02 to 1 pmol ARGS/ml, and a minimal dilution of SF of 1:50,
the lower limit of detection was then recalculated to undiluted
SF 1 pmol ARGS/ml SF. Intra assay coefficient of variation
(CV) was 6% (n = 10), the inter assay CV for the two groups
of KS capture plates used were 12% (n = 5) and 16% (n =
23), respectively, and the total inter assay CV for the control
SF sample included on all plates was 20% (n = 28; Table 2).
Available online />
Table 2
Technical performance of the KS capture OA-1 ARGS ELISA
Linear measuring range of standard
0.02 to 1 pmol/ml
Minimal dilution of SF
1:50
Minimal detectable concentration in neat SF
1 pmol/ml SF
Intra assay CV (n = 10)
6.1%
*Inter assay, intra lot CV (n = 5, 1st lot)
12.2%
*Inter assay, intra lot CV (n = 23, 2nd lot)
15.6%
Inter assay, inter lot CV (n = 28)
19.7%
Dilution of SF
Spiking recovery (mean; range)
1:50
1:400
1:800
1:1600
116%;
109 to 121%
93%;
75 to 104%
81%;
75 to 88%
104%;
98 to 113%
* Between assay variation in lot numbers (1st, #5L21/1; 2nd, #7F25/1) of the KS capture plates from Biosource.
CV = coefficient of variation; KS = keratan sulfate; SF = synovial fluid.
The mean spiking recovery at dilutions 1:50 to 1:1600 was
99% (range 75 to 121%; Table 2).
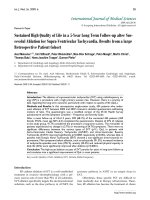
Anti-ARGS western blot analysis of aggrecan fragments captured by the ELISA plates, showed that the ARGS fragments
present in the standard were also captured by the anti-KS
plates (Figure 1). The SF ARGS fragments captured by the
plates showed the same fragment pattern as those detected
in an SF D1 control sample and in the two standard samples.
Figure 1
Anti-ARGS western blot of ELISA-captured material Aggrecan fragmaterial.
ments captured by the anti-keratan sulfate (KS)-coated plates were
extracted after a completed ELISA and analyzed by western blot. Seventy-four wells of captured ARGS standards (STD) and 152 wells of
SF from 152 patients were used. The samples were chondroitinase,
keratanase, and keratanase II digested, separated on a SDS-PAGE gel,
transferred to a polyvinylidene difluoride (PVDF) membrane and probed
with the ARGS antibody OA-1. For comparison, the STD (0.5 μg sulfated glycosaminoglycan (sGAG)/well) and an SF D1 sample pooled
from 40 osteoarthritis (OA) patients (0.75 μg sGAG/well) were used
as controls. The size (kDa) and position of the molecular weight markers are indicated.
Aggrecan, sGAG, and ARGS fragment concentrations in
synovial fluid
The concentrations of aggrecan measured as 1-F21 reactivity,
sGAG, and aggrecan fragments bearing the ARGS
neoepitope are summarized in Table 3. As shown [26], there
was a strong correlation between aggrecan fragment concentration measured by the 1-F21 ELISA and the concentration of
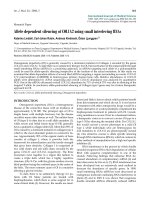
sGAG (rS = 0.82, data not shown). The ARGS concentration
showed a more moderate correlation with the concentrations
of sGAG (rS = 0.69; Figure 2a) and aggrecan (rS = 0.66; Figure 2b).
To validate the identity of the fragments responsible for the
signal below the detection limit of the ARGS ELISA, 32 samples, of which 10 were below ELISA detection, were analyzed
by western blot quantification [4], using the same mAb for
detection, and compared with aggrecan fragment content as
measured by sGAG. The molar proportion of aggrecan fragments bearing the ARGS neoepitope (i.e. ARGS/aggrecan)
as measured by western blot was calculated. In the 10 samples below the detection limit of the ELISA, the median proportion of ARGS-bearing fragments out of aggrecan was 1.8%
(range 1.2 to 6.4%) and in the samples above the detection
limit, the median proportion was 23.8% (2.6 to 59.2%). Conversion from μg sGAG/ml to pmol aggrecan/ml is described in
Material and Methods.
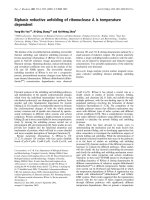
Aggrecan ARGS fragments in diagnostic groups
Concentrations of aggrecan fragments carrying the
neoepitope ARGS were elevated in all groups compared with
the healthy knee reference group (Figure 3a). The median levels (in pmol ARGS/ml SF) were: REF 0.5 (range 0.5 to 3.3),
AA 88.5 (0.5 to 961), AI 53.9 (0.5 to 946), CI 0.5 (0.5 to 266),
and OA 4.6 (0.5 to 318). Similarly, all patient groups differed
from the reference (P < 0.001) regarding the proportion of
samples in each diagnostic group with ARGS concentration
above the lower limit of detection (1 pmol ARGS/ml) as tested
Page 5 of 11
(page number not for citation purposes)
Arthritis Research & Therapy
Vol 11 No 3
Larsson et al.
sGAG and aggrecan in diagnostic groups
Median concentrations of sGAG were elevated only in the AA
(P = 0.004) and AI groups (P < 0.001) compared with the
REF group (Figure 3b). Similarly, concentrations of aggrecan
measured by the 1-F21 ELISA were different from REF only in
AA (P = 0.002) and AI (P = 0.026; Figure 3c). The sensitivities
of sGAG and aggrecan fragment concentrations as markers
for disease were 40% and 32% with specificities of 92% and
91%, respectively (Table 4). We found no significant influence
of sex on the SF levels of sGAG or aggrecan (data not shown).
However, age correlated negatively with sGAG concentration
in the AA group (rS = -0.292) and aggrecan concentration in
the AI and CI groups (rS = -0.335 and rS = -0.230 respectively).
Figure 2
Regression analysis of aggrecan fragment data The same samples of
data.
synovial fluid were analyzed by three different assays (see Material and
Methods for details). Concentration of aggrecan fragments carrying the
neoepitope ARGS by ELISA versus (a) sGAG concentration by Alcian
blue precipitation (n = 293) and versus (b) aggrecan concentration by
1-F21 ELISA (n = 285). Solid lines show the first-order regression.
Note the logarithmic X- and Y-axes. Spearman's rank order correlations
(rS) are given for each relationship with P < 0.0001.
by Chi-squared tests. The percentages of detectable samples
were 96% (AA), 87% (AI), 46% (CI), and 62% (OA) compared with 7.7% in REF. The sensitivity of ARGS fragment
concentration as a marker for joint disease was 67% with a
specificity of 92% (Table 4). We found no significant influence
of age or sex on the SF levels of ARGS fragments (data not
shown).
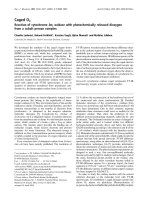
ARGS and aggrecan fragment release in relation to time
after injury
After knee injury involving either a MEN alone (Figures 4a,b),
or an ACL injury with or without associated MEN (Figures
4c,d), the SF levels of both sGAG and ARGS fragments were
elevated within the first four weeks compared with REF (P <
0.001). Notably, the median elevations for MEN and ACL
patients were more than 200-fold compared with REF for
ARGS, but only two- to three-fold for sGAG. For time spans
more than four weeks after injury, the sGAG levels of the MEN
and ACL groups were not different from the REF group,
whereas the ARGS levels continued to differ from REF (except
for 26 to 52 weeks after meniscal injury). At none of the time
intervals were there any differences between MEN and ACL
groups for ARGS or sGAG in SF.
Proportion of aggrecan detected as ARGS neoepitope in
study groups
The proportions of aggrecan fragments in SF detected as
ARGS neoepitope fragments out of all SF proteoglycan
(measured by Alcian blue precipitation) were increased in all
study groups compared with REF (P < 0.001; Figure 5). The
proportion in the AA group was the highest, 111-fold elevated
compared with REF, and in the CI group the least increased,
two-fold compared with the REF group. The median proportion of ARGS in REF was 1% and ranged in the diagnostic
groups from 2% (CI) to 110% (AA). The proportion of ARGS
Table 3
Synovial fluid aggrecan fragment data in all subjects
OA-1 ARGS ELISA
(pmol ARGS/ml)
Alcian blue precipitation
(μg sGAG/ml)
1-F21 ELISA
(μg aggrecan/ml)
n
295
293
285
Mean
75
104
199
Median
10
74
120
Range
0.5 to 961
5 to 728
0.2 to 1912
Page 6 of 11
(page number not for citation purposes)
Available online />
Figure 3
of all aggrecan as a marker for joint disease had a sensitivity of
65% and a specificity of 96% (Table 4).
Discussion
Aggrecanase cleavage at the Glu-Ala bond in the IGD is
important both in animal [6,7,10,11,13,14] and human
[4,9,15,17] joint disease. However, previous analyses of larger
series of human samples of serum or SF used assays that
were not specific for aggrecan fragments carrying this specific
neoepitope [1,3,24,26,29-32]. This limits our ability to interpret the results in terms of activity of specific proteases. The
work presented here confirms that aggrecanase cleavage in
the IGD is a major contributor to aggrecan degradation in
human joint pathology, and extends our understanding of the
relative contribution of aggrecanase activity in different human
joint diseases. We found greatly increased SF concentrations
of aggrecan ARGS fragments in several different joint diseases compared with the healthy knee reference group, differences that were only to a small extent reflected by enhanced
concentrations of aggrecan fragments in general or sulfated
glycosaminoglycans. We also found that the elevation in SF
ARGS concentration was most dramatic early after a knee
injury, and then decreased to lower levels 12 weeks after the
injury, albeit still significantly different from the healthy knee
reference group. This suggests that the enhanced aggrecan
cleavage in the IGD by aggrecanase caused by the acute joint
insult remains increased for several years. Similar long-term
changes after knee injury in SF levels of stromelysin (MMP-3)
have been reported [2,28].
Aggrecan fragment concentrations in the study groups. Concentrations
in the study groups
of (a) ARGS fragments, (b) sulfated glycosaminoglycan (sGAG), and
(c) aggrecan in the study groups healthy knee reference (REF), acute
inflammatory arthritis (AA), acute knee injury (AI), chronic knee injury
(CI), and knee osteoarthritis (OA). The boxes define the 25th and 75th
percentiles with a line at the median, error bars defining the 10th and
90th percentiles and circles represents individual outliers. Note that in
panel (a) the median level of the chronic injury group is the same as the
lower limit of the box; 0.5 pmol ARGS/ml. After Bonferroni correction, P
values below 0.013 are considered significant to retain the 0.05 overall
significance level.
Study design and methodology
The range of ARGS concentrations within each study group
was substantial, with the exception of the healthy knee reference group. In part, this can be explained by the cross-sectional study design, with the grouping together of individuals
with varying severity of injury and disease activity. However, it
is also known that the variability of SF markers is greater than
for serum and urine markers [32]. Despite the considerable
range observed, we note that all study groups differed significantly from the reference group regarding ARGS concentrations. Based on previous studies it is most likely that the knee
injury groups are not homogenous regarding progression of
OA, but are comprised of progressors and non-progressors
[33,34]. It is plausible that heterogeneities like these also influence the ARGS concentrations, and could partly explain the
variations seen in these groups.
The lower limit of linearity of the ARGS ELISA in SF was 1
pmol/ml SF, and samples below this level were assigned half
that value to allow statistical analysis. All study groups had significantly lower proportions of samples below the lower limit of
detection compared with the knee healthy reference group.
As a validation of the ARGS ELISA, we analyzed a subset of
SF samples, purified by dissociative cesium chloride density
Page 7 of 11
(page number not for citation purposes)
Arthritis Research & Therapy
Vol 11 No 3
Larsson et al.
Table 4
Sensitivity and specificity of aggrecan fragment measurements
Assay
Cut-off
AUC
Sensitivity
Specificity
OA-1 ARGS ELISA
1 pmol ARGS/ml
82%
67%
92%
Alcian blue precipitation
88.5 μg sGAG/ml
63%
40%
92%
1-F21 ELISA
188.5 μg aggrecan/ml
53%
32%
91%
ARGS/sGAG*
5%
83%
65%
96%
*The molar proportion of aggrecan fragments in SF detected as ARGS neoepitope fragments, measured by Alcian blue precipitation and the
ARGS ELISA respectively.
Sensitivity = the proportion of positives (diseased) correctly identified by the test.
Specificity = the proportion of negatives (healthy) correctly identified by the test.
AUC = area under receiver operating characteristic (ROC) curve.
Cut-offs were chosen based on ROC curve analysis where the sum of sensitivity and specificity was highest.
gradient centrifugation, with quantitative western blots using
the same ARGS antibody and standard as in the ELISA. The
results verified that samples below the detection level of the
ARGS ELISA had very low levels of ARGS.
captured by the ELISA plate, compared with fragments captured from the standard, is most likely a reflection of a lower
total ARGS concentration in these SFs compared with the
standards.
The similarity in the Western blot analysis of loaded and captured aggrecan ARGS fragments show that the ARGS fragments present in the standard and the cesium chloride D1
preparation of an SF sample are captured by the anti-KS plate.
The weaker immuno-reaction seen for SF ARGS fragments
The strategy applied in the ARGS ELISA of capturing fragments with the anti-KS antibody limits detection of ARGS fragments to those also containing part of the KS domain.
Although there are known cleavage sites for proteases such
as MMPs, cathepsins, and calpains between 393ARGS and
Figure 4
Aggrecan release after knee injury Samples were ordered by time after knee injury (weeks) and by (a, b) meniscal injury alone (MEN) or (c, d) by
injury.
anterior cruciate ligament rupture with or without an associated meniscus injury (ACL). Values are median concentrations of sulfated glycosaminoglycan (sGAG; open squares) and ARGS (filled squares) with 25th and 75th percentiles, compared with the medians (dashed lines) and
25th and 75th percentiles (shaded area) of the reference group on logarithmic Y-axes. Significant difference against the reference group at the 0.001
(***), 0.01 (**) and 0.05 (*) levels after Bonferroni correction is indicated.
Page 8 of 11
(page number not for citation purposes)
Available online />
Figure 5
ever, analysed blinded with diagnostic groups spread evenly,
so the change of lot numbers had no effect on the observed
group differences in ARGS concentrations.
Aggrecan and ARGS fragments as biomarkers in SF
As reported [1,2,24], the group differences in aggrecan content determined by Alcian blue precipitation or by ELISA with
the 1-F21 antibody were small with a maximum of a two-fold
increase compared with the REF. Only AA and AI were shown
to have significantly elevated levels of sGAG and aggrecan
compared with REF.
Proportion ARGS of aggrecan in the study groups The molar proporgroups.
tion of aggrecan fragments in synovial fluid (SF; measured by Alcian
blue precipitation) detected as ARGS neoepitope fragments (measured by ARGS ELISA) in the study groups healthy knee reference
(REF), acute inflammatory arthritis (AA), acute knee injury (AI), chronic
knee injury (CI), and knee osteoarthritis (OA). The boxes define the 25th
and 75th percentiles with a line at the median, error bars defining the
10th and 90th percentiles and circles represents individual outliers. After
Bonferroni correction, P values below 0.013 are considered significant
to retain the 0.05 overall significance level. Conversion from microgram
sulfated glycosaminoglycan (sGAG)/ml to pmol aggrecan/ml was
made assuming an average aggrecan molecular weight of 1.5 × 10⁶ g/
mol and that 75% of this weight was sGAG.
the KS domain stretching from amino acid 676 to 848, these
cleavage sites were all confirmed to occur by in vitro experiments [5]; Sandy and Verscharen showed in SF the presence
of a 100 kDa ARGS band ('Species f') estimated to stretch to
amino acids 800 to 900 [17]. We detected small amounts of
a similar band in SF purified by chromatography or by associative A1 fractioning which, when deglycosylated, migrated to
50 to 70 kDa; the intensity of the band corresponded to about
3% of the total ARGS signal (data not shown). By use of a calculation model [35], we estimate these 393ARGS fragments to
stretch to amino acids 690 to 750 (data not shown). With the
KS domain starting at amino acid 676, these fragments contain part of the domain necessary for capture. We can not,
however, completely rule out the presence of SF ARGS fragments not containing the KS necessary for detection.
The inter assay CV for the ARGS ELISA was to a large part
caused by the use of two different lot numbers of the KS capture plates supplied by Biosource. The samples were, how-
In contrast to the Alcian blue precipitation method and the 1F21 ELISA, the ARGS ELISA is highly specific regarding
neoepitope and presence of KS on the fragments. Even so, the
ARGS neoepitope concentrations correlated with both sGAG
and 1-F21 aggrecan concentrations in SF, consistent with
previous findings showing that a significant portion of the
sGAG and aggrecan content in human SF consisted of
neoepitope fragments such as the ARGS fragments measured here, or MMP-generated 361FFGV fragments [18,36].
The differences in group median values of ARGS were, however, much greater than for either sGAG or 1-F21 aggrecan.
All disease groups were significantly different from the REF,
with as much as 177-fold increased levels of ARGS in the AA
group. With specificities of 91 to 92%, the concentration of
ARGS neoepitope fragments had a sensitivity of 67% in differentiating diseased from healthy patients, compared with
sGAG or 1-F21 aggrecan, which had lower sensitivities of
40% and 32%, respectively. Quantification in SF of ARGS
fragments generated by aggrecanases by a neoepitope-specific ELISA is clearly a more powerful tool to distinguish diseased and injured joints from healthy than quantification of
aggrecan fragments either by 1-F21 ELISA or by measuring
sGAG concentrations.
Proportion of aggrecan detected as ARGS neoepitope
Acknowledging that there are uncertainties in our assumptions
of molecular weight and degree of glycosylation of the average
aggrecan fragment in SF, and of the molecular weight of the
standard, uncertainties that make ARGS proportions of aggrecan greater than 100% possible, the diagnostic groups nevertheless showed large differences in the proportion of SF
aggrecan fragments generated by aggrecanase IGD activity.
In the two groups most strongly associated with high joint disease activity, acute inflammatory arthritis and acute knee injury,
a majority of the aggrecan fragments were indeed shown to be
the result of aggrecanase IGD activity, whereas the other
groups had much lower proportions. These results corroborate those previously obtained by western blots [4].
Interpretation of elevated SF levels of ARGS
Based solely on data available in this paper, the elevated SF
levels of ARGS in disease, particularly in the acute inflammatory arthritis and acute injury samples, could be explained by
Page 9 of 11
(page number not for citation purposes)
Arthritis Research & Therapy
Vol 11 No 3
Larsson et al.
enhanced aggrecanase activity against aggrecan resident in
the joint cartilage matrix, or against newly synthesized and
secreted aggrecan [37]. ADAMTS-5 (aggrecanase-2) was
shown to co-localize with hyaluronan surrounding chondrocytes in both normal and osteoarthritic cartilage [38]. However, if enhanced synthesis of aggrecan in combination with
aggrecanase activity were to explain the enhanced SF levels
of ARGS, an equal increase in the SF levels of G3 was to be
expected. This is not the case; we have in quantitative western
blot analysis of 30 of these samples seen no significant difference in SF levels of G3 of any of the diagnostic groups compared with healthy knee references [4]. We therefore suggest
that an increased aggrecanase activity against the IGD
domain of resident aggrecan best explains the enhanced SF
levels of ARGS seen in these diagnostic groups.
Acknowledgements
The authors would like to thank Michael Pratta and Sanjay Kumar for the
generous gift of ADAMTS-4, the mAb OA-1 and KS capture ELISA
plates, Maria Hansson for help in the modification of the ARGS ELISA
and data acquisition, Jan-Åke Nilsson for useful comments on the statistical analysis and Ewa Roos for constructive input on the study design.
Supported by: The Swedish Research Council (LSL), the Swedish
Rheumatism Association (LSL), the Kock Foundation (AS), the King
Gustaf V 80-year Birthday Fund (LSL), the Faculty of Medicine Lund University (LSL), Region Skåne (LSL), Magnus Bergvalls Foundation (AS),
Alfred Österlunds Foundation (AS), and Swärds/Eklunds Foundations
(AS).
References
1.
2.
The source of the aggrecan fragments
SF is more proximate to the location of joint cartilage and
aggrecan degradation than serum or urine, and may therefore
better reflect local pathologic processes in the joint being
studied. The observed group differences are thus likely to
reflect differences in local knee joint pathology. The fragments
observed in SF originate in a major part from the joint cartilage,
while minor proportions may be released from menisci and ligaments [39,40].
Conclusions
Our findings confirm that aggrecanase cleavage at the 392Glu393Ala bond in the IGD of aggrecan is enhanced in joint pathology, most markedly in acute inflammatory arthritis and early
after knee injury, but also in knee OA. The enhanced aggrecanase IGD cleavage is detectable by ELISA as ARGS fragments in the SF. We show that measuring SF concentrations
of ARGS is more sensitive in distinguishing diseased and
injured joints from healthy ones than methods that do not rely
on the specific detection of this aggrecan neoepitope. The
ARGS ELISA could be used to monitor aggrecanase activity
in joint disease, and to monitor the efficacy of interventions to
inhibit this protease activity in joint disease or model systems.
Competing interests
3.
4.
5.
6.
7.
8.
9.
10.
The authors declare that they have no competing interests.
Authors' contributions
SL participated in the design of the study, carried out the modification of the ARGS ELISA, the acquisition of data and the
analysis and interpretation thereof, and was primarily responsible for writing the manuscript. AS contributed in the design
of the study, in the modification of the ARGS ELISA, and
helped draft the manuscript. LSL participated in the design of
the study, collected samples, provided previous assay data,
and helped draft the manuscript. All authors read and
approved the final manuscript.
Page 10 of 11
(page number not for citation purposes)
11.
12.
13.
Lohmander LS, Dahlberg L, Ryd L, Heinegard D: Increased levels
of proteoglycan fragments in knee joint fluid after injury.
Arthritis Rheum 1989, 32:1434-1442.
Lohmander LS, Hoerrner LA, Dahlberg L, Roos H, Bjornsson S,
Lark MW: Stromelysin, tissue inhibitor of metalloproteinases
and proteoglycan fragments in human knee joint fluid after
injury. J Rheumatol 1993, 20:1362-1368.
Saxne T, Glennas A, Kvien TK, Melby K, Heinegard D: Release of
cartilage macromolecules into the synovial fluid in patients
with acute and prolonged phases of reactive arthritis. Arthritis
Rheum 1993, 36:20-25.
Struglics A, Larsson S, Hansson M, Lohmander LS: Western blot
quantification of aggrecan fragments in human synovial fluid
indicates differences in fragment patterns between joint diseases. Osteoarthritis Cartilage 2009, 17:497-506.
Sandy JD: Proteolytic degradation of normal and osteoarthritic
cartilage matrix. In Osteoarthritis 2nd edition. Edited by: Brandt
KD, Doherty M, Lohmander LS. Oxford: Oxford University Press;
2003:82-92.
Glasson SS, Askew R, Sheppard B, Carito B, Blanchet T, Ma HL,
Flannery CR, Peluso D, Kanki K, Yang Z, Majumdar MK, Morris EA:
Deletion of active ADAMTS5 prevents cartilage degradation in
a murine model of osteoarthritis. Nature 2005, 434:644-648.
Stanton H, Rogerson FM, East CJ, Golub SB, Lawlor KE, Meeker
CT, Little CB, Last K, Farmer PJ, Campbell IK, Fourie AM, Fosang
AJ: ADAMTS5 is the major aggrecanase in mouse cartilage in
vivo and in vitro. Nature 2005, 434:648-652.
Sandy JD, Flannery CR, Neame PJ, Lohmander LS: The structure
of aggrecan fragments in human synovial fluid. Evidence for
the involvement in osteoarthritis of a novel proteinase which
cleaves the Glu 373-Ala 374 bond of the interglobular domain.
J Clin Invest 1992, 89:1512-1516.
Lohmander LS, Neame PJ, Sandy JD: The structure of aggrecan
fragments in human synovial fluid. Evidence that aggrecanase
mediates cartilage degradation in inflammatory joint disease,
joint injury, and osteoarthritis.
Arthritis Rheum 1993,
36:1214-1222.
Carter QL, Dotzlaf J, Swearingen C, Brittain I, Chambers M, Duffin
K, Mitchell P, Thirunavukkarasu K: Development and characterization of a novel ELISA based assay for the quantitation of
sub-nanomolar levels of neoepitope exposed NITEGE-containing aggrecan fragments. J Immunol Methods 2007,
328:162-168.
Karsdal MA, Sumer EU, Wulf H, Madsen SH, Christiansen C,
Fosang AJ, Sondergaard BC: Induction of increased cAMP levels in articular chondrocytes blocks matrix metalloproteinasemediated cartilage degradation, but not aggrecanase-mediated cartilage degradation.
Arthritis Rheum 2007,
56:1549-1558.
Song RH, Tortorella MD, Malfait AM, Alston JT, Yang Z, Arner EC,
Griggs DW: Aggrecan degradation in human articular cartilage
explants is mediated by both ADAMTS-4 and ADAMTS-5.
Arthritis Rheum 2007, 56:575-585.
Sumer EU, Sondergaard BC, Rousseau JC, Delmas PD, Fosang
AJ, Karsdal MA, Christiansen C, Qvist P: MMP and non-MMPmediated release of aggrecan and its fragments from articular
cartilage: a comparative study of three different aggrecan and
glycosaminoglycan assays. Osteoarthritis Cartilage 2007,
15:212-221.
Available online />
14. Karsdal MA, Madsen SH, Christiansen C, Henriksen K, Fosang AJ,
Sondergaard BC: Cartilage degradation is fully reversible in
the presence of aggrecanase but not matrix metalloproteinase
activity. Arthritis Res Ther 2008, 10:R63.
15. Rousseau JC, Sumer EU, Hein G, Sondergaard BC, Madsen SH,
Pedersen C, Neumann T, Mueller A, Qvist P, Delmas P, Karsdal
MA: Patients with rheumatoid arthritis have an altered circulatory aggrecan profile. BMC Musculoskelet Disord 2008, 9:74.
16. Nagase H, Kashiwagi M: Aggrecanases and cartilage matrix
degradation. Arthritis Res Ther 2003, 5:94-103.
17. Sandy JD, Verscharen C: Analysis of aggrecan in human knee
cartilage and synovial fluid indicates that aggrecanase
(ADAMTS) activity is responsible for the catabolic turnover
and loss of whole aggrecan whereas other protease activity is
required for C-terminal processing in vivo. Biochem J 2001,
358:615-626.
18. Struglics A, Larsson S, Pratta MA, Kumar S, Lark MW, Lohmander
LS: Human osteoarthritis synovial fluid and joint cartilage contain both aggrecanase- and matrix metalloproteinase-generated aggrecan fragments.
Osteoarthritis Cartilage 2006,
14:101-113.
19. Pratta MA, Su JL, Leesnitzer MA, Struglics A, Larsson S, Lohmander LS, Kumar S: Development and characterization of a
highly specific and sensitive sandwich ELISA for detection of
aggrecanase-generated aggrecan fragments. Osteoarthritis
Cartilage 2006, 14:702-713.
20. Moller HJ, Larsen FS, Ingemann-Hansen T, Poulsen JH: ELISA for
the core protein of the cartilage large aggregating proteoglycan, aggrecan: comparison with the concentrations of immunogenic keratan sulphate in synovial fluid, serum and urine.
Clin Chim Acta 1994, 225:43-55.
21. Poole AR, Ionescu M, Swan A, Dieppe PA: Changes in cartilage
metabolism in arthritis are reflected by altered serum and synovial fluid levels of the cartilage proteoglycan aggrecan. Implications for pathogenesis. J Clin Invest 1994, 94:25-33.
22. Bjornsson S: Simultaneous preparation and quantitation of
proteoglycans by precipitation with alcian blue. Anal Biochem
1993, 210:282-291.
23. Tortorella MD, Burn TC, Pratta MA, Abbaszade I, Hollis JM, Liu R,
Rosenfeld SA, Copeland RA, Decicco CP, Wynn R, Rockwell A,
Yang F, Duke JL, Solomon K, George H, Bruckner R, Nagase H,
Itoh Y, Ellis DM, Ross H, Wiswall BH, Murphy K, Hillman MC Jr,
Hollis GF, Newton RC, Magolda RL, Trzaskos JM, Arner EC: Purification and cloning of aggrecanase-1: a member of the
ADAMTS family of proteins. Science 1999, 284:1664-1666.
24. Dahlberg L, Ryd L, Heinegard D, Lohmander LS: Proteoglycan
fragments in joint fluid. Influence of arthrosis and inflammation. Acta Orthop Scand 1992, 63:417-423.
25. Heinegård D, Sommarin Y, Leon WC: [17] Isolation and characterization of proteoglycans. In Methods in Enzymology Volume
144. London: Academic Press; 1987:319-372.
26. Lohmander LS, Ionescu M, Jugessur H, Poole AR: Changes in
joint cartilage aggrecan after knee injury and in osteoarthritis.
Arthritis Rheum 1999, 42:534-544.
27. Lohmander LS, Hoerrner LA, Lark MW: Metalloproteinases, tissue inhibitor, and proteoglycan fragments in knee synovial
fluid in human osteoarthritis.
Arthritis Rheum 1993,
36:181-189.
28. Lohmander LS, Roos H, Dahlberg L, Hoerrner LA, Lark MW: Temporal patterns of stromelysin-1, tissue inhibitor, and proteoglycan fragments in human knee joint fluid after injury to the
cruciate ligament or meniscus. J Orthop Res 1994, 12:21-28.
29. Saxne T, Heinegard D, Wollheim FA, Pettersson H: Difference in
cartilage proteoglycan level in synovial fluid in early rheumatoid arthritis and reactive arthritis. Lancet 1985, 2:127-128.
30. Saxne T, Heinegard D, Wollheim FA: Therapeutic effects on cartilage metabolism in arthritis as measured by release of proteoglycan structures into the synovial fluid. Ann Rheum Dis
1986, 45:491-497.
31. Saxne T, Wollheim FA, Pettersson H, Heinegard D: Proteoglycan
concentration in synovial fluid: predictor of future cartilage
destruction in rheumatoid arthritis? Br Med J (Clin Res Ed)
1987, 295:1447-1448.
32. Lohmander LS, Dahlberg L, Eyre D, Lark M, Thonar EJ, Ryd L: Longitudinal and cross-sectional variability in markers of joint
metabolism in patients with knee pain and articular cartilage
abnormalities. Osteoarthritis Cartilage 1998, 6:351-361.
33. Englund M, Roos EM, Lohmander LS: Impact of type of meniscal
tear on radiographic and symptomatic knee osteoarthritis: a
sixteen-year followup of meniscectomy with matched controls. Arthritis Rheum 2003, 48:2178-2187.
34. Englund M, Lohmander LS: Risk factors for symptomatic knee
osteoarthritis fifteen to twenty-two years after meniscectomy.
Arthritis Rheum 2004, 50:2811-2819.
35. Struglics A, Larsson S, Lohmander LS: Estimation of the identity
of proteolytic aggrecan fragments using PAGE migration and
Western immunoblot.
Osteoarthritis Cartilage 2006,
14:898-905.
36. Fosang AJ, Last K, Maciewicz RA: Aggrecan is degraded by
matrix metalloproteinases in human arthritis. Evidence that
matrix metalloproteinase and aggrecanase activities can be
independent. J Clin Invest 1996, 98:2292-2299.
37. Lohmander LS, Eyre DR: Biochemical markers as surrogate
end points of joint disease. In Clinical trials in rheumatoid arthritis and osteoarthritis Edited by: Reid DM, Miller CG. London;
Springer; 2008:249-274.
38. Plaas A, Osborn B, Yoshihara Y, Bai Y, Bloom T, Nelson F, Mikecz
K, Sandy JD: Aggrecanolysis in human osteoarthritis: confocal
localization and biochemical characterization of ADAMTS5hyaluronan complexes in articular cartilages. Osteoarthritis
Cartilage 2007, 15:719-734.
39. McAlinden A, Dudhia J, Bolton MC, Lorenzo P, Heinegard D, Bayliss MT: Age-related changes in the synthesis and mRNA
expression of decorin and aggrecan in human meniscus and
articular cartilage. Osteoarthritis Cartilage 2001, 9:33-41.
40. Verdonk PC, Forsyth RG, Wang J, Almqvist KF, Verdonk R, Veys
EM, Verbruggen G: Characterisation of human knee meniscus
cell phenotype. Osteoarthritis Cartilage 2005, 13:548-560.
Page 11 of 11
(page number not for citation purposes)