- Trang chủ >>
- Khoa Học Tự Nhiên >>
- Vật lý
Green Energy and Technology - Energy for a Warming World Part 5 pot
Bạn đang xem bản rút gọn của tài liệu. Xem và tải ngay bản đầy đủ của tài liệu tại đây (333.91 KB, 19 trang )
3.6 Solar Power 67
Chap. 2. The gravitational analogy would be a pin ball machine with two levels
and a ramp where they join up. At the upper level (N-side) there are pins and
a number of energetic balls reverberating around. On the lower (P-side) there is
a similar number of pins, a few holes just large enough for balls to fall into and far
fewer pin balls than on the upper level. On a flat table by dint of fortuitous colli-
sions in the upper tier a pin ball may occasionally head towards the ramp and drop
to the lower layer. Some of these will disappear into holes, but those that do not,
and continue to bounce around on the lower layer will not get back to the upper
layer because of the ramp. At this point, the analogy only partially describes the
semi-conductor diode action, because there is nothing to stop the rattling pin balls
on the upper level continuing to reach the lower level. This can be corrected by
introducing a gravitational field to model the electric field in the diode. We need
to imagine that balls falling into the holes trigger a mechanism that tilts the table,
raising the lower end, and lowering the upper end, until the point is reached where
pin balls heading for the ramp are turned back by the slope of the table, i.e., by the
force of gravity. The wave detection analogy is almost complete. Consider, finally,
what happens if the table is rocked very gently about this stable state. Increasing
the tilt will have virtually no effect on ball movement down the ramp, with the
increased gravitational force further discouraging even the most energetic balls
from approaching the ramp. It is assumed that the tilt is never enough to allow
balls to roll up the ramp. On the half cycle of the rocking movement when the tilt
is reduced towards zero we return to a state where gravity is again insufficient to
prevent some balls on the upper level finding their way over the ramp. Thus the
oscillating movement results in a one way current of balls (DC when averaged) on
the tilt lowering half cycles. Crudely the rocking table (AC) produces one way ball
flow (DC). This is AC to DC conversion.
AC–DC conversion is also the process that occurs in a semiconductor junction
immersed in electromagnetic waves. The action of the electric field of the wave on
the electrons in the semiconductor junction layers is not unlike the effect of the
tilting table on the pin balls. When the electric field across the junction due to the
electromagnetic wave, is in the direction of reducing the charge separation field,
electrons will start to find their way across the junction, and a current flows (see
Fig. 3.7). On the other hand, in the half cycle of the wave when the electric field
enhances the charge separation field, electrons continue to be prevented from
crossing the junction. The averaged charge flow across the junction thus contrib-
utes to a DC current through the semiconductor diode resulting from its immersion
in the AC electromagnetic wave. At light frequencies the process is more compli-
cated owing to quantum effects and photon absorption, which enhances the current
generation mechanism. In fact modern solar cells actually have a thin layer of
intrinsic material (undoped silicon) between the P-type and N-type semiconduc-
tors (PIN diodes), which helps improve photon collection and hence efficiency.
A solar cell’s energy conversion efficiency is defined as the percentage of power
converted from absorbed light into electrical power, when it is connected to an
electrical circuit. The DC power generated by a solar cell is given approximately
by the product of its efficiency, its area in square metres, and the irradiance
68 3 Limits to Renewability
[30,
31]. A 0.01
m
2
cell with an optimistic efficiency of 20%, located in the Sahara
desert and pointing at the sun with an irradiance of 300
W/m
2
will generate about
0.6
W. Of course the sun shines for only 50% of the day in near equatorial regions
so we have to assume that we will collect 0.3
W averaged over time. Clearly we
will need an awful lot of cells of this area to generate significant power.
Most solar cells in operation today are single crystal silicon cells. The silicon
is purified and refined by well established techniques into a single crystal (typi-
cally 120
mm in diameter and 2
mm thick) and then micromachined to form
50
μm thick wafers [32]. (A micrometer (μm) is one thousandth of a millimetre
(mm).) The technique involves taking the silicon crystal, and making a multitude
of parallel transverse slices across the wafer (rather like finely slicing a round loaf
of bread) creating a large number of wafers, which are then aligned edge to edge
(slices of bread laid out flat to be toasted in the sun) to form a cell comprising
1000 wafers of dimensions 100
mm
×
2
mm
×
0.1
mm laid end-to-end on the
100
μm edges. A total exposed silicon surface area of about 2000
cm² per side is
thus realised. As a result of this slicing, the electrical doping and contacts that
were on the face of the original crystal are located on the edges of the wafer,
rather than the front and rear as is the case with conventional cells. This has the
interesting effect of making the cell sensitive from both the front and rear
(a property known as bi-faciality) [32]. Using this technique, one silicon crystal
can result in a cell capable of generating 10–12
W of electrical power in bright
sunlight. In order to achieve this level of power output from un-sliced silicon
crystal cells we would require about 40 crystals. The electrical contacts formed
from evenly spaced metal tabs on the wafer edges are connected (an added tech-
nical complication in the fabrication of sliced silicon cells) to a larger ‘bus’ con-
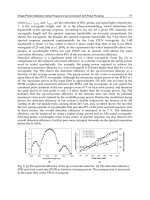
Fig. 3.7 Schematic of photovoltaic crystal showing an electron dislodged by photons striking
the surface drifting though the P-layer
3.6 Solar Power 69
ductor to transmit the power. The cell is covered with a thin protective layer of
dielectric with an anti-reflective coating. Cells of this construction generally rep-
resent a good compromise between cost effectiveness, reliability and efficiency.
In very large solar array systems [33] cells are incorporated into panels that are
approximately 3
m
×
3
m in area, each capable of producing a power of about
260
W averaged over time. Several panels (typically 100) are combined to form
a module delivering something like 25
kW and will occupy a ground area of
320
m
×
3.2
m when stiffening frames, expansion gaps and windage gaps are fac-
tored into the area calculation. A 100
MW sub-array would typically be formed
from 4
×
1000 modules and will expand the ground coverage to 1.3
km
×
3.2
km
(ignoring support structure and access spacing). To get to a decent sized solar
array power station we need 10 (2
×
5 say) of these. A ground coverage of up to
2.6
km
×
16
km results. The expanse of ground required to accommodate such an
array, has to be almost four times the area of the array itself, to allow space for
structural supporting frames, plinths, access roadways, and automatic cleaning
systems, and to locate transmission lines, inverters and transformers – so we are
looking at 160
million square metres to produce 1
GW at the array. The solar
power conversion factor per unit area of global surface reduces to 6.3
W/m
2
, from
the 170
W/m
2
irradiance level often used rather too optimistically in documents
advocating the merits of solar power.
The electrical connections between cells, between panels, between modules and
between sub-arrays are designed to achieve a voltage in the range of about 6–7
kV.
This is, of course, DC and it is necessary to convert this to 50/60
Hz three phase
AC, at a voltage of about 500
kV for long range transmission across the conven-
tional grid. DC/AC conversion is technically quite simple, and essentially involves
switching the direction of the DC current in the primary winding of a step-up
transformer. The arrangement is termed an inverter. In high power, high voltage
systems, solid state thyristors, or mercury arc valves [34] can be used to perform
the electrical switching. With the help of harmonic filtering, a three phase sinusoi-
dal AC voltage, at the level of the grid is thus formed across the output terminals
of the secondary of the transformer. To handle an array power level of 1
GW, the
inverter system is large and is likely to require a power house occupying an area of
about 300
m
×
300
m, on the solar farm site. When switching losses, transformer
losses, and mismatch losses within the power house equipment, and optical degra-
dation losses in the array, are taken into account, power to the grid is diminished
by a factor of about 0.78. Therefore to launch 1
GW on to the grid we require
approximately 200
million square metres of desert landscape, and this equates to
an area conversion factor for solar power of 5.0
W/m
2
.
The alternative way of converting solar power to useful electricity employs
much more conventional technology. The concept underpinning concentrated
solar power (CSP) could be described as child’s play! Many children, at some
stage in their play activity, are likely to have discovered, or been shown, that a
magnifying glass creates a bright hot spot on paper, which has sufficient power
density to cause the paper to singe and hence to etch a hole. Every scout used to
know that this was the only legitimate way to start a fire! Match-sticks were
70 3 Limits to Renewability
cheating. The magnifying glass if properly shaped concentrates the parallel rays
of the sun by bending (remember Snell’s laws [35] from school physics?) them
through the lens and directing them towards a focus, where the paper should be
located. In very large scale CSP systems lenses would be far too expensive and
much too cumbersome and heavy to distribute over many square miles of desert,
so instead ray concentration is achieved using curved moulded reflectors. These
systems are really the inverse of a car headlight on a very large scale. If a car
headlight reflector were used to collect the rays of the sun on a bright sunny day a
hot spot of light would be formed where the bulb is normally located. In panel
sizes appropriate for the forming of large solar arrays, parabolic reflectors are
relatively inexpensive, they are not heavy, and, importantly, they can be manoeu-
vred electronically to track the sun. The requirement to focus the concentrated
solar energy on collectors and to continue do this as the sun traverses the sky,
means that CSP farms must be located on stable terrain. In addition they are re-
stricted to land areas where winds are generally light to ensure minimal distur-
bance to the alignment of the optical reflectors.
The technology of CSP farms comprises the following six basic elements:
a collector, a receiver, a fluid transporter, an energy convertor, a generator and
a transformer. All of these sub-systems can be realised today using well estab-
lished and available technology. Needless to say a range of system topologies are
under development each of which has its advantages and disadvantages. The alter-
native arrangements are essentially distinguished by the way in which the solar
reflectors are organised to concentrate the light onto a receiver containing a work-
ing fluid. In parabolic trough systems the reflectors (curved in one plane only –
see Fig 3.8) are arranged in parallel rows (usually in north–south alignment) di-
recting light onto long straight receiver pipes lying along the focal line of the
Fig. 3.8 Schematic of parabolic trough CSP system
3.6 Solar Power 71
trough. The changing height of the sun in the sky as the day progresses is accom-
modated by a tracking system, which very slowly rotates the mirrors about a hori-
zontal axis. Fluid flowing, under pressure, through the receiver tube is heated to
between 100 and 500°C, and then transported through a well insulated network of
pipes to a boiler, to generate steam. The conversion efficiency from solar power
incident on the reflectors to heat in the receiver fluid is of the order of 60%. In-
cluded in this figure is 91% reflectivity for the mirrors and 95% interception by
the receiver. The superheated steam system can be expected to perform to an effi-
ciency of about 85% [36]. Thereafter the solar plant is not greatly different from
a coal-fired electricity generator, with the steam feeding a conventional turbine
(efficiency
=
40%), followed by a synchronous generator with an efficiency of
90% and a step-up transformer (efficiency
=
95%). These figures give a ball-park
estimate for conversion efficiency, from solar incident power to electrical power
to the grid, of 18%. To generate 1
GW at the grid, on a hot arid desert with
300
W/m
2
of irradiance for 50% of the day, we will need 37
million square metres
of reflectors. Given that real estate required to accommodate this area of reflectors
is close to five times reflector expanse (estimated from studying Solar Energy
Generating Systems (SEGS) in the Mojave desert [37]) then we need 185
million
square metres (5.4
W/m
2
). Within the error range implicit in the way the above
efficiency figures are estimated, it is reasonably valid to assert that the trough CSP
system and the PV system are largely comparable in performance, in relation to
their overall conversion efficiency of solar power to grid electrical power. It is
hardly surprising that this should be so. Otherwise competition between the two
systems for major funding contracts would not be so fierce.
The other CSP formats that have been proposed envisage mirror arrangements
that provide higher optical power density at the focus of the reflectors. In the
so-called heliostat system the individual parabolic reflectors are arranged in rings
around a central tower. It is claimed to have two basic advantages over the trough
system. First, the sun can be tracked in both elevation and azimuth, and second,
the fluid passing through the receiver on the central tower is raised to a much
higher temperature in the range 800°C to 1000°C. This promises greater effi-
ciency, although no full scale prototypes have been built to establish this. Conse-
quently, it seems reasonable to conclude that this system is too early in its devel-
opment to be considered to be a contender for major deployment in the deserts of
the world by 2030.
A third system, which is also at the early prototype stage of development, is
based on solar ray focusing by a circular (~
40
ft diameter) dish-shaped parabolic
reflector, each of which with its receiver is a stand alone electricity generator.
Power station levels of electrical power are gathered from large numbers of these
deployed in an extensive regular grid in a suitable desert scenario. Several proto-
type installations of limited size have been operating successfully over the past
decade. Each dish is like a very large car headlight reflector and all are automati-
cally controlled to accurately focus the suns rays on to the receiver. The sun is,
again, tracked by tilting the dish in both elevation and azimuth. Despite the addi-
tional complexity and manufacturing cost of the large dish-shaped parabolic re-
72 3 Limits to Renewability
flectors and their sophisticated support structures, the arrangement has two distinct
advantages. First, the system is modular, in so far as every dish and receiver set is
an independent solar power station (rather like a wind generator) and consequently
they can be installed and efficiently operated on hilly terrain, unlike trough and
heliostat systems. Second, by replacing the fluid mechanism for transporting the
heat generated by the focused solar rays, with a device in the focus of each dish
that converts the solar heat directly into electricity, efficiency improvements can
be realised. This device comprises a Stirling engine coupled to an induction gen-
erator. The Stirling option becomes feasible with operating temperatures in the
region of 700°C.
The Stirling engine is in many ways much like the petrol or diesel engine that
powers your car, except for one major difference. It is an external combustion
engine rather than an internal combustion engine. While the gas in the cylinder of
a petrol engine (vaporised petrol) is ignited by a spark and burnt internally, and in
a diesel engine the vaporised diesel is ignited internally by pressure then burnt
within the cylinder, the working gas in a Stirling engine, usually hydrogen, is
sealed into the cylinder and is not burnt. Piston movement is caused by thermal
expansion of the gas by the external application of heat through a heat-exchanging
interface material. In the solar dish type array the heat is supplied by the focused
sunlight. At peak operation (irradiance greater than 250
W/m
2
) the conversion
efficiency from solar power collected by the parabolic dish to electrical power
supplied by the generator is claimed to be 30% on the basis of prolonged testing
[38]. The system efficiency is, however, susceptible to daytime irradiance drop-
ping below the optimum level due to clouds or haze, and this means that over
time, a 23% conversion efficiency for solar power to electrical power to the grid,
for a large farm of this type, is more representative of its real capability. This is
still better than trough and heliostat systems because of the avoidance of the losses
associated with the inefficient transfer of power to the steam turbines through the
agency of a hot fluid.
It must be clear to anyone who has driven a car with windscreen wipers on
a very slow sweep that the presence of moisture, or rain drops, on the screen dis-
torts and attenuates forward vision. The same is true of the optical surfaces of
a PV array, or on the mirrors of solar concentrators. Optical distortion of this de-
scription can be very deleterious to solar array efficiency. Consequently, large
solar power stations are planned [33] to be sited in desert areas, where solar irradi-
ance is high and optical contamination, and therefore optical distortion, is mini-
mised in the dry atmosphere. The most suitable arid desert locations [33] are the
Sahara (8.6
million square kilometres), the Gobi (1.3
million square kilometres),
the Thar (India: 0.2
million square kilometres), the Negev (Arabia: 0.001
million
square kilometres), the Sonoran (Mexico: 0.31
million square kilometres), the
Mojave (California: 0.7
million square metres) and the Great Sandy (Australia:
0.4
million square kilometres), giving an area of 11.5
million square kilometres,
although not all of this is sufficiently flat to accommodate vast trough arrays or
sufficiently wind-free to keep possible mirror misalignments to a minimum. The
total desert area for the planet is closer to 17
million square kilometres, but many
3.6 Solar Power 73
of the other deserts such as the Great Basin and the Chihuahuan in Mexico lack
a sufficiently dry, cloud free climate, and lack suitably large expanses of level
ground, to provide attractive solar ‘farming’.
The deserts identified above, and solar power stations if located there, will be
quite remote from the communities which they are intended to serve. For example
there are quite advanced plans to supply the future electricity needs of Europe
from solar farms on the Sahara desert [33] but this entails very long transmission
distances – 3000
km and more, with submarine cables carrying electrical power
from North Africa to Europe on the floor of the Mediterranean Sea. As we have
already noted in Sect. 2.6, very long overhead power lines, and particularly long
underground or undersea cables, present significant transmission difficulties for
AC systems because of reactive power loss. It is necessary to introduce frequent
shunt compensation along the cables to minimise loss and stability problems.
These interconnections increase fault occurrence levels for the overall system.
The solution, as we observed in Sect. 2.6, is DC transmission, which suffers none
of these difficulties. The ‘spin’ attached to HVDC (high voltage direct current) is
that losses are much lower and installation costs are less than for AC, but it is
important that we are clear what is meant by ‘losses’. While reactive power losses
are no longer a problem using HVDC, ohmic or joule heating losses continue to
feature. In Sect. 2.6 we noted that these losses contribute 8% per thousand kilo-
metres for an AC line. The disappearance of skin effect for DC transmission
means that this figure is reduced to about 6% per thousand kilometres. Distances
from solar farms to consumers are much greater than those associated with the
current grid system, so that on average transmission losses will be nearer 15%
than 6%. A further 1–2% is lost in distribution, which means that when transmis-
sion and distribution losses are factored into the solar power to consumer equa-
tion, we end up with a figure of 4.5
W/m
2
.
Potential as a Source of ‘Green’ Energy
With a conversion rate for solar power to the consumer of 4.5
W/m
2
, it is theo-
retically possible, using an area of 11.5
million square kilometres representing the
area of identified suitable deserts, to extract from solar power 52
TW; three times
current global power consumption. Of course, it is pure fantasy to consider the
deserts of the world being covered completely by solar farms. Even deserts sup-
port rich and diverse forms of life and have environmental and ecological impor-
tance [39,
40]. This would clearly be jeopardised if blanket coverage by solar
farms were perpetrated on them, although it is not difficult to find in the energy
industry literature, ‘artist’s illustrations’ attempting to depict what tens of millions
of acres of Arizona desert could look like, if covered in optical reflectors. So
clearly it is not an impossible concept for some. Concern for desert peoples, such
as aborigines in the Great Sandy, 2.5
million nomads in the Sahara, nomadic
Mongols, Uyghurs, Kazakhs in the Gobi, and for desert ecology, mean that it will
74 3 Limits to Renewability
not be wise, sensible or prudent to allow solar farms to cover more than 8% of
desert land area [33], simply replacing one form of pollution with another, with-
out being fully cognizant of the possible environmental impact. 8% is right at the
top end of what is considered to be within the bounds of possibility, given time
and manpower. To put this in perspective – we are talking about covering an
expanse of the globe with solar panels, equal in area to France plus Spain plus
Portugal! Limitations will also be created by the vulnerability of vast farms to
encroachment by unfriendly human beings (en masse the species is remarkably
unintelligent and warlike) intent on mayhem, leading to intractable security and
protection issues, to severe maintenance difficulties, and to major safety and reli-
ability concerns. Assuming humanity is prepared to tolerate, and could protect
and maintain, solar farms spread over a dispersed area of the proportions of
France plus Iberia, the conclusion emerges that such farms could, in principle,
generate a grand total of 4.2
TW of electrical power to the consumer, but clearly
not by 2030, without an unprecedented redirection of financial resources to make
it happen. Small scale solar systems for local heating and lighting could perhaps
add about 0.3
TW to this giving a long term goal for solar of approximately
4.5
TW; 28% of current global needs. This solar contribution of 4.5
TW to the
global demand for energy is clearly in the realms of the possible at some point in
the future, but what is achievable by 2030, on the basis of currently incoherent
energy policies? A range of sources of statistical data exist in which growth
trends for the installed capacity of solar power stations are presented. Unfortu-
nately the predicted rates often seem to be linked to the agenda of the sponsor of
the report. Estimates for global solar capacity in 2050 can differ by as much as
100% between one report and the next despite the fact that they appear to use
similar data for the period 2000–2005. Growth rates over this period [41] are
essentially exponential for large scale solar power (including both PV and CSP)
with an initial capacity in 2000 of 0.2
GW rising to 0.54
GW in 2005. When this
rate of growth is extrapolated to 2030, a figure for installed solar capacity, in
large scale enterprises, of about 70
GW is indicated. Of this 70
GW no more than
60
GW will be accessible by the consumer, because of high transmission losses
over larger than average distances, together with distribution losses. This is just a
tiny fraction, namely 0.4%, of predicted demand by 2030.
3.7 Geo-thermal Power
Where the Power Comes From
Although geothermal energy is classed, in international energy tables, as a ‘new
renewable’, it is not really a new energy source at all. Hot springs for bathing
and washing clothes have been used by people in many parts of the world since
the dawn of history [42]. Modern geothermal production wells can gather large
amounts of power from the ground by going deep. They are commonly over
3.7 Geo-thermal Power 75
2
km deep, but at present rarely much over 3
km. With an average thermal gradi-
ent of 25–30°C/km, a 1
km deep well in dry rock formations would have a base
temperature near 40°C in many parts of the world (assuming a mean annual
temperature of 15°C) while at the foot of a 3
km well the temperature would be
in the range 90–100°C. With sophisticated exploitation techniques, which make
optimum use of these temperature gradients, it is estimated that 65–140
GW of
electrical power could be generated, worldwide, from geothermal sources.
Exploitable geothermal systems occur in a number of geological environments
[43]. They can be divided broadly into two groups, depending on whether they are
related to young volcanoes and magmatic activity or to lower temperature mecha-
nisms. High-temperature fields used for conventional electric power production
(with temperatures above 150°C) are mostly confined to the former group, and we
shall concentrate on this source. Until recently, geothermal fields were more
commonly exploited for space heating purposes with direct transfer of thermal
energy from the wells to local buildings. This application can be found in both
groups. Needless to say, the temperature of geothermal reservoirs can vary from
place to place, depending on the local conditions.
High-temperature fields capable of providing significant levels of generated
electrical power are dependent on volcanic activity, which mainly occurs along
so-called tectonic plate boundaries. According to the plate tectonics theory, the
Earth’s crust is divided into a few large and rigid plates which float on the hot
inner mantle and move relative to each other at average rates counted in centime-
tres per year (the actual movements are highly erratic). The plate boundaries are
characterised by intense faulting and seismic activity, and in many cases volcanic
activity. Geothermal fields are very common on plate boundaries, as the crust is
highly fractured and thus permeable, and sources of heat are readily available.
While most of the plate boundaries are beneath the sea, making exploitation diffi-
cult, accessible fields exist where volcanic activity has been intensive enough to
build islands and also where active plate boundaries transect continents. High-
temperature geothermal fields are scattered quite regularly along the boundaries.
A spectacular example of this is the ‘ring of fire’ that borders the Pacific Ocean
(the Pacific Plate). Intense volcanism and geothermal activity associated with this
fault ring is to be found in Alaska, California, Mexico, Central America, the An-
des mountain range, New Zealand, Indonesia, Philippines, Japan, Kamchatka, and
the Aleutian Islands. Other examples are Iceland, which is the largest island on the
Mid-Atlantic boundary of the North American and Eurasian plates, and the East
African Rift Valley with impressive volcanoes and geothermal resources in, for
example, Djibouti, Ethiopia and Kenya.
A source of geothermal energy that is not related to the heat at the Earth’s core
has recently been uncovered in Switzerland and Australia [44]. In South Australia
oil and gas companies prospecting in the deserts there have uncovered massive
sources of heat just 4
km below the surface. This heat resides in granite strata and
is generated by the natural radioactivity in the rock. The heat is trapped there by
the sedimentary blanket, which extends for 4
km up to the surface. However, the
exploitative potential of such sources remains to be assessed.
76 3 Limits to Renewability
How the Power Is Extracted
Electricity generation stations employing geothermal techniques comprise rela-
tively conventional steam turbines, as used in coal fired power stations, and these
act as prime movers for synchronous generators. The basic process involves
pumping high pressure water down a borehole in the rock into the heat zone some
two or three kilometres below the surface. The water travels through fractures in
the rock, capturing the heat of the rock, raising its temperature to about 150°C,
until it is forced out of a second borehole as very hot water, which becomes steam
as it reaches the surface. The energy in the steam is converted into electricity using
a steam turbine. In lower temperature wells a secondary fluid, usually organic,
with a low boiling point and high vapour pressure, is used and conversion to elec-
tricity occurs in a, so called, binary power plant (Fig. 3.9). In the pressurised water
system the exhaust steam from the turbine passes to a condenser and cooling
tower, and the cooled water is injected back into the ground to repeat the heating
and cooling cycle. Conversion efficiencies are comparable with those of coal-fired
power stations and power outputs to the grid from a single power station are typi-
cally in the range 20–50
MW.
Fig. 3.9 Geothermal
power extraction employ-
ing the binary operating
principle
Potential as a Source of ‘Green’ Energy
In global terms the contribution of geothermal sources to electrical power genera-
tion is quite small at just over 9
GW in 2005. Where local conditions are favour-
able it is clear that electricity generated from geothermal sources is an attractive
option, and capacity could, with proper encouragement, be increased fifteen-fold.
3.8 The End of an Illusion 77
However, the evidence emanating from authoritative reports [45] on renewable
energy, is that few plans are in place in 2008 to significantly increase electricity
generation capacity by this means, and consequently we can rule it out as a sig-
nificant contributor to global power requirements by 2030.
3.8 The End of an Illusion
One does not have to delve too deeply into the seemingly vast output of the green-
wash industry, to find overly optimistic statements, bordering on ‘flights of fancy’,
about the potential of renewables to satisfy all of mankind’s energy needs. On the
basis of the claims of advertising copy alone, the switch from our fossil fuel past,
to a renewable power future, could happen painlessly, and now, apparently!
In both its written and electronic form, and in the guise of consultancy reports,
magazine articles, press comment, energy industry websites, green websites, or
other material, statements such as ‘our energy requirements can be satisfied by
covering just 1% of the worlds deserts with solar power collectors’ are not un-
common. For example in a UK quality Sunday newspaper, The Observer
(2/12/07), in an article on ‘How Africa’s desert sun can bring Europe power’ the
following super optimistic statement is made: ‘Scientists estimate that sunlight
could provide 10,000 times the amount of energy needed to fulfil mankind’s cur-
rent energy needs’. It at least qualifies this by saying: ‘Transforming that solar
radiation into a form to be exploited by humanity is difficult however’.
So how much power can renewables really provide to a rapidly growing popu-
lation of increasingly energy-hungry human beings? In previous sections of this
chapter, we have looked at each of the primary renewable resources in turn to
assess their potential contribution by 2030 and beyond. In so doing it has been
possible to show, by first assessing the magnitude of the resource as predicted by
fundamental physics, followed by efficiency calculations on the collected power
as it is subsequently processed through various stages of electricity production –
turbines, generators, up-conversion transformers, transmission over the grid,
down-conversion transformers and distribution to consumers – that, despite the
‘hype’, the power available to users is by no means limitless. ‘Firm’ estimates for
ultimate electrical power levels, which can be extracted from realistically accessi-
ble renewable sources, are summarised in Table 3.1 (see the column labelled
(2050+)). These estimates are of an accuracy that an engineer would describe as
being of ‘ball-park’ reliability, since they are based mainly on engineering evalua-
tions of the science and technology, but with some geographical and geological
guesstimates thrown in.
The following observations are apposite:
Hydro: Hydro-electric schemes represent a mature renewable energy resource,
and in the Western industrialised nations most of the viable sites for reservoirs and
dams have been commandeered. Growth is occurring mainly in the new industrial
nations of Asia, in particular China and India. It is difficult to assess to what extent
78 3 Limits to Renewability
mankind will exploit sites that in the past might have been considered to be too
difficult, too controversial, and too expensive, once fossil fuel derived energy is in
very short supply. My guess is that about 2
TW, almost three times the 2008 level,
is the best that could be achieved in the long term. This is of the order of 13.4% of
the power (15
TW) currently consumed by mankind.
Wind: Given the extent to which land is already being commandeered by the
human population, it is estimated (Sect. 3.3) that using currently available tech-
nology, an area of land and shore, about equal to the land area of Mexico, but
spread across the globe, could possibly be identified for coverage by wind farms,
if the desire for energy becomes sufficiently desperate. This results in the figure
of 7.5
TW of power to the consumer from wind, after all loss mechanisms have
been factored into the calculation. It is difficult to see how more could be ex-
tracted from wind in the long term, if we assume that the human population will
continue to grow, and will require to maintain, at least at present levels, other
forms of land usage. The figure is equivalent to 50% of current (2008) demand –
a very significant contribution from wind – but it is predicated upon solving the
variability issues.
Wave: Wave power will contribute only a tiny fraction (0.14%) of man’s en-
ergy needs even in the very long term. Despite the fact that the power in the waves
is vast, little is available for exploitation, unless we learn to extract it in the deep
ocean. With current technology we are limited to shore based, or close to shore,
collection schemes. In addition global coastlines that offer good waves in sites that
are not unfeasibly hostile are estimated to be no more than 5000
km in extent.
Even if all of this coastline were optimally employed as wave farms, the most that
we can possibly harvest is about 22
GW.
Tidal: The gravitational physics governing tidal movements indicate that the po-
tential energy built into the ‘pull’ of the sun and moon on the seas and oceans of the
globe, while large (equivalent to about 130 Aswan dams), is quite limited by com-
parison with hydro, wind and solar resources. Like wave activity it is also very
Table 3.1 Installed renewable power at global level: by 2030 and long term
Resource Installed power at the
point of consumption by
2030
(TW)
Available power at the
point of consumption
(TW)
(2050+)
Hydro 0.8400 ~02.000
Wind 0.4300 ~07.500
Wave 0.0003 ~00.022
Tidal 0.0001 ~00.200
Solar 0.0600 ~04.500
Geothermal 0.0090 ~00.140
Nuclear 0.8000 ~01.800
Total 2.1400 ~16.200
Fraction [5] of
(projected demand)
8.9% (~
24
TW) ~54.0% (~
30
TW)
3.8 The End of an Illusion 79
difficult to access. Suitable sites for barrage and tidal stream methods of tapping
into the tides are scarce, and calculations suggest that, at best, 0.2
TW of electrical
power could be extracted for tidal resources. This is 1.3% of current demand.
Solar: Using basic geometry and the known radiant power of the sun it is pos-
sible to establish a figure for the radiant power density striking the Earth’s disc.
This quantity is termed the solar constant and is currently estimated to be
1367
W/m
2
. From this the solar power density at the Earth’s surface can be com-
puted and is generally quoted as having a mean value of 170
W/m
2
. Used unwisely
this statistic can generate hugely over-optimistic estimates of exploitable solar
power levels. This is because, when delivery to the consumer is the criterion, and
conversion, generation, transforming, transmission and distribution inefficiencies
are factored into calculations, a figure of 4.5
W/m
2
is obtained for the watts per
square metre of land that can be extracted from solar radiation with currently
available technology. The most effective locations for solar farms are hot, arid
deserts, but even these locations have other uses and are not devoid of ecological
importance. Land area available for massive solar farms is not ‘unlimited’ and
reasoned deliberation suggests that an upper limit of 4.5
TW of electrical power is
available from solar sources. In the long term, therefore, about 15% of global
demand (30
TW [5]) could be met from solar power stations and other solar gath-
ering activities.
Geothermal: As with wave and tidal power, geothermal power represents a use-
ful but small resource in global terms. Reliable estimates suggest that output from
this resource, with current levels of technology, could over time possibly reach
15 times the power being delivered in 2005, which gives a ball-park prediction for
geothermal power of 140
GW. Consequently, geothermal sources could potentially
add 0.6% of demand to the renewables ‘mix’ in the long term.
Nuclear: Figures for nuclear power generation have been included in the table
for completeness, although nuclear fission is not strictly renewable. The issue of
nuclear power is considered in more detail in Chap. 4, where it is deemed to pro-
vide a valuable contribution to base load for a global electricity supply system.
On the basis that an unforeseen technological break-through in extracting
electrical power from renewable resources, such as nuclear fusion, is not on the
horizon, and that present methods will not advance much beyond current levels
of sophistication, the engineering evidence strongly suggests that electrical power
generated from all renewable sources, backed up by nuclear power, will, in the
long term (beyond 2070), probably plateau at a level that equates to about 50%
of a potential demand of ~
30
TW beyond 2050, if BAU were foolishly pursued
this far into the century. It is presumed that human population will plateau at
10.5 billion towards the end of the century, and that mankind continues to be in
thrall to an energy profligate, consumption driven, global economic system. To
improve on the 16
TW figure (Table 3.1) would either take a step-function
change in technological expertise and engineering prowess, particularly with
regard to operating in hostile marine environments, or an unlikely acceptance by
human societies of a visual pollution and environmental degradation levels, asso-
ciated with covering vast areas of land and sea with wind, wave and solar farms,
80 3 Limits to Renewability
far beyond today’s acceptable boundaries. In my long experience, major techni-
cal advances generally take about 20–30 years to move from an idea to full prac-
tical implementation. Consequently, if it turns out that human beings have not
been smart enough to give up their addiction to the energy guzzling luxuries and
trappings that fossil fuels obviously provide, then the above figure implies that
once the coal mines, oil wells, and gas wells are exhausted, mankind will be
forced to adjust to a severe drop in power supply. Of course, on this scenario
they will, in addition, have to exist in a much degraded biosphere and with all
that that may mean!
In the shorter term, the available evidence of progress for the uncoordinated
market led, essentially BAU approach to the transition from a fossil fuel driven
economy to one based on renewable resources, which is currently being pursued,
is not encouraging when viewed from an engineering perspective. The reality, as
we have seen in this chapter, is that by 2030, the change-over process will have
hardly advanced at all. As the middle column in Table 3.1 shows, very little of
mankind’s power requirements will be met from renewables by 2030 if we con-
tinue as we are doing. The conclusion has to be that in twenty or so years, electri-
cal power from sustainable resources will total just 9% of likely demand, which by
then is estimated to be about 24
TW [5]. In other words we will barely have
reached a level that would at least see the total replacement of the fossil fuels used
for present levels of electricity generation, with renewable resources. (In the in-
dustrialised nations electricity generation represents about 10% of total energy
usage.) It seems clear that the currently popular, technology led, incoherent market
driven approach to countering the global warming threat is going to fall far short
of its supposed goal; namely, that by 2030 the predicted 2°C rise in mean global
temperature above pre-industrial levels, should be averted. The science commu-
nity, as we have observed in Chap. 1, looks upon 2°C as a critical ‘tipping point’,
and it is a signpost that mankind would be incredibly foolish to ignore.
So is there a solution, given that the accepted scientific wisdom is calling for
the threat to be addressed, and given that the market driven techno-fixes are likely
to be ‘found wanting’? This issue will be considered further in Chap. 5, but before
that can be done, it is necessary to address the problem of energy storage, which
will be of critical importance in a world reliant on intermittent renewables.
A.J. Sangster, Energy for a Warming World,
© Springer 2010
81
Chapter 4
Intermittency Buffers
Engineering is the science of economy, of conserving the energy, kinetic and potential,
provided and stored up by nature for the use of man. It is the business of engineering to
utilize this energy to the best advantage, so that there may be the least possible waste.
William A. Smith
It doesn’t matter whether you can or cannot achieve high temperature superconductivity
or fuel cells, they will always be on the list because if you could achieve them they would
be extremely valuable.
Martin Fleischmann
4.1 Energy Storage
Products that use tiny amounts of electrical power, supplied from energy stored in
batteries, such as radios, hand-held phones, laptop computers, watches, toys, etc.,
are commonplace, but as consumers and users will know well, this is a very ex-
pensive way to energise electrical gadgets. In fact cost effectively harnessing and
storing electrical power remains a major challenge to science, particularly when
very large quantities of electrical energy are involved [1]. Current generation and
transmission policy means that to all intents and purposes electricity has to be used
while it is being generated. When the power station generators cease to spin, for
any reason, the grid wires linking them to consumers become ‘dead’. In an elec-
tricity system based entirely on renewable resources this could happen frequently
unless back-up power from alternative sources or from massive storage systems
are available. In general, as we have seen in Chap. 3, power or energy flow from
a renewable resource is not constantly available, but depends on weather condi-
tions, or time of day, or season. Furthermore energy demand by human societies is
also by no means invariant. It depends on the same phenomena but largely in re-
verse. So there needs to be a mediating technology between the source and the
82 4 Intermittency Buffers
consumer. This technology is energy storage which, in one way or another, actu-
ally plays a role in all natural and man-made processes.
Storing energy in any form other than solid, liquid or gaseous fossil fuels, is
a very expensive undertaking. This is because of the high capital costs of building
massive storage facilities for the alternatives, which generally store energy in
much lower densities. In fact a significant consequence of moving towards re-
newables will be that consumers will increasingly become aware that they are
paying for the capacity of the particular energy storage and supply system and not
for the energy itself. Their bills will increasingly become related to the size of the
system built to serve their demands, rather than being related to the amount of
energy they consume. In general, vast storage facilities are likely to be an integral
part of power supply systems geared to exploiting renewable resources. These
Massive Energy Storage (MES) systems are the critical technology needed by a
renewable power generation system if it is to become a major source of readily
accessible base load power, and hence eventually replace fossil/nuclear power
plants. For system stability and load levelling, stored energy banks capable of
releasing many megawatts of power quickly, and of providing this power over
many hours, are needed to convert the intermittent and fluctuating renewable
power, into electricity on demand. Without sufficient MES accessible at all times,
solar/wind/wave power cannot serve as a stable base load supply; it can only
piggyback onto base load fossil/nuclear generators as a small incremental sup-
plier. That there is a need for MES is self evidently largely absent from public
discussion of strategies for the development of renewable power. The prevailing
public view, where it exists, is that renewable power can probably replace fos-
sil/nuclear generating stations, if enough wind farms, wave farms, and solar gen-
erators are built. All attention, on support for research and development, is short-
sightedly focused on improving the cost and performance of wind/wave/solar
electricity generators. MES is not even recognised as a top priority critical tech-
nology deserving equally sustained attention and support if a ‘leap’ to renewables
is to have any chance of being successful.
In this chapter we will consider and assess the practicability of several large
scale storage systems, from pump storage commonly associated with hydroelectric
schemes, through compressed air, flywheels, thermal storage, batteries, hydrogen,
capacitors and superconducting magnets.
4.2 Pump Storage
Storage Principle
Pump storage is in essence a system for enhancing the operation of hydro-electric
power plants, by assisting nature in refilling the reservoir. In particular, it is ap-
plicable to those schemes that operate with more than one reservoir. In these
4.2 Pump Storage 83
circumstances, it becomes possible, at periods when demand for power from the
grid is low, to use excess generation capacity to move water from a lower reser-
voir to a higher one, for future use when demand is high. Water is then released
back into the lower reservoir through a turbine, generating electricity in exactly
the same way as for a conventional hydro-electric power station. A system of this
description was first used in Italy and Switzerland in the 1890s. Now, there is a
large number of pumped storage systems in operation worldwide producing over
90
GW of power to the grid. This is about 3% of current global electrical genera-
tion capacity. More specifically in Europe, in 1999, a total of 188
GW of hydro-
power capability was in existence, with 32
GW of it emanating from pumped
storage, mainly in Scandinavia. At that time this represented 5.5% of total Euro-
pean electrical capacity.
Pumped storage hydro-electric systems, like their conventional counterparts,
use the potential energy possessed by water when it is raised against the force of
gravity, the primary difference being that mechanical intervention is employed to
elevate the water. As we have already noted in Sect. 3.2, the potential energy den-
sity in stored water is very low and therefore it requires either a very large body of
water or a large variation in height to achieve substantial storage capacity. For
example, in the Cruachan system in the west of Scotland, water is pumped from
Loch Awe to the upper reservoir below Ben Cruachan, 360
m above, during peri-
ods of low consumer demand (such as at night). A 316
m long dam forms the
upper reservoir, which contains about 13
×
10
6
m
3
of water. Additionally the upper
reservoir collects substantial amounts of rainwater. Tunnels have been built
through Ben Cruachan to catch rain coming from all sides of the mountain.
Around 10% of the energy from the station is generated from rainwater, the rest is
from the water pumped up from Loch Awe. The above statistics suggest that the
potential energy contained in the upper reservoir is of the order of 46,000
GJ.
Operating at full capacity, the 440
MW Cruachan hydro-electric power plant
would deplete the upper reservoir in 22 hours, although the power station is re-
quired to keep a 12 hour emergency supply. Replenishing the reservoir through
pumping, with the generators acting as motors and the turbines as pumps, involves
the raising of 6
×
10
6
m
3
of water from Loch Awe, 360
m below. This represents an
energy input of 21,000
GJ. Assuming 400
MW of power is available in pumping
mode, it will take about 14.6 hours to do this. However, since system efficiency is
at best about 75%, we will actually require 530
MW to be supplied from the grid
to complete the task. In the case of the Cruachan system, this means essentially
from the nearby Hunterston nuclear power station. Of course, this is a worst case
scenario. In the rain sodden west of Scotland, water hardly ever stops streaming
off the hills and bens, and reservoir replenishment is also occurring naturally. If
we follow through the full pumping/power-delivery cycle, from the power re-
quired to replenish the stored energy (75% efficient), to the depletion of this en-
ergy in supplying consumers (70% efficient), almost 50% of the power generated
disappears in electrical system losses. Even so, the economics of large scale elec-
tricity generation has determined that rapid and ready access to hydro-electric
power justifies this seemingly high level of wastage.
84 4 Intermittency Buffers
Technology Required
Reversible turbine/generator assemblies acting as pump and motor first became
available in the 1930s. These turbines can operate as both turbine-generators and
in reverse as electric motor driven pumps. Of course, considerable advances have
been made over the last half century, and the latest developments in large scale
turbine technology are variable speed machines, which promise much greater
efficiency. Importantly, these machines facilitate electricity generation in syn-
chronisation with the grid frequency of 50/60
Hz, yet can operate asynchronously
(independent of the network frequency) as motor-pumps. They are usually of
a design described as a Francis turbine, which functions using the reaction princi-
ple of operation. This makes it amenable to operation as both a pump and a tur-
bine. It is not unlike the Kaplin turbine described in Sect. 3.2.
Potential for Providing Intermittency Correction
Like conventional hydro-electric schemes, pumped storage plants are character-
ised by long construction times and high capital expenditure. Nevertheless,
pumped storage is the most widespread, large scale, energy storage system cur-
rently in use on power networks. Its main applications are for energy management,
smoothing variable demand and provision of reserve. But in addition, these sys-
tems help to control electrical network frequency. Thermal and nuclear plants are
poor at responding to sudden changes in electrical demand, potentially causing
frequency and voltage instability on the grid. Pumped storage plants, like other
hydro-electric plants, can respond to load changes within seconds thus helping to
reduce the problems caused by short term variations in demand. Pump storage
systems can be found which range in scale from the compact to the very large with
discharge times varying from several hours to a few days. The critical factor influ-
encing the slow development of such schemes is high capital costs and the dwin-
dling existence of sites providing appropriate geography and geology.
Although 50% of generated power can be lost in pumping and power delivery,
pump storage is considered to be an acceptable use of electrical power because it
flattens out load variations on the grid, permitting thermal power stations such as
coal-fired plants and nuclear power plants that provide base-load electricity to
continue operating at peak efficiency, while reducing the need for ‘peaking’ power
plants that use costly fuels. Today, however, with current knowledge of the eco-
logical harm being caused by the burning of fossil fuels, the economic argument
for pumping using thermal plants becomes much more difficult to sustain. In fu-
ture, when all of our energy is derived from renewables, pumped storage, and
other methods of energy storage will become the primary source of electrical
power continuously being ‘topped up’ by renewable power stations, thus negating
the fluctuating output of these intrinsically intermittent power sources. The storage
4.3 Compressed Air 85
system will absorb load at times of high output and low demand, while providing
additional peak capacity. A high percentage of renewable power, without a paral-
lel MES system, could result in electricity prices dropping to close to zero, or even
occasionally going negative, as happened in Ontario in early September, 2006.
More power was being generated (some of it from wind) than there was load
available to absorb it. At present this sort of event is rarely due to wind alone, but
as the proportion of our electrical power from renewables grows, the frequency of
such occurrences is likely to increase, unless a mediating electricity storage sys-
tem exists to absorb excesses.
The question is then – how can pump storage advance the transition to renew-
ables? It could be said that this is possibly happening already, since this technol-
ogy is clearly extending the reach of hydro-electric power. However, in relation
to other renewable resources pump storage is actually a rather inflexible technol-
ogy since it is very dependent on geology. All of the best sites for its implemen-
tation have already been commandeered. Nevertheless pump storage formats,
which would in earlier times have been viewed as impractical and uneconomic,
are now being looked at with renewed interest. One of these is underground
pumped storage, using flooded mine shafts or other underground cavities. The
arrangement has been shown to be technically possible and is being pursued
quite actively in several parts of the world. The open sea can also be used as the
lower reservoir in a pumped hydro-system. The first seawater pumped hydro
plant, with a capacity of 30
MW, was built in Japan, at Yanbaru, in 1999, and
other schemes are being planned. Additionally pump storage has been proposed
as one possible means of balancing power fluctuations from very large scale
photovoltaic and CSP generation [2]. On a European scale it is suggested that
through the agency of high voltage direct current (HVDC) transmission, it would
be economic to recharge pump storage facilities in Scandinavia from excess solar
power generated in North Africa.
4.3 Compressed Air
Storage Principle
Air is an elastic medium, and when compressed it stores potential energy. Re-
leased air, if expanded in a controlled manner, can be used to power a gas turbine,
and consequently the use of compressed air energy storage (CAES) for power
utilities has been under consideration for a very long time. Such a system, employ-
ing an underground cavern to store the air was patented by Stal Laval in 1949.
Since then two operational plants have been completed and commissioned – one
in Germany (Huntorf CAES) [3,
4] and another much more recently in the USA
(McIntosh CAES) [5].