oracle Applications DBA Field Guide phần 6 ppt
Bạn đang xem bản rút gọn của tài liệu. Xem và tải ngay bản đầy đủ của tài liệu tại đây (405.78 KB, 27 trang )
ExpiresByType application/x-javascript "access plus 1 year"
ExpiresByType text/javascript "access plus 1 year"
</Directory>
#
# enable caching for OA_MEDIA
#
<Directory substitute_path_to_OA_MEDIA>
ExpiresActive On
ExpiresByType image/gif "access plus 1 month"
ExpiresByType image/jpeg "access plus 1 month"
</Directory>
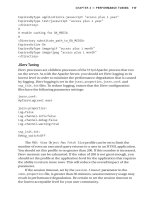
JServ Tuning
JServ processes are children processes of the httpd Apache process that run
on the server. As with the Apache Server, you should set JServ logging to its
lowest level in order to minimize the performance degradation that is caused
by logging. JServ logging is set in the jserv.properties, jserv.conf, and
ssp_init.txt files. To reduce logging, ensure that the JServ configuration
files have the following parameter settings:
jserv.conf:
ApJServLogLevel warn
jserv.properties:
Log=false
Log.channel.info=false
Log.channel.debug=false
Log.channel.warning=true
ssp_init.txt:
Debug_switch=OFF
The FND: View Object Max Fetch Size profile can be set to limit the
number of rows an executed query returns to a user in an HTML application.
You should set this profile to no greater than 200. If this number is increased,
JServ memory can be exhausted. If the value of 200 is not great enough, you
should set the profile at the application level for the application that requires
the ability to return more rows. This will reduce the overall impact of the
parameter.
If the session timeout, set by the session.timeout parameter in the
zone.properties file, is greater than 30 minutes, session memory usage may
result in performance degradation. Be certain to set the session timeout to
the lowest acceptable level for your user community.
CHAPTER 4 ■ PERFORMANCE TUNING 117
6447CH04.qxd 3/6/06 4:57 PM Page 117
This brings us to an integral tuning step for JServ tuning: evaluating the
heap memory settings for the JServs in the jserv.properties file. Additional
details on monitoring the JVM heap size with the AM Pool Monitor are out-
lined in Chapter 3 of this guide. Improperly tuned memory settings may
result in performance problems with web-based applications. If JServ log
files or browser sessions report an “out of memory” error, the JVM most likely
has hit a memory limitation. If this occurs, you should increase the JVM heap
size parameter in the jserv.properties file as follows:
wrapper.bin.parameters=-mx<new_size>m
Another parameter that can be tuned to assist JVM performance is one
that controls the automatic reloading of new classes. This feature allows new
classes to be used without requiring a restart of the JServ. Turning off this
feature will increase performance because the JServs will no longer check for
modifications. By default, the autoreload.classes parameter is set to true.
To disable this feature, edit the zone.properties file as follows:
autoreload.classes=false
At times it is necessary to bounce the Apache Server and delete the
cache. This may result in performance degradation while the cache is being
rebuilt. Upon Apache startup, you can cache frequently used classes by set-
ting the following parameter in the zone.properties file:
servlets.startup=oracle.apps.fnd.framework.OAStartupServlet
JDK releases typically include performance enhancements; therefore,
as with other components of the applications tier, upgrading to the latest
version of JDK available will help the performance of your Java servlets.
■Tip After modifying and testing changes to the configuration files, you should update
the context file with the new values so the changes remain permanent for subsequent
executions of adconfig.
Concurrent Manager Tuning
Performance problems on the applications tier may also arise from con-
tention with resource-intensive Concurrent Manager jobs. The solution for
this issue could result in implementing architecture changes, performing
regular maintenance on the Concurrent Manager tables, or tuning jobs.
CHAPTER 4 ■ PERFORMANCE TUNING118
6447CH04.qxd 3/6/06 4:57 PM Page 118
As part of an overall strategy for concurrent processing, multiple
Concurrent Managers should be defined to handle long running and short
running requests. It may also be necessary to define module-specific Con-
current Managers—for example, a long running Concurrent Manager for GL
and a long running Concurrent Manager for AP. Much of this is dependent
upon the scheduling requirements for your site.
The Oracle E-Business Suite’s predefined Concurrent Manager is called
the Standard Manager. The Standard Manager should be reserved for stan-
dard Oracle requests. In order to support a large volume of concurrent
requests, it may also be necessary to implement Parallel Concurrent Process-
ing by load balancing concurrent requests across multiple nodes.
■Tip Schedule as many Concurrent Manager processes as possible during non-peak
hours to reduce contention with the daily business processing.
Concurrent Manager performance problems could also result from not
purging concurrent request history on a regular basis. Detailed information
regarding purging this history is outlined in Chapter 6 of this guide. One
symptom of this problem would be a low buffer cache hit ratio in the Statspack
report. Keep a minimal amount of Concurrent Manager data in the system.
Oracle recommends setting the purge to keep no more than 30 days worth of
data online. If your environment generates an excessive amount of concur-
rent activity, you may consider limiting the history to less than 30 days. The
requirements for retaining Concurrent Manager output are environment
specific.
If performance problems are related to one particular job, focus on tun-
ing that job. For Oracle-seeded jobs, you should consider opening an SR. If
statistics are up to date on the objects being queried by the job, the problem
may be a known bug with the concurrent request. Oracle Support should be
able to provide guidance for resolving the issue.
If performance problems are associated with a custom job, the Applica-
tions DBA and development team should work to tune the job. The user
trace and SQL tuning information presented later in this chapter can assist
with that tuning effort. A custom Concurrent Manager may be required to
processes certain jobs. MetaLink Note 170524.1 provides details for creating
a custom Concurrent Manager.
If performance problems are associated with one particular manager,
and there appears to be high CPU consumption on the Concurrent Process-
ing Node, the ICM Sleep Time may be set to a value too low for your system.
MetaLink Note 178925.1 describes the process of altering the ICM Sleep Time
setting.
CHAPTER 4 ■ PERFORMANCE TUNING 119
6447CH04.qxd 3/6/06 4:57 PM Page 119
User Tuning
Inadequate resources on the workstation often cause performance degrada-
tion on the client. You should review client recommendations for the version
of the application that is running in your company.
Using the Client System Analyzer
If you are running 11.5.10 or OAM.H rollup 1, performance issues on the
client can be diagnosed using the Client System Analyzer tool provided by
Oracle. The Client System Analyzer is executed from any form by going to the
Help ➤ Diagnostics Menu ➤ Client System Analyzer. After selecting these
menu options, the Client System Analyzer applet and a compatible Java Vir-
tual Machine (JVM) will be downloaded.
This tool will collect CPU, memory, operating system, and other relevant
workstation information. To view the results of the analysis, click the View
Results button. The Client System Analyzer is displayed in Figure 4-8.
Figure 4-8. Client System Analyzer
Manually Analyzing the Client
If the Client System Analyzer is unavailable for your use, many of the steps
can be performed manually.
CHAPTER 4 ■ PERFORMANCE TUNING120
6447CH04.qxd 3/6/06 4:57 PM Page 120
Some of the key areas where client systems may encounter resource
constraints are memory and CPU usage, and data on this usage can be
obtained for the client using Windows Task Manager. Pressing the Ctrl, Alt,
and Del keys simultaneously will initiate the Windows Task Manager. Select
the Performance tab to display CPU Usage and Memory Usage charts, as
shown in Figure 4-9.
Figure 4-9. The Performance tab of Windows Task Manager
If either chart shows excessive usage, select the Processes tab to view
running processes. This display can be sorted by the CPU or Mem Usage
columns in order to identify resource-intensive processes. For example, this
investigation could show a virus scanning utility consuming high amounts of
CPU that results in client-level performance problems running Oracle Appli-
cation Forms.
Trace Files
Generating and analyzing trace files is an important step of the performance
tuning process. Analyzing trace files is the only way the Applications DBA
and development staff can see what is being executed via the application in
the database. Also, generating trace files is typically a requirement when pro-
viding feedback to Oracle Support.
CHAPTER 4 ■ PERFORMANCE TUNING 121
6447CH04.qxd 3/6/06 4:57 PM Page 121
Generating Trace Files
Trace files can be generated for any process that is executed in the applica-
tion. Trace files are useful in generating explain plans for all queries that are
executed, and explain plans can identify problem queries and assist Oracle
Development in providing fixes to application code.
A raw trace file can be generated for either a Forms or Self Service appli-
cation, as outlined in the following two sections. After tracing has been set
up, reproduce the steps in the application where the performance degrada-
tion is being experienced. This will capture pertinent information in the
trace file that will assist in determining the cause of the performance issues.
Be certain to turn tracing off after the trace file has been generated.
■Note Generated trace files are located in the directory specified by the
user_dump_dest database initialization parameter. For more information regarding this
parameter, see Chapter 2 of this guide.
Forms Trace Files
To generate a trace file for a Form, be sure to have the profile options
Utilities: Diagnostics set to Yes and Hide Diagnostics Menu Entry set to
No. Log on to the application, and select the Help ➤ Diagnostic ➤ Trace ➤
Trace with Binds and Waits menu option. After this, you should set the trace
size to unlimited by selecting the following menu option: Help ➤ Diagnostics
➤ Trace ➤ Unlimited Trace File Size. The resulting trace file will be written to
the udump directory located on the Database Node.
Self Service Trace Files
Self Service Tracing can be implemented by navigating to Security ➤ Profile
➤ User. Enter the user name. Query the profile FND: Diagnostics. Set FND:
Diagnostics to Yes. Log in to the application as the user for which the diag-
nostics profile was set. Click the diagnostics icon, select Set Trace Level, and
click Go. On the next page, select Trace with Binds and Waits, and click Save.
Perform the steps required to duplicate the problem. When this has
been completed, there will be a trace file generated. This file can be located
and analyzed using the techniques explained in the next section.
Analyzing Trace Files
Once the raw trace file has been generated, execute the tkprof or trcanlzr
utilities to translate it into a readable format. Descriptions for using these
utilities are provided in the following sections.
CHAPTER 4 ■ PERFORMANCE TUNING122
6447CH04.qxd 3/6/06 4:57 PM Page 122
Using tkprof
In order to run tkprof on the raw trace file, obtain the name of the generated
trace file. Note that tkprof may only be executed in the database from which
the trace file was originally generated. Execute tkprof as the instance owner
in a directory with write permissions as follows:
$tkprof <raw trace file name> <output filename> \
explain=apps/<apps password>
The file generated by tkprof will contain important information regard-
ing the SQL statement, as well as diagnostics that include CPU and elapsed
time, disk and logical reads, and the number of rows returned in the query,
as well as the SQL execution plan. Most likely, this file will need to be uploaded
to Oracle Support for assistance in resolving the underlying performance
issue.
The following is an example of output generated by executing tkprof:
SELECT USER_NAME
FROM FND_USER
WHERE USER_ID = :B1
call count cpu elapsed disk query current rows
Parse 1 0.00 0.00 0 0 0 0
Execute 1 0.00 0.00 0 0 0 0
Fetch 1 0.00 0.00 0 3 0 1
total 3 0.00 0.00 0 3 0 1
Misses in library cache during parse: 1
Optimizer goal: CHOOSE
Parsing user id: 60 (recursive depth: 1)
Rows Row Source Operation
1 TABLE ACCESS BY INDEX ROWID FND_USER
CHAPTER 4 ■ PERFORMANCE TUNING 123
6447CH04.qxd 3/6/06 4:57 PM Page 123
■Tip Setting the _user_files_public database initialization parameter will set trace
file permissions such that users other than the instance owner can view the raw trace
file and generate tkprof analysis of it.
Using trcanlzr
The Trace Analyzer utility (trcanlzr) reads a raw trace and generates an
HTML report that includes tkprof analysis data as well as other statistics.
The HTML file that is generated can be used by Oracle Support to assist in
resolving performance issues.
To generate the HTML file, the trcanlzr utility must be downloaded
from Oracle Support. It is available by referencing MetaLink Note 224270.1.
Once the utility has been downloaded, you will need to install it by following
the instructions in the download.
Analyzing SQL Statements in Oracle10g
Oracle Database 10g provides some additional tools for analyzing SQL state-
ments beyond generating trace files. These tools may be used for tuning
custom code as well as identifying issues with Oracle-provided code.
SQL Tuning Advisor
Along with the automatic database analysis tools introduced in Oracle10g,
there is now an SQL Tuning Advisor (STA) whose purpose is to automate
the SQL tuning process. The STA will analyze SQL statements for areas of
improvement, looking for the same issues that the DBA would look for man-
ually. Problems such as stale statistics, poor execution paths, and poorly
structured SQL statements will be identified by the automatic analysis.
As with the other automatic analysis tools, Oracle recommends using
Enterprise Manager as the primary interface with the tool. However, it is still
possible to manually execute the tool using the DBMS_SQLTUNE package. To
manually use the STA to tune an SQL statement, use the CREATE_TUNING_TASK
function followed by the EXECUTE_TUNING_TASK function. When the tuning
task has been executed, a report can be generated. Here is an example:
sql>exec dbms_sqltune.create_tuning_task( -
>sql_text => 'select * from emp where emp_id=101', -
>user_name => 'SCOTT', -
>scope => 'COMPREHENSIVE', -
>time_limit => 60, -
>task_name => 'tune_emp', -
>description => 'Task to tune a query on the EMP table')
CHAPTER 4 ■ PERFORMANCE TUNING124
6447CH04.qxd 3/6/06 4:57 PM Page 124
sql>exec dbms_sqltune.execute_tuning_task (task_name => 'tune_emp')
sql>select dbms_sqltune.report_tuning_task('tune_emp') from dual;
The output of the tuning report may include recommendations such as
analyzing the emp table if the statistics are invalid.
SQL Access Advisor
While STA is useful for tuning individual SQL statements, there is often a
need to tune multiple queries. This tuning effort is possible through the use
of the SQL Access Advisor (SAA). The SAA tool will analyze multiple statements
and recommend the creation of objects such as indexes and materialized
views to improve the overall performance of the queries. The group of
queries to be tuned is called a SQL Tuning Set (STS).
Running SAA is a simple process if you use the Enterprise Manager.
To run SAA manually, you will need to perform the following steps:
1. Create AWR snapshots before and after the group of queries is executed.
Use the following command to generate each snapshot:
sql>exec dbms_workload_repository.create_snapshot()
2. After the beginning and ending snapshots are taken, create an STS using
the following command:
sql>exec dbms_sqltune.create_sqlset('sts1')
3. Load the queries into the STS created in step 2. The following example
limits the queries loaded into the STS to queries with relatively high disk
reads:
sql>declare
2 baseline_ref_cursor dbms_sqltune.sqlset_cursor;
3 begin
4 open baseline_ref_cursor for
5 select value(p) from table
6 (dbms_sqltune.select_workload_repository
7 (:snap_id_1, :snap_id_2, 'disk_reads > 100',
8 NULL, 'disk_reads')) p;
9 dbms_sqltune.load_sqlset('sts1', baseline_ref_cursor);
10 end;
11/
CHAPTER 4 ■ PERFORMANCE TUNING 125
6447CH04.qxd 3/6/06 4:57 PM Page 125
4. Create an SQL workload to hold the STS:
sql>exec dbms_advisor.create_sqlwkld('sts_wkld1')
sql>variable saved_queries number;
sql>variable failed_queries number;
sql>begin
2 dbms_advisor.import_sqlwkld_sts( 'sts_wkld1', 'sts1'
3 ,'NEW', 1,:saved_queries, :failed_queries);
4 end;
5 /
5. Create a tuning task for the SAA:
sql>variable task_id number;
sql>begin
2 dbms_advisor.create_task('SQL Access Advisor',
3 :task_id, 'sql_task1');
4 end;
5/
6. Associate the SQL workload with the tuning task created in step 5, and
execute the tuning task:
sql>exec dbms_advisor.add_sqlwkld_ref('sql_task1', 'sts_wkld1')
sql>exec dbms_advisor.execute_task('sql_task1')
7. Create a script of the recommendations from SAA. Before this can be
done, a directory needs to be created to store the script. This should be
done at the operating system level and then be added to DBA_DIRECTORIES.
sql>create directory saa_results as '/tmp/saa_results';
sql>exec dbms_advisor.create_file(dbms_advisor.get_task_script -
>( 'sql_task1' ), 'SAA_RESULTS', 'sts_script.sql')
The script created, /tmp/saa_results/sts_script.sql, can be executed
in a test environment to implement the SAA recommendations. Before
executing the script, however, the Applications DBA should review the rec-
ommendations. If the changes result in improvement, they can be promoted
to production.
CHAPTER 4 ■ PERFORMANCE TUNING126
6447CH04.qxd 3/6/06 4:57 PM Page 126
Additional Tuning Considerations
There are additional application profiles that may affect the performance of
the application. Some of these profiles affect the behavior of the application,
while others are diagnostic and logging settings. The profile options to
review are outlined in Table 4-13.
Table 4-13. Additional Profile Options to Consider for Performance Tuning
Recommended
Profile Value Description
ICX: Match case view checked or hidden This profile option controls
queries that would disable indexes
with the upper clause in an
advanced search. The default
value of unchecked allows for poor-
performing queries due to unused
indexes.
FND: Diagnostics No This profile option controls
whether users are able to turn on
global diagnostics.
FND: Debug Log Module % This profile may be used to set
logging for a specific application.
If FND: Debug Log Level is set to
STATEMENT, you must set this
profile to a specific module;
otherwise logging will cause severe
performance degradation.
FND: Debug Log Enabled Yes This profile can enable or disable
debug logging. When set in
conjunction with the FND: Debug
Log Level profile, this profile
controls whether information is
logged.
FND: Debug Log Level UNEXPECTED This profile will write errors that
occur in the application to the log
file. When set to UNEXPECTED, only
errors that require administrator
assistance to resolve will be
logged. Other values for this
profile include STATEMENT,
PROCEDURE, EVENT, EXCEPTION, and
ERROR. When set in conjunction
with the FND: Debug Log Enabled
profile, this profile controls the
amount of information that is
logged.
CHAPTER 4
■ PERFORMANCE TUNING 127
6447CH04.qxd 3/6/06 4:57 PM Page 127
Common Performance Issues
Performance issues are often a result of preventative maintenance tasks not
being performed. Key preventative maintenance tasks include generating
statistics and recompiling invalid objects. Make certain that all required pre-
ventative maintenance is properly executed. When in doubt, refresh the
database statistics. Chapter 6 of this guide contains additional information
on recommended preventative maintenance.
Frequently, performance issues are experienced when the user commu-
nity is using new functionality. It is imperative that new features be
performance tested before being turned on in production. Along with testing
new functionality, a stress test of the environment is necessary to ensure that
available resources are adequate. The Applications DBA should work with
the user community and development team to create a realistic stress test
using stress-test software.
It is impossible to gauge the impact of additional users and new func-
tionality on the production environment without a properly developed
stress-test plan. When monitoring the stress test, use Statspack or AWR to
identify potential problems. Also use database monitoring tools and operat-
ing system monitoring tools to determine whether memory and CPU
resources are adequate. Additional hardware may be needed to support the
required functionality.
Performance Tuning Best Practices
For overall application health, it is important to stay current with patches
and upgrades for the technology stack components. Often patches and later
versions of the technology stack include performance improvements, as well
as additional configuration options. The Applications DBA should monitor
and apply current releases for AD, FND, and the ATG Product Family. Oracle
provides MetaLink Note 244040.1, titled “Oracle E-Business Suite Recom-
mended Performance Patches,” and this note should be regularly reviewed
for recommended patches.
The Applications DBA should work with the user community to identify
commonly used modules. Document typical execution timings for the func-
tionality of all commonly used modules. These timings should be reviewed
and updated when patches specific to that module are applied to the appli-
cation. This level of documentation will provide a baseline of performance
expectations for the application.
As previously stated, stress testing is critical for the success of any appli-
cation. Stress tests provide an environment that will simulate production
and determine whether additional resources are necessary in order to meet
CHAPTER 4 ■ PERFORMANCE TUNING128
6447CH04.qxd 3/6/06 4:57 PM Page 128
business requirements. Stress tests should be implemented when upgrading,
applying patches that change the underlying technology stack components,
and implementing new functionality.
While resolving performance issues, it is often necessary to work with
Oracle Support and Development. When doing so, provide all applicable
reports (Statspack, AWR, and/or trace files) in addition to other statistics that
have been collected. Also provide a detailed description of the performance
degradation that is being experienced, including screen shots of the process
if applicable. All of this information will assist Oracle in resolving the issue.
Although rare, it may be necessary for Oracle to release a one-off perform-
ance patch for the issue being experienced. It is advisable to log an SR when
the performance issue is first experienced in order to expedite resolution
from Oracle if an underlying code change is required.
CHAPTER 4 ■ PERFORMANCE TUNING 129
6447CH04.qxd 3/6/06 4:57 PM Page 129
6447CH04.qxd 3/6/06 4:57 PM Page 130
Patching
One of the most important and time-consuming aspects of an Oracle
Applications DBA’s job is applying patches to the E-Business Suite. Patches
may be required to resolve problems with the application code, to fix pro-
duction issues, to install new features, or to upgrade components of the
technology stack. Patching is not a simple one-step process, but rather
requires careful research in order to determine all of the prerequisite steps,
patching steps, and post-patching steps required.
Oracle E-Business Suite patching can be divided into two categories:
• Oracle Applications patching: This includes all patching that changes
the underlying Oracle Applications code.
• Technology stack components patching: This includes all upgrades and
fixes for the Oracle Database software, JDK, Oracle Developer 6i (Oracle
Forms and Reports), Developer 6i Client library files, Oracle Discoverer,
JDBC, Oracle Java Server Page (OJSP), Oracle Application Server (iAS),
and iAS Client library files (Required Support Files or RSF).
The focus of this chapter will be on Oracle Applications patching, and a
brief overview of Oracle Database software patching will also be provided.
Patching the Applications Technology Stack will not be covered, as this type
of patching effort has numerous operating system dependencies.
CHAPTER 5
131
6447CH05.qxd 3/6/06 4:59 PM Page 131
Applications Patching
There are several steps involved in patching Oracle Applications. In this sec-
tion we’ll discuss each of these stages:
• Preparing to patch: Before patching, it is important to document the
requirements and determine what steps and patches are needed. This
section will explain how to document and manage the overall process of
applying patches, and discuss patch reporting, where you investigate
which version, if any, of a patch is currently installed.
• Applying patches: Applying a patch involves several steps, such as
unbundling the patch, enabling maintenance mode, applying the patch
with adpatch, and implementing manual steps. This section will discuss
each of the steps involved.
• Monitoring and resolving patching issues: Sometimes there are prob-
lems applying patches. This section will explain how to review log files
and use the AD Control utility to monitor patch worker processes.
• Post-patching steps and cleaning up: There are often steps that should
be performed after the patching is complete. This section will explain
how you can efficiently perform post-patching steps and clean up files
no longer required after patching.
Types of Application Patches
There are several different types of Oracle Applications patches. These are
the more common patches:
• One-off patch: This is the simplest type of patch. It is created to resolve a
specific bug.
• Minipack patch: This is a collection of one-off patches and enhance-
ments related to a particular module. Alphabetic characters denote the
Minipack version for the module; for example, the product code for the
Application DBA utilities is AD, and version Minipack I of this product
would be called AD.I.
• Family Pack patch: This is a collection of Minipack patches for a partic-
ular family group of application modules. Alphabetic characters denote
the Family Pack version; for example, the J version of the Human
Resources Suite Product Family would be HR_PF.J.
• Maintenance Pack patch: This is a collection of Family Packs that serves
as a point-level release upgrade; Oracle Applications Release 11.5.10 is
an example of a Maintenance Pack.
CHAPTER 5 ■ PATCHING132
6447CH05.qxd 3/6/06 4:59 PM Page 132
There are also other special types of patches:
• Consolidated patch: This is a collection of one-off fixes for a Family Pack
or Maintenance Pack; Oracle Applications 11.5.10 Consolidated Update
2 (CU2) is an example of a consolidated patch.
• Interoperability patch: This is a patch that is required for Oracle Appli-
cations to function with a newer version of a technology stack
component; for example, you would apply an interoperability patch
when upgrading the database to version 10g.
• NLS patch: This is a patch that updates language-specific information
for multi-language installations.
• Rollup patch: This is a collection of one-off patches that update code
levels for particular products.
• Legislative patch: This is a special patch for HR Payroll customers; it
contains legislative data for multiple countries.
As the patch group size increases from one-off patches to Maintenance
Packs, the complexity of the patch application process also increases. More
research is required for Family Packs than is required for a Minipack. Due to
the increased complexity, there is more planning required for Maintenance
Packs and Family Packs than other patches.
Preparing to Patch
Before applying a patch, carefully examine the readme file provided with the
patch. This document will list all steps required by the patch.
■Tip Before applying a patch, make certain that the readme file has been carefully
reviewed.
The readme file will contain prerequisites, installation steps, post-
installation steps, and other information vital to the successful installation
of the patch. The prerequisites may consist of other patches or manual steps.
Here is an example of the readme file contents:
README CONTENTS:
CHAPTER 5 ■ PATCHING 133
6447CH05.qxd 3/6/06 4:59 PM Page 133
A. Prerequisites
B. Best Practices
C. Installation Steps
D. Post-Installation Steps
E. HRGLOBAL - SPECIAL NOTES AND CHANGE HISTORY
F. Other Information Sources
A. PREREQUISITES:
Apply this patch if you have HR (Product code PER) fully installed.
Before applying this patch you must have each of these prerequisites:
1. Oracle Applications Server 11i
2. Oracle 11i.PER.G, patch 1988754, or later.
. . .
If prerequisites have not been met, you must add these steps or patches
to the overall process of applying the patch. Become familiar with all steps
required before attempting to apply the patch.
■Caution Removing a patch from Oracle Applications after it has been applied is not
usually a feasible option; therefore, a full system backup should be taken before apply-
ing patches to an instance.
Documenting the Patching Process
It is recommended that you maintain a spreadsheet detailing all prerequisite
steps, patching steps, and post-installation steps required for patch applica-
tion. By creating such a document, you can eliminate operator error, such as
missed steps or steps completed out of order.
The columns in the spreadsheet should be customized to match your
needs. These columns can include information about the node being
patched, details about the patch being applied, or the rationale for the patch.
At a minimum, it is useful to have columns for patch number, description,
CHAPTER 5 ■ PATCHING134
6447CH05.qxd 3/6/06 4:59 PM Page 134
and comments, but it is often also useful to include the actual time required
to complete each step based upon trial runs in a sandbox instance. Tracking
timings allows for an accurate prediction of production maintenance down-
time.
Figure 5-1 shows an example of a spreadsheet for patches required by
Project A that will require 6 hours and 25 minutes to apply.
Figure 5-1. Sample patch documentation spreadsheet
If timings are included for every step, the Applications DBA can generate
a schedule for applying the patches to production by using time functions in
the spreadsheet software. This corresponds to the Shift Start Time column in
Figure 5-1. This process is highly recommended for extended patching
efforts that will require multiple shifts. Otherwise, a simple summation of the
time required for each step should provide an accurate schedule. The times
required for applying patches is also tracked by adpatch and can be found in
the $APPL_TOP/admin/$CONTEXT_NAME.out/adt*.lst files.
■Tip When documenting the patching process for multiple patches, post-installation
steps like recompiling invalid objects, regenerating JAR files, and running the autoconfig
utility can be consolidated and executed at the end of the patching process. This helps to
streamline the patch process and reduce downtime.
CHAPTER 5 ■ PATCHING 135
6447CH05.qxd 3/6/06 4:59 PM Page 135
Patch Reporting
Patch reporting is used to determine whether or not a specific patch has
already been applied to the instance, or what version of a Family Pack or
Minipack is currently installed. The following sections will discuss four
methods for determining patching levels:
• Using the adphrept.sql script
• Executing the patchsets.sh utility
• Querying the database
• Using Oracle Application Manager (OAM)
Using adphrept.sql
The $AD_TOP/patch/115/sql/adphrept.sql file is an Oracle-provided script
for generating a patch report for an instance. This script provides an easily
searchable list of all patches that have been applied to an environment.
Keep in mind that the script can take a long time to execute.
Additional details regarding adphrept.sql and a description of all
parameters can be obtained by viewing MetaLink Note 162498.1. The para-
meters for adphrept.sql are shown in Table 5-1.
Table 5-1. adphrept.sql Parameters
Option Purpose
Query_depth 1—Lists details of patches only
2—Lists details of patches and their bug
fixes only
3—Lists details of patches, their bug fixes,
and bug actions
Bug_number Lists details for one bug number or ALL
Bug_product Lists details for one product or ALL
End_date_from
Lists start date for a date range or ALL
End_date_to Lists end date for a date range or ALL
Patchname
Lists details for a patch name or ALL
Patchtype Lists details for a patch type or ALL
Level
Lists details for a patch level or ALL
Language
Lists details for a language or ALL
Appltop Lists details for a specific APPL_TOP or ALL
Limit to forms server
Limits the list’s scope (Y/N)
Limit to web server Limits the list’s scope (Y/N)
CHAPTER 5 ■ PATCHING136
6447CH05.qxd 3/6/06 4:59 PM Page 136
Option Purpose
Limit to node server Limits the list’s scope (Y/N)
Limit to admin server Limits the list’s scope (Y/N)
Only patches that change db Limits the list’s scope (Y/N)
Report name Specifies the report name; it must end in
.txt or .htm
Typically, the report is executed with Query_depth set to 2 and all other
options set either as ALL or Y. This will yield the most useful report for pre-
requisite requirement searching. The query must be run by the apps user
account, like this:
$sqlplus apps/apps_password \
@adphrept.sql 2 ALL ALL ALL ALL ALL \
ALL ALL ALL ALL N N N N N patches.txt
■Tip As of Application Utility Minipack version I (AD.I), adphrept.sql no longer gener-
ates a text report, but rather an XML report is generated.
To search the report for a specific patch or bug, the following may be
executed against the generated file:
grep [patch or bug number] patches.txt
If the grep command returns results, the patch or bug fix has been
applied to the instance. For example, to test for existence of patch 3410000,
check whether the following command returns any data:
$grep 3410000 patches.txt
Using patchsets.sh
The Oracle-provided patch-comparison utility, patchsets.sh, is a handy tool
for reviewing patchset levels. Family Pack versions, fully installed products,
and shared installed products, along with the latest version available, are dis-
played in the output. Information about the latest version of this utility can
be reviewed in MetaLink Note 139684.1.
This utility is updated frequently by Oracle. Before running the script,
download the current version from the following FTP site: ftp://oracle-ftp.
oracle.com/apps/patchsets/PATCHSET_COMPARE_TOOL/patchsets.sh.
CHAPTER 5 ■ PATCHING 137
6447CH05.qxd 3/6/06 4:59 PM Page 137
The instance owner can use the tool by executing the following:
patchsets.sh connect=[userid]/[password]
Here’s an example:
$patchsets.sh connect=apps/apps_password
More details about the parameters available for this script can be found
by using the -h parameter for online help. Figure 5-2 shows an example of
the output of patchsets.sh from MetaLink Note 139684.1.
The output for the file will contain the following columns for each prod-
uct group:
• Baseline Version: Displays the version provided with the release.
• Running Version: Displays the current version installed for each
product.
• Latest Available, Status: Displays the current version available for the
product. The Status portion of the column consists of two parts: the
patchset status (Rel is short for released, Sup for superseded, and Obs
for obsoleted) and the distribution status (By_Metal indicates it is on
MetaLink, Not_Dist means it is not available, and By_Dev means it is
available from development only).
Review the output to find any products that have updates available.
Querying the Database for Patches
In order to determine whether a specific patch has been applied, a query can
be executed against the bug_number table. The following SQL will return
results if the patches included in the IN clause have been applied to the
instance:
SELECT bug_number
FROM ad_bugs
WHERE bug_number IN ('patch_number', 'patch_number', . . .)
ORDER BY bug_number DESC;
Using OAM
Oracle Application Manager (OAM) may also be used to query the instance
for applied patches.
CHAPTER 5 ■ PATCHING138
6447CH05.qxd 3/6/06 4:59 PM Page 138
Figure 5-2. Output from the patchsets.sh script
Patch Search In OAM, the Applied Patches functionality will allow searches
by Patch ID, Applied From Date, and Applied to Date. Once a search result is
returned, additional details regarding the patch can be displayed.
For example, the Simple Search screen for patches in OAM is shown in
Figure 5-3.
Figure 5-3. The OAM Simple Search screen
CHAPTER 5 ■ PATCHING 139
6447CH05.qxd 3/6/06 4:59 PM Page 139
The Advanced Search screen offers additional search criteria. Use this
screen if you need to search for certain product families, patches applied
only to certain nodes, or patches for different APPL_TOPs.
When a patch is returned to the result screen, you can select the Details
cell to see a patch-impact analysis screen. This information can be useful to
testers for determining functionality that was altered by the patch. For large
patches, the patch-impact analysis may be too lengthy to be of much value.
Patch Advisor OAM can also be used to perform patch analysis reporting
against your instance. Select the Patch Wizard Tasks menu to see the options
shown in Figure 5-4.
Figure 5-4. The Patch Wizard Tasks menu
Select Patch Wizard Preferences to define your work environment. These
options include the staging directory for patches, as well as language and
platform defaults. The Patch Wizard will use these details to download infor-
mation from MetaLink in order to create recommendations or patch
analysis.
A scheduled job can be created to perform these tasks on a regular basis,
as shown in Figure 5-5.
Figure 5-5. Scheduling options for patch analysis
CHAPTER 5 ■ PATCHING140
6447CH05.qxd 3/6/06 4:59 PM Page 140
Applying Patches
After all of the required patching steps have been documented, you can
begin the process of applying the patch. This generally involves the following
logical steps:
1. Download and unbundle the patch.
2. Identify patch drivers required for the patch.
3. Place the instance in maintenance mode.
4. Use the AD Patch utility to apply patch driver files.
5. Perform any manual steps that may be required.
A sandbox instance is a must for applying patches. This instance gives
the Oracle Applications DBA a place to apply patches and resolve issues
without impacting production or other test instances. Ensure that the sand-
box is a recent clone of production, so that this environment matches the
production environment. All steps should be practiced multiple times and
be thoroughly tested before applying the patch in production.
■Note The adpatch utility must be run as the owner of the application software.
Unbundling the Patch
The first step is to download the patch and unbundle it using an unzip utility.
If errors are encountered while unzipping large zip files, you may require an
updated version of the unzip program. Review operating system specifics
and release notes regarding the unzip utility.
It is advisable to have a separate filesystem for storing and unbundling
patches. When a large patch, such as a maintenance pack, is released, a tem-
porary filesystem may need to be created to store the unbundled patch.
When sizing the filesystem, be sure to include an extra 20 percent for backup
information that is written to the patch directory.
■Tip Before applying a patch, confirm that there is enough space allocated to the
instance filesystem, as well as to the filesystem where the patch has been unbundled.
Exhausting filesystem space is a common error that occurs while applying patches.
CHAPTER 5 ■ PATCHING 141
6447CH05.qxd 3/6/06 4:59 PM Page 141