oracle Applications DBA Field Guide phần 5 ppt
Bạn đang xem bản rút gọn của tài liệu. Xem và tải ngay bản đầy đủ của tài liệu tại đây (476.74 KB, 27 trang )
Performing a Network Test from the Application
Oracle Applications also provides a Network Trace Form that the user may
execute. This form is accessed by logging in to the application and choosing
the Application ➤ Network Test menu option. Click the Run Test button, and
the Form will return information about network latency and bandwidth. The
number of iterations and trails can be customized for each execution of the
test. A sample of the output is shown in Figure 3-6.
Figure 3-6. Forms network test
This information can be used by your company’s or customer’s network-
ing team to determine whether networking bottlenecks exist.
Additional Monitoring and Troubleshooting
Topics
This section will cover some miscellaneous monitoring and troubleshooting
issues:
• Monitoring profile changes, which may assist with troubleshooting con-
figuration issues
• Monitoring and validating system backups
• Troubleshooting JInitiator issues such as deleting the cache and using
the Java console
CHAPTER 3 ■ MONITORING AND TROUBLESHOOTING90
6447CH03.qxd 3/6/06 4:55 PM Page 90
Monitoring Profile Changes
Application profile settings allow for users and system administrators to cus-
tomize the functionality of the E-Business Suite. As a result, altering these
profile settings can sometimes have an adverse effect on the behavior of the
application. The Applications DBA should make a practice of monitoring any
changes to the profile settings.
Checking profile settings is especially important when performing
major patching efforts, because a patch may overwrite profile options. New
profile settings may also be created during the patching process. In addition
to patching, the most common reason for profile changes is user error. For
example, a system administrator may change a profile setting without realiz-
ing the full impact on the system.
The following script can be used to alert you to profile options changed
within a specified threshold:
#Script used to monitor for application profile changes
#Threshold is the number of days to query for profile changes
#For example, if you set it to 7, all profile changes that
#have occurred in the past 7 days will be displayed.
THRESHOLD=$1
LOGFILE=/tmp/profile_changes_$ORACLE_SID.txt
sqlplus -s apps/apps << EOF
set heading off
spool $LOGFILE
select '$ORACLE_SID - Profile Changes Past '||
'Threshold of $THRESHOLD days - '||count(1)
from fnd_profile_option_values
where last_update_date > (sysdate-$THRESHOLD)
having count(1) > $THRESHOLD
union
select 'no rows'
from fnd_profile_option_values
where last_update_date <= (sysdate-$THRESHOLD)
having count(1) <= $THRESHOLD;
spool off
exit
EOF
RETURN_CODE=`grep "Threshold" $LOGFILE | wc -l`
if [ $RETURN_CODE -eq 0 ]
then
exit 0
else
exit 1
fi
CHAPTER 3 ■ MONITORING AND TROUBLESHOOTING 91
6447CH03.qxd 3/6/06 4:55 PM Page 91
OAM may also be used to display profile changes made in the Oracle
application. This requires manually viewing the screen. From the Application
Dashboard, in the Configuration Changes portion of the screen (shown in
Figure 3-7), it is possible to see the number of profiles that have been
changed in the last 24 hours. To display profile options sorted by the Last
Updated date, click the number displayed next to Site Level Profile Options.
Figure 3-7. Viewing configuration changes from the OAM Dashboard
Monitoring System Backups
The Applications DBA should set up monitoring for the database backups.
If a failure occurs during the backup, the DBA should be notified so that the
situation can be resolved in a timely manner. This monitoring process
should be in place regardless of the backup methodology.
Some systems benefit from exporting certain objects or schemas in
addition to the regular backups. These exports can be monitored for error
messages within their log files. Since backups are largely environment spe-
cific, we will not attempt to address how monitoring should occur, only that
it should occur.
In addition to monitoring backups, periodic restores from backups
should be performed in order to confirm backup validity. Also verify that
the time required to restore the instance falls within your service level agree-
ment. This testing process should be part of your company’s disaster
recovery plan.
Resolving JInitiator Issues
When users encounter problems running Forms applications on their work-
stations, the source of the problem may be JInitiator. Troubleshooting
techniques for JInitiator include the following:
• Clearing the JAR cache
• Using the Java console
CHAPTER 3 ■ MONITORING AND TROUBLESHOOTING92
6447CH03.qxd 3/6/06 4:55 PM Page 92
Clearing the JInitiator Cache
Most JInitiator problems can be resolved by clearing the JAR cache for the
program. This can be accomplished by selecting the Cache tab on the
JInitiator Control Panel, shown in Figure 3-8, and clicking the Clear JAR
Cache button.
Figure 3-8. Clearing the JAR Cache
From this screen, you can also alter the location where the cache is
stored and the default size of the cache. This can be useful if there are client
issues such as the user not having write permission to the directory where
the cache is stored.
Using the Java Console
Java console display settings can be altered using the JInitiator Control
Panel. This program may be started from Start ➤ Control Panel menu option
on the client PC. There should be a JInitiator icon for each version installed
on the computer. Select the appropriate icon to start the program’s control
panel.
For troubleshooting purposes there is a Show Java Console checkbox on
the Basic tab of this control panel. Select this option and click the Apply but-
ton to allow for the Java console to be displayed on startup. This will provide
the client with some useful troubleshooting information.
CHAPTER 3 ■ MONITORING AND TROUBLESHOOTING 93
6447CH03.qxd 3/6/06 4:55 PM Page 93
■Tip If clearing the JInitiator cache and monitoring the Java console do not provide
resolution to client Forms issues, it may be necessary to reinstall the JInitiator.
Monitoring and Troubleshooting Best
Practices
When it comes to monitoring the Oracle E-Business Suite, the best advice is
to be proactive. It is much easier to react to issues before they result in seri-
ous problems or outages than to wait for problems to arise.
The key to proactive monitoring is to understand how Oracle Applica-
tions is used in your environment. Without knowing what is normal behavior,
it is difficult to capture the unexpected. Gain an understanding of the day-to-
day activities for your environment, and monitor for exceptions to these
trends. As your environment and system change, modify your proactive
monitoring to fit new trends.
The best tool for troubleshooting your environment and systems is an
understanding of the underlying configuration and how the Oracle E-Business
Suite works. Without detailed knowledge of the configuration and function-
ality, it is difficult to gauge where to begin looking for solutions. Do not be a
passive DBA: strive to be an active DBA. Learn the components of the appli-
cation so that you are empowered to respond quickly when it is broken.
CHAPTER 3 ■ MONITORING AND TROUBLESHOOTING94
6447CH03.qxd 3/6/06 4:55 PM Page 94
Performance Tuning
This chapter will focus on performance tuning techniques for many of the
components of the Oracle E-Business Suite. In the course of reading this
chapter, you will become familiar with various tools that will enable you to
diagnose and fix performance degradation problems.
The two main sections of this chapter focus on the process and tools for
performance tuning:
• Performance tuning process: The Applications DBA must identify and
document the cause of performance degradation, and then develop an
action plan for implementing a solution. This section will outline the
steps in this process.
• Tools for resolving performance issues: This section will discuss several
tools that can be used to tune the database and the server and provide
tips for tuning Forms, Apache, JServ, and Concurrent Manager. Informa-
tion for client tuning, generating and analyzing trace files, and some of
the new features of Oracle10g for SQL statement tuning, will also be
covered.
There are numerous books dedicated to the subject of performance
tuning. This chapter is not meant to provide intricate details for in-depth
performance tuning; however, it will provide an overview of the information
required for identifying and resolving performance issues.
■Note Tuning may also be performed on SQL statements and the networking and I/O
components of Oracle Applications; however, an extensive discussion of these sorts of
tuning is beyond the scope of this guide.
CHAPTER 4
95
6447CH04.qxd 3/6/06 4:57 PM Page 95
Performance Tuning Process
Performance issues may occur on any of the tiers, infrastructure, or modules
that make up the Oracle Applications environment. Because of the complex-
ity of the application, it is necessary to gather information from the user
community to determine which component of the application is experienc-
ing the degradation in performance. This section provides you with a
method for identifying and documenting performance issues and their
resolution.
The first phase is to identify the cause of the degradation by collecting
information to help you understand the underlying issue. The second phase
is to develop an action plan in order to provide resolution.
Identifying Performance Issues
Traditional methodologies for performance tuning begin with tuning the
application code and SQL. Since Oracle E-Business Suite is a packaged appli-
cation, however, the first step in the traditional methodology is often difficult
to implement. There are times when code performs so poorly that assistance
from Oracle Support and Development is required to fix the underlying code.
This situation will usually surface as a requirement while the Oracle Applica-
tions DBA works to identify the underlying performance issue.
To begin resolving performance problems, it is imperative that the
nature of the degradation is understood. The strategy presented here for
diagnosing the cause of performance degradation starts with general
questions and proceeds to questions specific to different pieces of the appli-
cation: the client tier, the network, a module of the application, and the
entire application. It is advisable to document performance issues and the
answers to these questions in order to facilitate resolution to the problem.
The Applications DBA may pose the following questions in order to col-
lect the required information. If the answer to a question is no, proceed to
the next question.
Question: Can the performance issue be systematically reproduced?
If the answer is yes: Document the process. Proceed to next question.
Question: Is the performance issue observed in only one instance?
If the answer is yes: Determine the difference between the instance
where it performs poorly versus the instance where performance is nor-
mal. It is possible that the difference is a configuration parameter or a
recently applied patch.
CHAPTER 4 ■ PERFORMANCE TUNING96
6447CH04.qxd 3/6/06 4:57 PM Page 96
Question: Are all users of the application that are experiencing the per-
formance degradation located within the same network segment?
If the answer is yes: The performance issue could be a networking issue.
Suggest testing the module on a PC that is located on a different seg-
ment of the network. It may be necessary to involve the networking
team to capture sniffer tracing on the network segment that is suspected
to be performing poorly and to assist in identifying the cause of the
underlying network performance problems.
Question: Is the performance degradation limited to a particular
window of time?
If the answer is yes: The performance issue could be the result of a
scheduled job on the database or server. This job may be causing
resource contention. Check all scheduled activity at the application,
database, and server level. Monitor the database and server during the
time period of performance issues for high resource processes. If a
resource-intensive job is found, reschedule it for a better time or acquire
more resources to support the required processing.
Question: Is the entire application experiencing performance
degradation?
If the answer is yes: Begin monitoring the database and server to iden-
tify the underlying performance issue. Tools for monitoring database
and server performance are described later in this chapter. Additional
methods for troubleshooting are outlined in Chapter 3 of this guide.
Question: Is the performance degradation limited to one module?
If the answer is yes: Ask the user community to provide the name of the
module that is performing poorly. Then proceed to work with the user
community to open an SR and generate a user trace to provide to Oracle
Support. Additional details regarding generating trace files are provided
later in this chapter.
Question: Is the performance degradation limited to one user?
If the answer is yes: If only one user is experiencing performance degra-
dation, the degradation is most likely isolated to the client. Suggest that
the user experiencing the performance issue try the task on a different
workstation. If the user successfully executes the application from a
different PC, additional monitoring needs to take place on the user’s
workstation. It is possible that additional memory or CPU resources are
required, or operating system or browser patching is required. Addi-
tional tips for diagnosing client issues are discussed later in this chapter.
CHAPTER 4 ■ PERFORMANCE TUNING 97
6447CH04.qxd 3/6/06 4:57 PM Page 97
This list of questions may be enhanced and revised to suit your environ-
ment. Update the questions regularly, and keep them in a central location.
Be certain that the people providing the first line of support for Oracle Appli-
cations are familiar with the questions developed by your organization. If
these questions have already been addressed when performance issues are
brought to the Applications DBA, the time required to resolve the problem
can be reduced.
Additional information can be found in MetaLink Note 69565.1, titled
“A Holistic Approach to Performance Tuning Oracle Applications Systems.”
Using this note and the preceding sample questions, you may begin to
develop your own template for performance tuning.
Developing an Action Plan
When a performance problem is reported, the Applications DBA should be
able to respond with an action plan for attempting to resolve the issue. Once
the issue has been narrowed down to a possible cause, steps for resolving the
issue should be outlined. Next, a more detailed tuning effort should take
place, focusing on the possible source of problem. The tools discussed in the
following section will assist you in determining the steps required for a more
detailed tuning effort.
After a resolution to the problem has been identified, update the action
plan with the steps taken to resolve the issue. This information can be pro-
vided to management and the user community for feedback during the
tuning process. This document also becomes a tool for future tuning efforts.
If the same problem is encountered again, a potential solution has already
been documented.
Tools for Resolving Performance Issues
Tools and methods for identifying and resolving performance issues may be
categorized at the database, server, application tier, and user levels. The
Applications DBA will need to be familiar with all of these tools. The tools
available will vary, depending upon the versions of the database and appli-
cation installed.
CHAPTER 4 ■ PERFORMANCE TUNING98
6447CH04.qxd 3/6/06 4:57 PM Page 98
The following topics will be discussed in this section:
• Database tuning: Tools for tuning the Oracle9i and Oracle10g databases
are described in this section. For Oracle9i, details for executing and
analyzing Statspack reports will be given. For Oracle10g, the use of the
manageability infrastructure, including Active Session History (ASH),
Automatic Workload Repository (AWR), and Automatic Database
Diagnostics Monitor (ADDM) will be covered.
• Server tuning: This section will discuss using UNIX commands, includ-
ing top, sar, vmstat, and ps, to generate performance-related server data.
An overview of how to analyze the server data will also be provided.
• Application tuning: This section outlines how to analyze performance
issues for the following application tiers: Forms, Apache, JServ, and Con-
current Manager. Included in this section are configuration guidelines
for improving performance.
• User tuning: The use of the Client System Analyzer, an Oracle Applica-
tions tool for assessing the client tier, will be covered, and tips for
manually analyzing the client will be included.
• Trace files: The process for generating trace files for Forms and Self
Service applications will be detailed. Steps for using tkprof and trcanlzr
to analyze trace files will also be covered.
• Additional performance considerations: Several application profile
settings that affect performance will be outlined.
• Common performance issues: Common performance problems will be
outlined.
Tuning the Database
The best tools for identifying database performance issues are Statspack,
provided with Oracle9i, or Automatic Workload Repository (AWR), provided
with Oracle10g. It is possible to perform tuning tasks by querying the Oracle
database dictionary, which contains performance-related data, but such
tasks are beyond the scope of this guide. We will rely on using the standard
Oracle tools, such as Statspack, Automatic Workload Repository, and Auto-
matic Database Diagnostic Monitoring for collecting system performance
data. Tool availability is dependent upon the version of the database.
CHAPTER 4 ■ PERFORMANCE TUNING 99
6447CH04.qxd 3/6/06 4:57 PM Page 99
Using Statspack for Oracle9i
Statspack is an Oracle-provided utility comprising PL/SQL code and scripts
that are used for collecting and storing performance data. The perfstat user
owns the Statspack database objects, including packages and tables. Please
review information specific to your database version for installation of the
Statspack utility.
■Tip When defining the perfstat user, be sure to set the default tablespace to a
tablespace other than
SYSTEM, such as the TOOLS tablespace. Also, set the temporary
tablespace for the
perfstat user to a temporary tablespace defined in the database
instance, such as TEMP.
When using Oracle Applications, additional scripts are available to
enhance the Statspack utility. MetaLink Note 153507.1 describes 11i
Statspack specifics in detail. One additional script of interest, spmodfn.sql,
may be executed to include the source module name of queries in the output
of a Statspack report.
Once Statspack has been installed, a snapshot of the database may be
taken, to collect performance information. Two snapshots are required to
generate a performance collection window. Reports can then be generated to
analyze database performance for the time period between two snapshots.
■Tip When generating snapshot reports, the two snapshots should not include a period
when the database was shut down; if it does, the report will be invalid.
The SQL*Plus command in the following example may be executed as
the perfstat user to obtain a default snapshot:
sql>exec statspack.snapshot
Some parameters for thresholds should be changed from their default
when executing Statspack snapshots for Oracle Applications. These are listed
in Table 4-1.
CHAPTER 4 ■ PERFORMANCE TUNING100
6447CH04.qxd 3/6/06 4:57 PM Page 100
Table 4-1. Statspack Thresholds and Descriptions
Parameter Name Description
i_snap_level Snapshot level; level 0 is the most general collection,
and 10 is the most detailed
i_executioins_th SQL threshold; number of times the statement was
executed
i_parse_calls_th SQL threshold; number of parse calls the statement
made
i_disk_reads_th SQL threshold; number of disk reads the statement
made
i_buffer_gets_th SQL threshold; number of buffer gets the statement
made
i_sharable_mem_th SQL threshold; amount of memory required to
execute the statement
i_version_count_th SQL threshold; number of versions (children cursors)
used by the statement
i_all_init When set to TRUE, Statspack will capture all non-
default Oracle initialization parameters
The following example shows the recommended thresholds for snap-
shots taken on Oracle Applications:
sql>exec statspack.snapshot ( -
>i_snap_level => 6, -
>i_executions_th => 1000, -
>i_parse_calls_th => 1000, -
>i_disk_reads_th => 10000, -
>i_buffer_gets_th => 100000, -
>i_sharable_mem_th => 1048576, -
>i_version_count_th => 20, -
>i_all_init => 'TRUE' -
>)
■Tip The timed_statistics database initialization parameter must be set to TRUE in
order to use Statspack.
CHAPTER 4 ■ PERFORMANCE TUNING 101
6447CH04.qxd 3/6/06 4:57 PM Page 101
It is advisable to collect snapshots during periods of normal activity in
the system to provide a baseline of comparison for snapshots that are taken
during periods when performance degradation is being experienced. In order
to compare information, snapshots should be of the same duration and be
executed during the same level and type of activity. Enterprise Manager (EM),
dbms_jobs, or crontab may be used to schedule snapshots on a regular basis.
The use of these methods for scheduling activities will be described in Chap-
ter 6 of this guide. The spauto.sql script in the $ORACLE_HOME/rdbms/admin
directory will schedule snapshots to execute every hour.
■Tip Executing a snapshot at the start and end of a payroll run is a good example of
when regularly scheduled snapshots should be scheduled.
Once snapshots have been captured, the sprepins.sql script should be
executed as the perfstat user in order to generate the performance report.
The database ID and beginning and ending snapshot numbers are required
input for the sprepins.sql report to be generated. The following example
shows the command to generate a Statspack report:
sql>@$ORACLE_HOME/rdbms/admin/sprepins.sql
Instances in this Statspack schema
~~~~~~~~~~~~~~~~~~~~~~~~~~~~~~~~~~
DB Id Inst Num DB Name Instance Host
3015003723 1 VIS VIS vis1
Enter value for dbid:
After entering the DB ID and instance number, the script will display a
list of available snapshot IDs. The script will prompt for a beginning and an
ending snapshot ID to be used for the report.
Analyzing Oracle9i Statspack Reports
Once the database performance data has been generated with Statspack,
the Applications DBA will need to review the report. The report will contain
much useful information, such as instance efficiency percentages, top timed
events, and top SQL, ordered by several criteria, such as physical reads, logi-
cal reads, and executions, among others. An example of a Statspack report is
shown in Figure 4-1.
CHAPTER 4 ■ PERFORMANCE TUNING102
6447CH04.qxd 3/6/06 4:57 PM Page 102
Figure 4-1. Sample Statspack report
The top wait or timed events listed in the report identify the events that
might require tuning. The “SQL Ordered By” sections of the report can help
identify SQL statements that require tuning or that are CPU intensive. This
data is necessary for finding the root cause of performance issues.
The key to improving performance is to spend time tuning items that
will result in the biggest improvement. Little will be gained by spending an
inordinate amount of time tuning an event that is a minor consumer of sys-
tem resources. Spend time focusing on the largest resource consumers.
For example, if the performance data indicates that “db file scattered
read” is by far the biggest wait event, the Applications DBA needs to look for
the cause of this problem. This wait event can be caused by an excessive
number of full table scan queries. The full table scans could be the result of
bad database statistics causing the optimizer to build inefficient execution
plans, or poorly written queries that are not taking advantage of existing
CHAPTER 4 ■ PERFORMANCE TUNING 103
6447CH04.qxd 3/6/06 4:57 PM Page 103
indexes. Occasionally such a problem may be resolved by creating an addi-
tional index, but be aware that creating an index results in the additional
cost of extra storage space as well as overhead for Data Manipulation Lan-
guage (DML) statements against the underlying table.
In addition to reviewing the top wait events, also review the top SQL
statements in the categories of logical reads, physical reads, and number of
executions. These investigations may reveal SQL statements that require tun-
ing. With a packaged application such as Oracle E-Business Suite, it may not
be possible to rewrite problem queries, and in extreme situations it may be
necessary to open an SR with Oracle to resolve the performance problems.
By including the module name in the Statspack report, the Applications
DBA may be able to search MetaLink for information about that module’s
SQL performance to identify known performance issues. Ensure that the
module in question is patched with the highest level of code possible.
Finally, when reviewing the performance data, look for any problems
with the memory sizing. Oracle Applications can require large shared pool,
buffer cache, and PGA aggregate settings. A low buffer cache hit ratio may be
resolved by increasing the buffer cache size. However, be sure to investigate
all scenarios before adding memory. It does the system no good to increase
memory size when the root problem is outdated database statistics or
skewed buffer hit ratios resulting from Concurrent Manager or workflow
data not being properly purged from the system.
Using Active Session History with Oracle10g
A key element of Oracle10g’s manageability infrastructure is Active Session
History (ASH). Oracle collects information every second on active database
sessions and stores this information in memory within the System Global
Area (SGA). By collecting this data, the Automatic Database Diagnostics
Monitor (ADDM) process will be able to better identify issues related to data
access by sessions. The MMNL background process is responsible for writing
session data to memory. This should enable performance data to be col-
lected with minimal overhead to the system. The MMNL process will write the
data from memory into tables every hour.
ASH data can be accessed through the V$ACTIVE_SESSION_HISTORY view
for manual analysis. This view contains information about the database user,
the module being run, SQL execution plans, wait events, CPU time used, and
database objects being accessed. Given the frequency of samples from Oracle,
this view will contain current data, and it makes ASH useful for near real-
time analysis of your system. To view information collected by ASH for a
specific duration, run the ashrpt.sql script in the $ORACLE_HOME/rdbms/admin
directory on the Database Node.
In addition to performing online analysis, the contents of the ASH buffer
may be downloaded to a trace file. The process for doing this utilizes the
CHAPTER 4 ■ PERFORMANCE TUNING104
6447CH04.qxd 3/6/06 4:57 PM Page 104
ASHDUMP event:
sql>alter session set events 'immediate trace name ashdump level 10';
This command will create a trace file in the database’s udump directory.
The file created will be a comma-separated text file containing a structure
similar to the V$ACTIVE_SESSION_HISTORY view. For analysis, this file may be
loaded into the database using the SQL Loader utility. Utilizing ASHDUMP
allows for offline analysis, which can be useful for analyzing the data from a
hung system. Also, the dump file can be imported into a different system, in
case the target system becomes unavailable.
Using Automatic Workload Repository with Oracle10g
In Oracle10g, snapshots no longer need to be executed manually, as with
Statspack. The Automatic Workload Repository (AWR) collects performance
data automatically. The data collection is done with minimal overhead by
utilizing a new background process called Manageability Monitor (MMON),
which is responsible for taking the snapshots of database performance sta-
tistics. Building this sort of performance diagnostic information into the
database is part of Oracle’s new manageability infrastructure. AWR is not just
a replacement of Statspack—additional information is gathered by AWR,
such as operating system statistics, which can be seen in the V$OSSTAT view.
The default collection method used by MMON is to take snapshots every
60 minutes. This data is stored for seven days before it is automatically
purged from the system. Rather than using a perfstat user and a TOOLS
tablespace, this data is stored in the SYS schema within the SYSAUX table-
space. Over 100 tables are created to store the AWR data, which can be
accessed using the DBA_HIST_% views. Some of the more common views
are listed in Table 4-2.
Table 4-2. Common AWR Views
View name Description
DBA_HIST_BASELINE Information on the AWR baselines
DBA_HIST_DATABASE_INSTANCE Information on the database and instance
DBA_HIST_SNAPSHOT Information on AWR snapshots
DBA_HIST_SQL_PLAN Information on SQL execution plans
DBA_HIST_WR_CONTROL Information on the parameters set for AWR
CHAPTER 4 ■ PERFORMANCE TUNING 105
6447CH04.qxd 3/6/06 4:57 PM Page 105
Oracle EM provides a graphical interface for managing AWR. Using EM,
the Applications DBA can easily manage the AWR settings and generate
reports.
The management of AWR may also be performed using the
DBMS_WORKLOAD_REPOSITORY package. For example, to change the frequency of
snapshots from one hour to two hours, and data retention from seven days
to ten days, execute the following command using numbers of minutes for
the two parameters:
sql>exec dbms_workload_repository.modify_snapshot_settings ( -
>interval => 120, -
>retention => 14400)
To manually create a snapshot when the snapshot interval is not suffi-
cient, use the following procedure:
sql>exec dbms_workload_repository.create_snapshot()
Within AWR it is possible to create a baseline of snapshots, and in EM
this feature is called Preserved Snapshot Sets. This baseline may be created
from snapshots taken during periods of normal database activity. If prob-
lems occur at a later date, a new baseline may be created, and these two
baselines can be compared to identify performance problems. To create a
baseline from snapshot_id 1 and snapshot_id 2, use the following command:
sql>exec dbms_workload_repository.create_baseline( -
>start_snap_id => 1, -
>end_snap_id => 2, -
>baseline_name => 'Test')
The performance report is generated by running the awrrpt.sql script.
This script requires two snapshots covering the time when the performance
issue was experienced as input. Here is an example of executing the AWR
performance report:
sql>@$ORACLE_HOME/rdbms/admin/awrrpt.sql
The report may be manually analyzed using the same approach as for
analyzing Statspack reports. With Oracle10g, the Automatic Database Diag-
nostic Monitoring (ADDM) can automatically analyze AWR information. The
features of this tool are explained in the next section.
CHAPTER 4 ■ PERFORMANCE TUNING106
6447CH04.qxd 3/6/06 4:57 PM Page 106
Using Automatic Database Diagnostic Monitoring with Oracle 10g
The goal of the manageability infrastructure is to provide a self-monitoring
and self-tuning database. This feature should free the DBA from mundane
tasks and allow more time for providing strategic direction. Rather than
recommending the DBA manually analyze AWR and ASH data, Oracle pro-
vides the Automatic Database Diagnostic Monitor (ADDM) to automatically
analyze the data collected by the monitoring tools. By following a set of
tuning rules developed by Oracle experts, this program will create recom-
mendations that will reduce overall time spent in database calls.
The ADDM analysis will list areas for improvement in its reports that are
not necessarily critical. Keep in mind that the goal of tuning is to seek the
areas where you can make the biggest improvement.
■Tip Be careful when using any automatic analysis tool. The recommendations pro-
vided by the tool may not be appropriate for your system. Before implementing any
recommendation from such a tool, be sure that you understand the reasoning for the
change. Thoroughly test any such change before promoting the change to your produc-
tion system.
Like AWR and ASH, EM provides a rich, graphical interface to ADDM.
EM’s interface to these tools provides the easiest method of interaction.
However, you may still perform analysis and build reports manually as a
database user with the ADVISOR privilege by using the Oracle-provided
DBMS_ADVISOR package. The $ORACLE_HOME/rdbms/admin/addmrpt.sql script
will
generate an ADDM report.
The method of executing this script is very similar to generating a
Statspack report. You will be prompted for a beginning and ending AWR
snapshot to use for the analysis. If the database has been restarted during
the time between the two snapshots, the analysis provided by ADDM will
be invalid.
■Note In order for ADDM to function, the STATISTICS_LEVEL initialization parameter
must be set to either
TYPICAL or ALL. A setting of BASIC will disable ADDM. Oracle
recommends only setting this parameter to
ALL when performing diagnostics on the
system.
CHAPTER 4 ■ PERFORMANCE TUNING 107
6447CH04.qxd 3/6/06 4:57 PM Page 107
Information related to ADDM may be accessed in the DBA_ADVISOR_%
views. Some of the more important views are listed in Table 4-3.
Table 4-3. Common ADDM Views
View Name Description
DBA_ADVISOR_FINDINGS Information on the findings of ADDM
DBA_ADVISOR_LOG Information on the current state of all tasks
in the database
DBA_ADVISOR_RATIONALE Information on the rationale for all
recommendations by ADDM
DBA_ADVISOR_RECOMMENDATIONS Information on the recommendations for
all diagnostic tasks
DBA_ADVISOR_TASKS Information on the existing tasks in the
database
Tuning the Server
All of the database tuning in the world cannot eliminate performance issues
if the underlying problem is at the server level. Standard UNIX commands
can be used to monitor server CPU and memory consumption. Some of the
commands vary depending upon the flavor of UNIX used, so consult docu-
mentation specific to your operating system for more detail. All of the
commands discussed in this section have many parameters and options
associated with them; therefore, an overview of how to use the commands
will be provided.
Using top
The UNIX top command provides an overview of CPU and memory utiliza-
tion. The statistics are refreshed every few seconds to provide near real-time
data. Statistics for CPU, memory, and swap space for the top command are
shown in Tables 4-4 through 4-6.
Table 4-4. CPU States as Displayed by top
Column Description
User Percentage of CPU utilized by user
System Percentage of CPU utilized by the server
Idle Percentage of CPU idle time
CHAPTER 4 ■ PERFORMANCE TUNING108
6447CH04.qxd 3/6/06 4:57 PM Page 108
Table 4-5. Memory as Displayed by top
Column Description
Av Available memory
Used Used memory
Free Free memory
Table 4-6. Swap as Displayed by top
Column Description
Av Available swap space
Used Used swap space
Free Free swap space
Upon executing top, the CPU, memory, and swap statistics are displayed,
followed by a list of active system processes. The process information dis-
played is very similar to what is displayed by the ps command, which will be
described shortly in the “Using ps” section. To exit top, press q. An example
of executing top is displayed in Figure 4-2.
Figure 4-2. Execution of top
CHAPTER 4 ■ PERFORMANCE TUNING 109
6447CH04.qxd 3/6/06 4:57 PM Page 109
Using sar
System Activity Reporter (sar) has many different parameters that can be
used. CPU utilization can be shown with the -u switch, for example, and
memory swapping can be shown with the -w switch.
The sar command requires two arguments, the first being the time
interval between samples, and the second being the number of samples to
take. Table 4-7 lists relevant columns and descriptions of the data displayed
by executing sar -u to capture CPU utilization.
Table 4-7. Columns and Descriptions for the sar -u Command
Column Description
%user Percentage of system utilized by users
%system Percentage of system utilized by the OS
%iowait Percentage waiting on I/O
%idle Percentage of server that is idle
Figure 4-3 shows the output of the sar -u command, displaying CPU
utilization with five samples in 10-second intervals.
Figure 4-3. Executing sar -u
Table 4-8 lists relevant columns and descriptions of the data displayed
by executing sar -r to capture memory utilization.
Table 4-8. Statistics Displayed by the sar -r Command
Column Description
kbmemfree Free memory in KB
kbmemused Memory used in KB
%memused Percentage of memory used
kbswpfree Free swap space in KB
kbswpused Used swap space in KB
%swpused Percentage of used swap space
CHAPTER 4 ■ PERFORMANCE TUNING110
6447CH04.qxd 3/6/06 4:57 PM Page 110
Figure 4-4 shows the output of the sar -r command, displaying server
data for six samples with 5-second intervals between each sample.
Figure 4-4. Execution of sar -r
Using vmstat
Another command that can be used to display UNIX performance statistics
is vmstat. Common statistics displayed by vmstat are arranged in the cate-
gories shown in Table 4-9.
Table 4-9. Categories for the vmstat Command
Category Description
procs Information about processes
memory Information about virtual and real memory
wwap Information about page faults and paging activity
io Information about I/O
system Information about system interrupts and switches
cpu Information about percentage of CPU time
Additional details for key vmstat columns in the different categories are
shown in Table 4-10.
Table 4-10. Key vmstat Statistics
Column Description
r Run queue
free Amount of idle memory (KB)
si Amount of memory swapped in from disk (KB/s)
so Amount of memory swapped to disk (KB/s)
bi Blocks sent to a device
bo Blocks received from a device
Continued
CHAPTER 4 ■ PERFORMANCE TUNING 111
6447CH04.qxd 3/6/06 4:57 PM Page 111
Table 4-10. Continued
Column Description
us User time
sy System time
id Idle time
Executing vmstat without any options results in statistics being dis-
played since the last reboot, as shown in Figure 4-5.
Figure 4-5. Server statistics displayed by vmstat
The example of vmstat in Figure 4-6 displays five summaries at 3-second
intervals, the first summary being the summary since boot up.
Figure 4-6. Summary of server statistics displayed by vmstat 3 5
Using ps
The UNIX ps command is used to display active processes. This command
can be sorted by any of the columns that are displayed by it. Sorting by the
sixth column, the CPU column, is demonstrated in Figure 4-7. The columns
displayed in the output in Figure 4-7 are process, process ID, parent process
ID, CPU utilization of process, total execution time, controlling workstation,
login time, process owner.
Figure 4-7. Sorting processes by CPU with the ps command
CHAPTER 4 ■ PERFORMANCE TUNING112
6447CH04.qxd 3/6/06 4:57 PM Page 112
Analyzing Server Performance Data
By using any of the UNIX commands described in the previous sections, key
performance statistics for the server can be gathered. CPU usage, memory
usage, and resource-intensive processes should be furthered analyzed.
If the CPU is displaying small amounts of idle time, it is possible that
Oracle processes are experiencing CPU contention. If CPU consumption
cannot be associated with one process but rather is the sum of many
processes, additional CPU resources may be required. Within vmstat, the
number displayed for the run queue should be less than the total number
of CPUs on the server.
If the top CPU consumer is an Oracle process, you should identify the
source of the process. If it is on the application server, determine if it is a
Forms, iAS, or Concurrent Manager process. Review the log files for errors
or use some of the monitoring tools previously discussed to determine the
cause of the high activity. Sometimes it may be necessary to bounce the
Forms or Apache Server or kill the process at the operating system level to
remove a process that is spinning out of control. If the process is on the data-
base server, drill down into the underlying activity in the database for the
session that matches the UNIX process ID. This may be accomplished with
EM or by executing queries in the database. Use Statspack or AWR, or gener-
ate user traces to determine whether the database process needs to be tuned
in order to reduce CPU utilization.
Memory swapping occurs if real memory is exhausted and its contents
need to be swapped to disk. If there is a high amount of memory swapping, it
is likely that Oracle is experiencing memory contention. It might be possible
to decrease the amount of memory being consumed by the SGA or iAS, but
often memory contention is resolved by purchasing additional RAM for the
server.
Tuning the Application Tier
Common application components that require performance-tuning atten-
tion include Forms, Apache Server, JServ, and Concurrent Manager.
Forms Tuning
Forms sessions run on the server as f60webmx processes. You can retrieve a
listing of the Forms processes on the server for the VIS instance by executing
the following command:
$ps -ef | grep f60webmx | grep VIS
If an f60webmx process is one of the top processes on a server, as deter-
mined by top, sar, or ps, you should try to link the Forms process to a
CHAPTER 4 ■ PERFORMANCE TUNING 113
6447CH04.qxd 3/6/06 4:57 PM Page 113
database session. This can be done by viewing active Forms sessions in OAM
as outlined in Chapter 3 of this guide. If there seems to be no valid reason for
this session to be among the top sessions, then it might be necessary to kill
the session or bounce the Forms server.
Forms performance issues may arise when dead connections persist on
the server, consuming server resources. Enabling Forms dead-client detection
by setting the FORMS60_TIMEOUT parameter can eliminate dead connections.
The value specified for the parameter is in minutes.
Another means of tuning Forms processes is to enable the Forms abnor-
mal termination handler by enabling the FORMS60_CATCHTERM parameter.
Setting FORMS60_CATCHTERM to 1 will cause Forms errors to dump output to
the FORMS60_TRACE_PATH directory.
Both the FORMS60_TIMEOUT and FORMS60_CATCHTERM parameters can be set
by modifying the context file and then running autoconfig or by exporting
them as environment variables and restarting the Forms server.
Key context file parameters for Forms tuning are shown in Table 4-11.
Table 4-11. Parameters for Forms Tuning Sessions
Context File Parameter Environment Variable Recommended Value
s_f60time FORMS60_TIMEOUT 10
s_f60catchterm FORMS60_CATCHTERM unset or 1
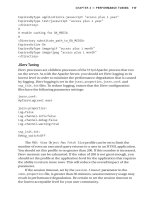
Users of the Oracle E-Business Suite may also want the ability to cancel
a Forms query. This may be achieved by setting the FND: Enable Cancel
Query profile option to Yes at the site, application, responsibility, or user
level. If you do not enable this profile option, the only method for canceling
the query is to kill the Forms session. When this profile option is enabled, a
cancel query dialog box will appear in order for the user to cancel the query.
Review MetaLink Note 138159.1 for additional requirements, such as Forms
patch level.
While this seems like a good feature to offer your users, it comes at the
expense of increasing client, middle-tier, and database CPU usage. Be careful
when enabling this feature. Since it can be controlled down to the user level,
it is recommended that you limit this option to certain users. If you decide
to enable cancel query, the parameters shown in Table 4-12 may be used to
tune its effects.
CHAPTER 4 ■ PERFORMANCE TUNING114
6447CH04.qxd 3/6/06 4:57 PM Page 114