Engineering Materials and Processes phần 7 ppsx
Bạn đang xem bản rút gọn của tài liệu. Xem và tải ngay bản đầy đủ của tài liệu tại đây (664.22 KB, 14 trang )
5
Silver Electromigration Resistance
5.1 Introduction
Electromigration has been identified as a primary failure mode of interconnect
lines used in semiconductor-integrated circuits. It is a high-current density induced
mass transport phenomenon manifesting itself as voids, hillocks, or open circuits,
due to a momentum exchange between conduction electrons and host metal atoms.
The electromigration failure of Al(Cu) interconnects has been extensively
investigated because of the dominant use of Al(Cu) as conductors in
microelectronics devices for decades. Recently, the electromigration study of Cu
has been conducted considerably as well, since the trend to replace Al(Cu) with Cu
is becoming apparent for ultra large scale integration (ULSI) applications. Ag, as
the most conductive metal, has also drawn attention as an interconnect material for
some potential applications in ULSI [1, 2]. Ag has some advantage over Cu in
terms of the conductivity.
Since the wide application of Cu metallization will be facing some difficulties
[3], Ag may find its applications if the electromigration resistance can be further
improved and some other issues [2] can be addressed. Compared to Al, Ag is
expected to have better electromigration resistance. However, the electromigration
resistance of Ag needs to be further improved in order to be comparable to Cu.
A novel encapsulation process is described for patterned Ag lines and the effect
of this process on the Ag electromigration is evaluated.
76 Silver Metallization
5.2 Experimental Details
Ti film (50 nm) and Ag film (100 nm) were sequentially deposited on a thermally
oxidized (100) Si wafer without breaking vacuum in an electron beam evaporator.
The base pressure before Ti deposition was approximately 1.2×10
–7
Torr. The Ti
film was mainly used to form an encapsulation layer on the Ag line surface, as will
be shown later. A conventional optical lithography process was used to transfer the
designed mask pattern onto the deposited Ag/Ti/SiO
2
/Si films. The pattern
configuration consists of one test line (600 µm in length and 10 µm in width) and
two pads (200×200 µm
2
) located at the ends of the line. A reactive ion etch (RIE)
process in an O
2
plasma was employed to etch away the Ag unprotected by
photoresist. During the etch process, the underlying Ti acted as an etch stop.
The encapsulation process of the Ag patterns was carried out in a quartz-tube
furnace with a flowing high purity NH
3
gas and a flow rate of approximately
2 l/min. The tube was evacuated and then NH
3
-purged alternately for three cycles
before loading the pattern samples into the hot zone. The encapsulation annealing
took place at 550°C for 30 minutes. Auger electron spectroscopy (AES) and cross-
section transmission electron microscopy (XTEM) were employed to characterize
the Ag line patterns.
The AES was performed in a scanning Auger microscope surface analysis
system with an incident energy of 3 keV at 0.2 µA. The Auger electron signal was
collected from the surface of one pad in the Ag test pattern, since the Ag test line
was too narrow.
The XTEM observation was carried out in a JEM 2000FX electron microscope
at an operating voltage of 200 kV. The electromigration test of both bare Ag lines
and NH
3
-annealed Ag lines was carried out in a Tektronics electrical testing
system. The current density was approximately 4×10
7
A/cm
2
and an external
heating (200°C) was provided. During the tests, the surface of the test Ag lines was
inspected periodically by an optical microscope, and the time when significant
number of voids and hillocks can be observed on the test line was defined as the
primary criterion for the electromigration failure. Further examination of the
surface morphology was conducted by using plane-view scanning electron
microscopy (SEM). Four samples were tested for both test configurations (samples
A, B, C, and D for bare Ag patterns, and samples A′, B′, C′, and D′ for and NH
3
-
annealed Ag patterns). The average of four failure times was used to evaluate the
electromigration resistance.
5.3 Results and Discussion
The AES spectrum as acquired from the NH
3
-annealed Ag pad is shown in Figure
5.1. In standard AES spectrum for pure Ti, there are two Ti peaks, one is Ti(LMM)
at 387 eV, the other is Ti(LMV) at 418 eV.
Silver Electromigration Resistance 77
Figure 5.1. AES spectrum as acquired from the surface of one pad in the Ag test pattern
after annealing in NH
3
at 550°C, 30 minutes [4]
The N(KLL) Auger peak is at 379 eV, which usually coincides with lower-
energy Ti peak. The intensity ratio R of the two Ti peaks, defined as I
(418 eV)
/I
(387 eV)
,
can be used to characterize various Ti compounds. The value of R has been
determined to be 1.3 in pure Ti, 0.6 in TiO
2
, and 0.4 in TiN. In the present case, the
R value is approximately 0.5. It is in between 0.6 for TiO
2
and 0.4 for TiN,
suggesting that the compound is most likely to be TiN(O). The appearance of O
peak in AES spectrum also confirms the incorporation of O. The oxygen is
believed to come from the furnace ambient. Even though the furnace tube was
purged for three cycles, there might still be some residual O remaining in the tube.
By vision, the surface color of the Ag lines changes into golden-yellow after NH
3
annealing, which is the typical color for the TiN based compound.
The electromigration test results for the bare Ag lines show that at the early
stage of the test, a partial depletion region first appears at the line segment, which
is immediately near the cathode pad, and afterwards, this region starts to extend
progressively towards the anode side. This partial depletion region is virtually
comprised of a large number of voids and hillocks located side by side. During the
drift of this partial depletion region, significant voids and hillocks also form side
by side at other areas of the line. A typical example is given in Figure 5.2, which
shows the scanning electron microscope (SEM) image of the morphology of the
center area of the bare line sample D after 3 hours testing. A cluster of hillocks is
located immediately on the right side of the voiding area. This confirms that mass
transport is directed towards the node (the right-hand direction) and the formation
of hillocks is the consequence of mass depletion from voiding areas.
78 Silver Metallization
Figure 5.2. Plane-view SEM micrograph indicating the surface morphology of the bare Ag
test sample D (near-cathode segment), tested for 3 hours. The line width is approximately
10 µm. The left portion of the line segment is the partial depletion region, which is
composed of a large number of voids and hillocks. It is noted that the actual electric current
flowed through the lines from the right to left [4].
The partial depletion occurring near the cathode presumably results from the
long-range temperature gradient due to the non-uniform Joule heating caused by
the difference in the cross section area of the test line and pads. More Joule heating
and higher temperature rise are anticipated in the test line area than those on the
pad area.
As a consequence, there are more atoms leaving from the near-cathode line
towards the anode than those entering from the cathode-side pad driven by the
electron wind. The electromigration test results of four bare Ag lines are
summarized in Table 5.1.
Table 5.1. Electromigration test results of bare Ag lines [4]
Identification of test
lines
Actual test
time (h)
Appropriate time for observable formation of
a partial depletion region (min)
A 3
90
B 1.5 25
C 1.5 40
D 3 50
Silver Electromigration Resistance 79
For all tested Ag lines, which were encapsulated by TiN(O), no partial
depletion area and no significant number of voids and hillocks were observed even
after testing for much longer time than that for bare Ag lines (see Table 5.2). For
instance, for encapsulated line sample B′, which was tested for 7 hours, only four
to five voids are found across the entire length of the line. The voiding area of this
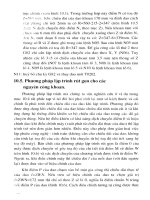
sample is shown in Figure 5.3 [4]. These results were typical as well for other test
samples.
Figure 5.3. Plane-view SEM micrograph of the TiN(O) encapsulated Ag line sample B′,
tested for 7 hours. The line width is approximately 10 µm. Only four to five voids were
found across the entire length of the line [4].
Table 5.2 indicates the actual test time for all four test samples and also the
total number of voids found across the entire line. According to the results in
Tables 5.1 and 5.2, the encapsulation process improves the electromigration
resistance (in terms of the time required for the formation of significant number of
voids and hillocks) of Ag metallization by at least one order of magnitude for the
test structures and conditions used in this study. Based on the tests conducted on
four Ag lines, the average time for the formation of considerable number of voids
and hillocks (partial depletion region) in bare Ag lines was approximately 50
minutes (Table 5.1). However, the corresponding time for encapsulated Ag lines
was at least 9 hours.
80 Silver Metallization
Table 5.2. Electromigration test results of TiN(O)-encapsulated Ag lines [4]
The cluster of hillock adjacent to the void area (shown in Figure 5.2) is
consistent with the observation of Breitling and Hummel [5] that voids and hillocks
are uniformly side-by-side distributed along the electromigration-tested Ag strip. It
is known that the electromigration failures of interconnect lines are primarily
caused by gradients which can lead to atomic flux divergences under the electrical
driving force. There are two major types of gradients that may exist: local gradients
due to microstructural or chemical inhomogeneities, and long-range temperature
gradient due to nonuniform Joule heating and heat dissipation. Based upon our
observations, it appears that in the present case the influences from both gradients
are superimposed. The side-by-side distribution of voids and hillocks along the
whole line length is attributed to the local inhomogenities, such as different grain
sizes, and variation in film thickness. Partial depletion occurring near the cathode
is assumed to result from the long-range temperature gradient due to the
nonuniform Joule heating caused by the difference in the cross-section area of the
test line and pads.
The round shape of the hillocks as seen in Figure 5.2 implies that surface
diffusion is most likely to be the dominant mechanism of mass transport, since the
agglomeration of hillocks is the result of minimizing surface energy configuration
by the surface diffusion of Ag atoms. For simplification, it is assumed that all Ag
grains have a hexagonal shape and transverse through the entire film thickness. If
this is the case, then the ratio of the surface area to the grain boundary area can be
estimated to be ~2.3 for bare Ag lines (based on the estimated average Ag grain
size from the TEM analysis). As a result the larger surface area and lower
activation energy for surface diffusion [6] leads to surface diffusion dominant
electromigration. After the encapsulation process, the Ag surface is capped by a
thin layer of TiN(O). The mobility of Ag atoms at the TiN(O)/Ag interface is
substantially reduced. Therefore the electromigration resistance is improved
significantly. By examination of the surface of the encapsulated Ag lines tested for
a long time, almost no round hillocks are observable. This implies that the surface
diffusion has been hindered substantially. The formation of voids in this case is
most likely to arise from the grain-boundary diffusion. Comparison of Tables 5.1
and 5.2 suggests that the encapsulation process improves the electromigration
resistance of Ag metallization by at least one order of magnitude for the test
structures and conditions used [4].
The significance of this work lies in that it has demonstrated the possibility to
improve the electromigration lifetime of Ag interconnects considerably by
applying a novel process technique. The TiN(O) layer can also prevent Ag lines
from corroding and agglomerating. The adhesion between Ag and the underlying
SiO
2
can be promoted as well [4].
Identification of
test lines
Actual test
time (h)
Surface morphology
changes after testing
A′
11.0 11–13 voids
B′
7.0 4–5 voids
C′
9.0 8–9 voids
D′
10.0 8–9 voids
Silver Electromigration Resistance 81
5.4 Conclusions
An encapsulation process has been applied to Ag line patterns on Ti/SiO
2
/Si
substrates, which are fabricated by using conventional photolithography and RIE in
an O
2
plasma. The electromigration behavior of the bare Ag lines has been
investigated. Upon the encapsulation and annealing in flowing NH
3
, a TiN(O) thin
layer forms at the surface of the Ag lines. The electromigration tests show that this
process has significantly improved the electromigration resistance of Ag lines by
primarily hindering the surface diffusion of Ag atoms. The electromigration
lifetime of Ag lines can be increased by at least one order of magnitude [4].
5.3 References
[1] T. L. Alford, D. Adams, T. Laursen, B. Manfred Ullrich, Appl. Phys. Lett.
68, 3251(1996).
[2] Y. L. Zou, T.L. Alford, Y. X. Zeng, A. Amali, T. Laursen, B. M. Ullrich,
J. Appl. Phys. 82, 3321(1997).
[3] J. Li, G. Vizkelethy, P. Revesz, J. W. Mayer, K. N. Tu, J. Appl. Phys. 69,
1020(1991).
[4] Y. Zeng, L. Chen, Y. L. Zou, P. A. Nyugen, J. D. Hansen, T. L. Alford.
Materials Letters 45, 157(2000).
[5] H .M. Breitling, R. E. Hummel, J. Phys. Chem. Solids 33, 845(1972).
[6] R. E. Hummel, H. J. Geier, Thin Solid Films 25, 335(1975).
This page intentionally blank
6
Integration Issues
6.1 Factors Influencing the Kinetics in Silver- luminum
Bilayer Systems
6.1.1 Introduction
Kinetics studies were conducted on both Ag-refractory metal alloys and bilayers on
silicon dioxide substrates during self-encapsulation in an NH
3
ambient. Adams
et al. [1] and Zou et al. [2] studied the dealloying kinetics of Ag (Ti), Cu (Ti) and
Cu (Cr) alloys during nitridation in NH
3
and reported that the kinetics of the
encapsulating layer (TiN or CrN) formation revealed a self-limiting behavior. The
rapid dealloying of Ti in Ag (Ti) alloys followed by a much slower diffusion rate is
a result of microstructural changes occurring simultaneously with the out-diffusion.
The studies of the kinetics of the alloys further showed that incomplete dealloying
occurs resulting in a high residual refractory metal concentration. The residual
refractory metal in Ag results in higher than elemental resistivities of these metals
[1]. Alford et al. [3] studied the encapsulation of Ag by a TiN layer by annealing
Ag/Ti bilayer structures in an NH
3
ambient. Compared to the alloys nitridation of
the bilayers resulted in minimal Ti accumulation in Ag films.
From a previous study on self-encapsulation of Ag/Al bilayers [4,5], it was
shown that Al diffuses through the Ag layers and reacts with both NH
3
and residual
oxygen in the ambient to form a thin Al
x
O
y
N
z
diffusion barrier at the surface.
Wang et al. [5] reported that the reaction kinetics in the Ag/Al bilayers system is
dominated by the out-diffusion of Al through Ag. According to this study, the
A
84 Silver Metallization
characteristic diffusion length of Al in Ag is about 110 µm at 725°C for 30 minutes
which is not suitable for studying Ag films with layer thickness of 100–200 nm.
For this reason, the authors only considered Al layers of thickness 8 nm. The
kinetics was determined by monitoring the formation of the aluminum oxide on the
surface of the Ag films. This study considers thicker Al layers (8–30 nm) in the
Ag/Al system in order to establish the factors governing the kinetics in this case.
6.1.2 Experimental Details
Aluminum (Al) and silver (Ag) films were sequentially deposited on thermally
oxidized silicon (Si) wafers by electron-beam evaporation to form Ag/Al bilayer
structures. The silver film thickness was kept constant at 200 nm while the Al
thickness varied between 8 and 30 nm. The base pressure of the chamber before
deposition was about 10
–7
Torr. During deposition, the operating pressure was
about 10
–6
Torr. The Ag/Al bilayer structures were annealed in a quartz tube
furnace at temperatures ranging from 400 to 600°C for times between 15 and 120
minutes in a flowing electronic grade (99.99%, with H
2
O < 33 and O+Ar < 10
molar ppm) ammonia (NH
3
) ambient at atmospheric pressure.
Ammonia instead of oxygen was used in order to suppress hillock and hole
formation in the silver layer. A flow rate of 2 l/min was maintained during anneals.
Before each anneal, the annealing chamber was evacuated to about 10 mTorr
followed by a 2.5 minutes purged with NH
3
. The annealed samples were also
allowed to cool in the NH
3
before removal from the chamber. Rutherford
backscattering spectrometry (RBS) using a 2 MeV and 3.7 MeV He
+ 2
beams at 7°
tilt and total accumulated charge of 10–20 µC were used to determine the
composition and thickness of the samples. The 3.7 MeV beam energies correspond
to nitrogen (N) resonance and were used to detect N. The RUMP computer
simulation program was used to analyze the RBS spectra.
6.1.3 Results
In order to understand the kinetics of the aluminum oxide growth and the related
mechanisms, the sample configurations and annealing conditions were varied.
Three Ag/Al bilayer configurations: Ag(200 nm)/Al(8 nm), Ag(200nm)/Al(20 nm),
and Ag(200 nm)/Al(30 nm) were considered. The annealing was carried out at
three different temperatures, namely 400, 500, and 600 °C at four times ~15, 30,
60, and 120 minutes.
6.1.3.1. Formation of Aluminum Oxide Surface Layer
The RBS spectra of the as-deposited Ag(200 nm)/Al(8 nm) bilayers are compared
with those annealed at two different temperatures in an NH
3
ambient for 30
minutes (Figure 6.1). When the samples are annealed at 500°C and higher
temperatures, Al segregates to the free surface and reacts with residual oxygen to
form a thin aluminum oxide surface layer, consisting predominantly of Al and O.
A small shift in the Ag peak position to lower energies is observed for the annealed
samples; this shift is indicative of the formation of the thin surface layer. The
height of the Ag peak is lower for the annealed samples compared to the as-
Integration Issues 85
deposited as a result of the possible inclusion of lighter elements in the silver film.
The surface Al is not clearly visible when the full spectra are shown (Figure 6.1a);
therefore, a blow-up of the Al at the surface is given in Figure 6.1b).
The closeness in mass between Al and Si makes it almost impossible to
separate the interfacial Al peak since it overlaps with the front edge of the silicon
signal. A very thin surface layer of Al-oxide ~12 nm is formed at these
temperatures (400–700°C). No reaction between Al and N from NH
3
ambient to
form AlN was detected in this temperature range. For the same sample
configuration, a thicker oxide layer was formed at 700°C than at 500°C, which
suggests that the oxidation process has a strong temperature dependence (Figure
6.1b).
Figure 6.1. RBS spectra (2 MeV He
+ 2
, 7° tilt) obtained from the Ag(200 nm)/Al(8 nm)
bilayers on SiO
2
before and after annealing at two different temperatures in NH
3
ambient for
30 minutes. Only the Al surface peaks are shown in (b) [8].
86 Silver Metallization
At 2 MeV, the Ag peak shows no significant change when annealed at higher
temperatures except for a small drop in the height. Only the Al peaks will therefore
be shown. Figure 6.2 gives the RBS spectra of the surface Al peaks only for the
Ag(200 nm)/Al(20 nm) bilayer structure. The amount of Al at the surface increases
with annealing time with the largest amount corresponding to the 120 minute
anneals. The spectra further show that the background yields for the annealed
samples is higher than the backscattered yield of the as-deposited sample. This
higher yield is due to the residual Al in the Ag film.
Figure 6.2. RBS spectra (2 MeV He
+ 2
, 7° tilt) obtained from the Ag(200 nm)/Al(20 nm)
bilayers on SiO
2
before and after annealing at 600°C in an NH
3
ambient for 15–120 minutes.
Only the Al surface peaks are shown [8].
Figure 6.3 gives the RBS spectra of the surface Al peaks for the as-deposited
Ag(200 nm)/Al(30 nm) bilayer and that annealed at 600°C for different times,
respectively. Annealing the Ag(200 nm)/Al(30 nm) structure in an ammonia
ambient at 600°C for times 15–120 minutes also resulted in the segregation of Al
to the surface and the subsequent formation of a thin aluminum oxide layer at the
surface. In Figure 6.3, it is evident that the surface Al peaks increases with
annealing time (15–120 minutes). This suggests that the outdiffusion of Al through
Ag is time-dependent.
Although most of the Al segregates to the surface, the high background signals of
the trailing edges are indicative of accumulation of Al in the Ag films at all
annealing times.
Integration Issues 87
Figure 6.3. RBS spectra (2 MeV He
+ 2
, 7° tilt) obtained from the Ag(200 nm)/Al(30 nm)
bilayers on SiO
2
before and after annealing at 600°C in an NH
3
ambient for 15– 120
minutes. Only the Al surface peaks are shown [8].
The RBS spectra showed that in both bilayer structures: Ag(200 nm)/Al(20 nm)
and Ag (200 nm)/Al (30 nm) a high residual Al concentration (~5 at.%) remains in
the Ag films after the encapsulation process.
To show the presence of oxygen in the surface layer and to detect for any
nitridation reaction between Al and N, RBS data were collected at 3.7 MeV (the
resonance energy of N) with a tilt angle of 60°. Figure 6.4 shows the RBS spectra
of the surface peaks for only the as-deposited Ag(200 nm)/Al(30 nm) bilayer and
that annealed at 600°C for 120 minutes. At this high energy, the oxygen in the
surface layer is more clearly visible. By stepping through the full range of N
resonance energies, no nitrogen peak was present at the expected surface position
for N, which suggests that the surface layer mainly consists of Al and O.
Integration of the Al and O peaks in Figure 6.4 yielded an Al-to-O ratio of 0.64.
88 Silver Metallization
Figure 6.4. RBS spectra (3.7 MeV He
+ 2
, 60° tilt) obtained from the Ag(200 nm)/Al(30 nm)
bilayers on SiO
2
before and after annealing at 600°C in an NH
3
ambient for 120 minutes.
Only the surface peaks and positions are shown [8].
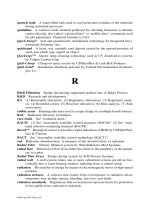
30 40 50 60 70 80 90
0
2
4
6
8
10
12
14
16
400
o
C
500
o
C
600
o
C
Ag(200nm)/Al(20nm) on SiO
2
Thickness (nm)
time
1/2
(s
1/2
)
Figure 6.5. Al oxide thickness as a square root function of time for an
Ag(200nm)/Al(20nm) bilayer system [8]