Engineering Materials and Processes phần 5 pptx
Bạn đang xem bản rút gọn của tài liệu. Xem và tải ngay bản đầy đủ của tài liệu tại đây (344.44 KB, 14 trang )
Thermal Stability 47
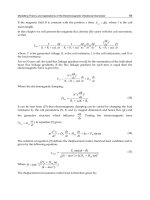
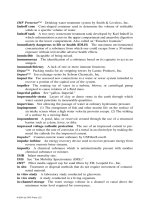
Figure 4.3. Electrical resistivity of Ag, Ag(Al)-I, and Ag(Al)-II thin films on SiO
2
substrates annealed at various temperatures in vacuum for 1 hour [6]
The relatively higher resistivity value of Ag thin film made in this study when
compared to bulk silver resulted from more surface scattering due to its thickness
and the incorporation of a small amount of oxygen during the thin film process.
For the Ag(Al) thin films, the resistivity of samples annealed at 400°C for 1 hour in
vacuum is decreased from the value of as-deposited samples. It is thought that the
enhancement of crystallization and grain growth of thin film obtained by the X-ray
diffraction analysis shown in Figure 4.2 contribute to the decrease of resistivity.
The resistivity of both Ag(Al)-I and Ag(Al)-II thin films is constant after annealing
at 400°C. The difference of absolute value of resistivity between two different
Ag(Al) thin films has also remained constant. This means that the Ag(Al) on SiO
2
is a thermally stable solid solution as confirmed by RBS, XRD, and optical
microscopy. For pure Ag thin films, the resistivity of the sample annealed at 400°C
for 1 hour in vacuum is decreased slightly due to the crystallization and grain
growth although agglomeration is started.
However, resistivity is increased abruptly from 500°C. The Ag thin film on
SiO
2
annealed at 600°C for 1 hour in vacuum has infinite resistivity since the
scattering effect of conduction electrons is increased. The conduction path is
reduced and lost eventually. This fact is consistent with RBS, microstructure
analysis explained above. The interesting fact is that the resistivity of Ag(Al)-II
thin films annealed at 400°C is lower than that of pure Ag thin film annealed at the
48 Silver Metallization
same temperature. The finding is a direct result of the good thermal stability of
Ag(Al) thin films on the SiO
2
layer. The thermal stability of Ag thin films on SiO
2
substrates is enhanced by the addition of aluminum atoms to pure silver [6].
Though the bulk resistivity of Ag is the lowest at room temperature, agglomeration
of silver thin films at higher temperatures has been considered as one of the
obstacles for its use as the interconnect material of electronic devices. The Ag(Al)-
II thin films investigated in this study have comparable resistivity value with pure
Ag thin film at room temperature and maintained lower resistivity than Ag thin
film from 400°C without any diffusion barrier on SiO
2
.
Also, agglomeration does not occur in Ag(Al) thin film up to 600°C on SiO
2
.
Compared with Cu thin film used as interconnect material, Ag(Al) thin film does
not need diffusion barriers to prevent any diffusion through the SiO
2
layer and
agglomeration. It also has a lower resistivity value, which can reduce RC delay,
faster than Cu thin film. These findings can impact metallization of thin film
transistors using low temperature processes, flexible electronics using polymers, as
well as the development of high speed electronic devices.
4.3 Silver Deposited on Paralene-n by Oxygen Plasma Treatment
4.3.1 Introduction
As the features size in modern high density multilevel metallization shrinks,
concerns such as RC delays, high power consumption, and cross talk noise have to
be addressed. One of the solutions for this is to integrate less resistive metal with
low dielectric constant materials. Besides having low dielectric constant, the
materials must have a good adhesion to silicon and to interconnect materials and
thermal stability.
Thermal stability is important to device characteristics and reliability. The
maximum temperature is not set by dielectric deposition process but by other
process requirements such as soldering or annealing. The material is expected to
withstand thermal cycling during annealing as well as occasional temperature
shocks.
Polyimides as low dielectric constant material (dielectric constant 3.5–4) have
been studied. Another class of polymers, parylenes, with even lower dielectric
constant has been proposed for this work. For low resistivity interconnect
materials, copper is being considered as a good candidate. However, copper
diffuses very fast in different materials. Hence, the lower resistivity and relatively
noble metal, silver, is considered here. Gadre and Alford [7] investigated Parylene-
n (Pa-n) and silver for ultra large scale integrated circuits because of their
favorable properties. These include low dielectric constant (2.65), negligible water
take-up, chemical inertness, low temperature deposition, as well as compatibility
with current integrated circuit manufacturing and low resistivity (1.6 µΩ-cm), high
electromigration resistance for silver.
To meet the integration requirements, Pa-n and Ag are studied for critical
reliability issues. Diffusion of Ag in Pa-n was investigated by a series of
Thermal Stability 49
experiments using Rutherford backscattering spectrometry (RBS), secondary ion
mass spectroscopy (SIMS), and X-ray diffraction (XRD) analysis. Variation of
resistivity of silver with temperature was measured using four-point-probe
analysis. Also, adhesion issues of Ag with Pa-n were studied using scratch and tape
test methods. Oxygen plasma induced surface modification shows drastic
improvements in adhesion of Ag with Pa-n without sacrificing any electrical or
diffusion properties [7].
4.3.2 Experimental Details
Parylene-n (Pa-n) films were deposited on Si substrate by chemical vapor
deposition technique. The films were deposited at Paratech Inc. The measured
thickness of the films by optical technique was about 1 mm. All the samples
selected for the experiment were deposited at one time with the same deposition
parameters. Before processing, the above obtained films were cleaned with
acetone, de-ionized water, and dried in dry nitrogen gas.
Silver was deposited on Pa-n by electron beam evaporation technique.
Operating pressure during evaporation was maintained at 3×10
–6
Torr. The actual
pressure during evaporation was 4.5×10
–6
Torr. The expected thickness of Ag was
200 nm.
All of the samples were annealed in a tube furnace at different temperatures
ranging from 100 to 375°C. All anneals were done for 30 minutes under vacuum in
a carrousel furnace. The base pressure was 5×10
–8
Torr and actual pressure during
annealing was approximately 4×10
–7
Torr. After the anneal was completed the
samples were cooled in a load chamber for 15 minutes before being removed
completely from the furnace to avoid sudden decrease in temperature. X-ray
diffraction analysis was performed for structural characterization of Ag films in a
Philips X’Pert multipurpose diffractometer (MPD) diffractometer using
conventional θ/2θ geometry. CuK-α radiation source with an operational voltage
of 45 kV and a filament current of 40 mA was used.
X-ray diffraction of Pa-n samples in as-deposited and annealed conditions was
also performed to determine the crystallinity and any phase change.
Conventional RBS measurements with a 3.7 MeV He
+2
ion beam, 7° incident
angle, and 172° scattering angle were primarily used for analyzing silver and
dielectric interaction and thickness measurements. The beam energy of 3.7 MeV
was selected for enhancing the carbon signal [8] from Pa-n.
SIMS was performed for as deposited and annealed samples of Ag/Pa-n
system. Camera IMS3f SIMS was used to perform depth profiling. The crater depth
was measured on a DekTek profilometer. Ag was removed from the Pa-n using
nitric acid. The samples were immersed in 50% nitric acid (50%HNO
3
+50%H
2
O
by volume) for 30 s to remove silver film completely. The silver stripped Pa-n
samples were coated with gold to avoid strong charging.
Four-point-probe technique was used for sheet resistance measurements. The
sheet resistance was measured on both Ag/Pa-n as deposited as well as annealed
samples. In situ resistivity measurements were done for the Ag/Pa-n sample during
thermal annealing. The continuous sheet resistance and temperature measurements
were recorded using a computer program. The ramp rate was 20°C/min and
50 Silver Metallization
samples were heated in a vacuum. The samples were cooled from 375 to 200°C in
the same furnace and resistivity measurements were again recorded.
Adhesion analysis Ag/Pa-n and Pa-n/Si was done using scratch [9] and tape
tests. It consisted of a fixed load applied per test run. The load was increased in 1.1
g increments until the film completely detached from the surface. The stylus made
of 20-mm-diameter diamond tip was drawn over the surface.
The scratches were analyzed using optical and scanning electron microscopes.
Tape test was used as a preliminary adhesion test to screen out poorly adhering
films before proceeding with system optimization. The 180° tape test prescribed by
the American Society for Testing and Material’s designation D3359-95a [10] was
performed with Ag/Pa-n films. A pressure sensitive tape (Permecel 99) with
minimum adhesional strength of 45 g/mm was applied over a grid of lines
manually made by a diamond tip scriber. To enhance adhesion between Ag and
Pa-n, surface modification of Pa-n was performed using an oxygen plasma.
Parylene-n was exposed to an oxygen plasma of 50 W plasma for 60 seconds. The
exposed surfaces were analyzed using atomic force microscopy (AFM) and
compared to the as-deposited sample. Ag is then deposited on Pa-n in a similar
way explained above. Some samples were also annealed. RBS and four-point-
probe analysis of the plasma treated surface were performed to check any diffusion
or change in electrical properties of silver due to plasma exposure.
4.3.3 Results
4.3.3.1 Phase Change in Pa-n upon Annealing
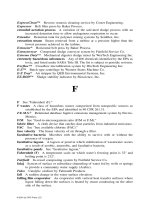
Figure 4.4 shows the XRD data of Pa-n film deposited on Si substrate. It was
clearly observed that the as-deposited sample shows a peak at 2θ equal to 16.6°.
This peak corresponds to α phase of Pa-n. The peak completely vanishes at and
above 250°C and a new peak at 20° is formed. This peak corresponds to β phase of
Pa-n. This is confirmed with other researchers showing the phase transition of
Parylene-n. Literature reveals the phase transformation temperature of Pa-n as
230°C. The α-Pa-n is a stable phase below 230°C and completely transformed to
β-Pa-n, which is irreversible and stable after cooling down to room temperature
Increase in intensity of the β-Pa-n indicates an increase in the crystallinity of the
Pa-n as it is annealed at higher temperatures.
Thermal Stability 51
Figure 4.4. X-ray diffraction patterns (under θ/2θ scan geometry) of Pa-n at different anneal
temperatures. The figure clearly shows phase change in Pa-n. The peak corresponding to α
Pa-n vanishes at 250°C and the new peak of β Pa-n is observed [7].
4.3.3.2 Compositional Changes of Ag on Pa-n upon Annealing
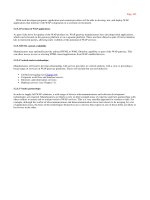
The silver film thickness obtained from RBS was approximately180 nm and for
Pa-n it was 0.8 mm. Experiments showed no significant changes in Ag films upon
annealing. Figure 4.5 shows a comparison of the as-deposited and annealed Ag
films on Pa-n. Energy of 3.7 MeV was used for RBS analysis and corresponds to
the resonance energy for nitrogen [8]. It also enhances carbon and oxygen signals
in the spectra and hence was used to clearly distinguish carbon signal from Pa-n.
Literature shows that silver diffuses in Pa-n above 350°C for 30 minute anneals.
Our data suggest no RBS detectable diffusion of Ag in Pa-n even at 375°C and 1
hour anneals.
52 Silver Metallization
Figure 4.5. Typical RBS spectra of as-deposited and 375°C annealed Ag/Pa-n films. Both
spectra show no diffusion of Ag when deposited on Pa-n [7].
4.3.3.3 Sheet Resistance Variation upon Annealing
In situ four-point-probe measurements of Ag on Pa-n were performed as explained
in the previous section. The obtained sheet resistance, values of Ag was converted
to resistivity by using thickness values obtained from RBS. The plot of resistivity
as a function of temperature is shown in Figure 4.6. Also, ramp up and cool down
data are plotted in the same graph. As both cool down and ramp up observations
follow the same line, it can be said that there is no drastic change in the silver film
deposited on the Pa-n. This analysis shows resistivity changes linearly with
temperature. The ex situ analysis of resistivity of Ag on Pa-n is shown in Table 4.1.
The variation of resistivity can be best explained with XRD analysis mentioned
below.
Thermal Stability 53
Figure 4.6. In situ analysis of resistivity variation of Ag on Pa-n with temperature by four-
point-probe measurements. The resistivity follows linear relationship with temperature.
(ο-heating, Δ-cooling, — represents linear fit while heating and represents linear fit
while cooling down) [7].
Table 4.1. Resistivity of Ag/Pa-n with annealing temperature [7]
Figure 4.7 shows X-ray diffraction pattern of Ag on Pa-n. Ag film shows
prominent (111) peak. The intensity of (111) peak increases up to 300°C and then
suddenly decreases for 350°C. X-ray diffraction does not reveal any phase
formation of Ag with Pa-n even at elevated temperatures. Annealing above 400°C
decomposes Pa-n films.
Sample
As-deposited
100°C
250°C
300°C
350°C
R µΩ-cm
2.73
2.55
1.95
1.87
3.48
54 Silver Metallization
Figure 4.7. XRD diffraction patterns (under θ/2θ scan geometry) of Ag/Pa-n at different
anneal temperatures [7]
4.3.3.4 Adhesion Analysis
Table 4.2 shows total load in grams required to remove film of Pa-n from the Si
substrate completely after performing the scratch test. It was observed that load
decreases with increasing annealing temperature suggesting deterioration of
adhesion of Pa-n with Si substrate. Table 4.2 also shows that the load required for
removing Ag film completely from Pa-n increases with increasing annealing
temperature. This indicates stronger adherence of Ag with Pa-n at elevated
temperatures. To support the results from the scratch test, results from the adhesion
tape test were examined. If more than 25% of the total tested film was removed,
then the sample was considered to be ‘‘failed’’ in the adhesion test.
Table 4.2. Scratch test results of failure load in grams [7]
Sample
As-deposited
250°C
300°C
350°C
Pa-n/Si
8.0
6.9
5.5
4.5
Ag/Pa-n/Si
4.4
4.4
5.5
5.5
Thermal Stability 55
Table 4.3 shows the results of the tape test for different conditions. The as-
deposited Ag film on Pa-n shows the removal of more than 90% of the film,
indicating very poor adhesion. The annealing above 250°C improves the test
results significantly. Though annealing increases the adhesion of silver to parylene
to some extent, surface modification of parylene even shows better results. AFM
was used to compare the as-deposited and plasma-treated parylene surfaces at an
atomic scale. Oxygen plasma induces damage to the parylene surface and hence
increases its roughness. The rough films are believed to increase mechanical
interlocking between top silver and bottom parylene film, thereby increasing the
adhesion significantly. Tape test after surface modification shows that adhesion
between Ag and Pa-n is even stronger than Pa-n and Si substrate. Four-point-probe
and RBS analysis performed on the above samples show no drastic difference as
compared to untreated samples.
Table 4.3. Tape test results for Ag/Pa-n. If more than 25% of total film was removed, then
the sample considered to be failed [7]
Sample
Treatment
Tape test criteria
Remarks
Ag/Pa-n
As-deposited
Fail
90% silver film
removed
Ag/Pa-n
250°C
Pass
20% silver film
removed
Ag/Pa-n
300°C
Pass
10% silver film
removed
Ag/Pa-n
350°C
Pass
<2% silver film
removed
Ag/Pa-n
375°C
Pass
<2% silver film
removed
4.3.4 Discussion
Results of the above experiments indicate very little tendency of silver to diffuse in
parylene. Secondary ion mass spectroscopy reveals an insignificant amount of
silver in parylene at 375°C. It was assumed here that diffusion takes place
according to Fick’s law. The plot of natural log of concentration of silver against
square of depth was used to find the diffusion coefficient of silver. The slope of the
graph was equated to 1/4Dt, where D is diffusion coefficient and t is time in
seconds. For silver sample annealed at 375°C for 30 minutes, calculated diffusion
coefficient was 1.47×10
–14
±3% cm
2
/s. This calculated diffusion coefficient is
smaller than previously recorded values. The value is also approximately equal to
the as-deposited silver on parylene, suggesting that silver concentration in the
56 Silver Metallization
parylene remains constant during annealing. This insignificant silver diffusion in
parylene can be explained as follows.
During annealing, Pa-n changes from α Pa-n, which has monoclinic crystal
structure to β Pa-n, which is trigonal. During this transformation, crystallinity of
parylene increases. This was shown by XRD in Figure 4.4. Typical parylene is
only 57% crystalline and the remainder is amorphous. Though its crystallinity
increases with annealing it never reaches 100% crystallization. The amorphous
region in parylene may be present between the crystalline structure. The whole
surface can be considered as long crystalline chains linked together with
amorphous regions forming a closed structure. This closed structure is believed to
prohibit diffusion of silver in Pa-n. Some researchers have shown a web-like
structure at the interface of Pa-n and Cu, increasing Cu diffusion drastically. No
such web structure was observed at the Pa-n and Ag interface when examined at
high magnification using scanning electron microscopy. An experiment was
conducted to examine the effect of phase change of Pa-n on silver diffusion. Pa-n
was preheated to 250°C for 30 minutes to allow complete phase transformation
from α-phase to β-phase and then cooled down. The α to β transformation is
irreversible. β Pa-n is more crystalline as compared to α Pa-n and hence it was
more open. Ag is deposited at room temperature on the pre-annealed sample and
then the system is again annealed at 375°C for 30 minutes in vacuum. SIMS
analysis on annealed sample does not reveal any diffusion of silver in Pa-n. This
shows that phase change of Pa-n does enhance diffusion of silver. The atomic size
is another effective factor for silver atom. Diffusion is recorded for copper and
aluminum before in Pa-n. Copper and aluminum atom sizes are 0.135 and 0.126
nm, respectively. These are smaller as compared to silver atom, which has a
covalent radius of 0.152 nm. Thus it requires more space to pass through Pa-n
structure underneath it. Silver has a melting point of 962°C, which is not enough to
thermally excite silver atoms at 375°C to go under diffusion.
Thermal stability of silver is explained using the four-point-probe technique. It
was observed during in situ resistivity variation with temperature that the cool
down curve exactly follows the ramp up curve. This rules out any formation of
voids in silver film while annealing. This suggests that silver film maintained its
continuity up to 375°C during annealing. Also, the mechanical and thermal strains
produced during deposition and annealing are not significant enough to cause any
discontinuity in silver or parylene films. Adhesion is very important in determining
durability of thin film devices. Here qualitative study of adhesion of Pa-n with
silicon substrate as well as top silver layer was presented. Si wafers were cleaned
in HF solution before depositing Pa-n on it by vapor deposition at Paratech Inc.
The adhesion was examined using the scratch test. It was observed that
adhesion between Pa-n and Si substrate deteriorates with annealing. Pa-n is a
chemically inert polymer and it does not form any chemical bond with Si substrate.
This indicates inherent adhesion of Pa-n with Si is poor. In the absence of any
adhesion promoter and surface treatment, two smooth surfaces result in weak
adhesion. The possibility of small silicon dioxide at the interface between Pa-n and
Si and defects may cause a reduction in adhesion. Formation of chemical bonds is
an important way to achieve interfacial adhesion. For silver and the Pa-n system
there does not exist any chemical interactions, such as second phase formation or
Thermal Stability 57
intermixing with each other, resulting in weak adhesion. This was confirmed by X-
ray diffraction and SIMS results. Small dipole–dipole interaction between the two
though cannot be neglected. However, the tape test shows improved adhesion
between silver and parylene with annealing. The reason for this is not fully
understood at this time. Future study will be required to understand this behavior.
Although annealing increases the adhesion, it is not enough for reliable device
operation. One way to improve the adhesion is by surface treatment of Pa-n.
Oxygen plasma was used to treat the Pa-n surface. Plasma treated Pa-n showed
evidence of increased roughness. The plasma treated samples were analyzed using
the tape test for adhesion. It was observed that adhesion between Ag and Pa-n is
stronger than even Pa-n and Si substrate. The tape test shows complete removal of
Ag/Pa-n together from Si substrate. Due to increased roughness, contact area
between Ag and Pa-n was increased, improving adhesion tremendously. Care
should be taken while doing plasma treatment, as excess power or long time
exposure can etch Pa-n completely. Formation of single and double bonds between
carbon and oxygen [11] during plasma treatment may have helped increase
adhesion between Ag and Pa-n.
4.3.5 Conclusions
The thermal stability of Pa-n as interlayer low dielectric material and silver as low
resistivity metal was studied. No interaction or phase formation between Ag and
Pa-n was observed. Resistivity analysis by four-point-probe shows the structure to
be electrically stable even at high annealing temperatures (~375°C). Phase change
of Pa-n while annealing does not affect diffusion properties of Ag in Pa-n. SIMS
gave a diffusion coefficient of 1.47×10
–14
±3% cm
2
/s for as-deposited as well as
annealed samples, indicating negligible diffusion of silver in Pa-n. Although
adhesion between Ag and Pa-n is poor, it is shown that drastic improvement can be
obtained by surface treatment of Pa-n with oxygen plasma without sacrificing
thermal and electrical stability of the system [7].
4.4 Effects of Different Annealing Ambients on Silver- luminum
Bilayers
4.4.1 Introduction
In a study of the formation of a surface protection layer for Ag from a Ag/Al
bilayer structure, Wang et al. [12] reported that high temperatures increased the
transport of Al through the Ag layer and the reaction of Al with NH
3
or O
2
on the
surface. That work centers on the mechanism governing the outdiffusion of Al
through the Ag. Many researchers have investigated the phenomenon of hillock
growth during annealing. Similarly, the phenomena of hole growth and
agglomeration have been observed by several workers for thin films annealed
under varying conditions of treatment.
A
58 Silver Metallization
In a study of the dependence of silver agglomeration on ambient annealing
conditions, it was found that no agglomeration occurred in samples annealed in an
ambient containing oxygen or water. However, significant agglomeration of silver
films on SiO
2
occurred when annealed in air. It has been concluded from this study
that the agglomeration is caused by the absorption of Cl from the air, and that this
absorption can be prevented by passivating the surface with a Ti-oxide layer. This
was accomplished by annealing a Ag/Ti/SiO
2
structure in an oxygen ambient.
Upon annealing, Ti segregates to the surface to form a thin Ti-oxide surface layer
and some of the Ti reacts with the underlying SiO
2
substrate to improve the
adhesion of Ag to the dielectric.
4.4.2 Experimental Details
Aluminum (Al) and silver (Ag) films were sequentially deposited on thermally
oxidized silicon (Si) wafers by electron-beam evaporation to form Ag(200
nm)/Al(8 nm) bilayer structures. The base pressure of the chamber before
deposition was ~10
–7
Torr. During deposition, the operating pressure was ~10
–6
Torr. Samples were then annealed in a Lindberg single-zone quartz-tube furnace
for 30 minutes at temperatures ranging from 300°C–700°C in three different
ambients. The ambients were argon (Ar), helium–hydrogen (He–H), and electronic
grade (99.99%, with H
2
O<33 and O
2
+Ar<10 molar ppm) ammonia (NH
3
). Prior to
annealing the samples, the furnace was pumped down and purged at least three
times with the respective gases. A gas flow rate of ~2 1/min was maintained during
anneals.
Rutherford backscattering spectrometry (RBS) using a 3.0 or 3.7 MeV He
+2
beam at 7° tilt and total accumulated charge of 10 µC was used to determine the
composition and thickness of the samples. Auger electron spectroscopy (AES)
analyses of the Ag/Al structures were carried out by using a Perkin–Elmer PHI 600
scanning Auger system using a primary beam energy of 5 keV and current of 50
nA. The depth profiles were acquired by sputtering with 3.5 keV Ar ions. The ion
beam was rastered over a 2 mm
2
area. A JEOL-JSM 840 scanning electron
microscope operated at 5–15 kV and in secondary mode was used to evaluate the
surface morphology of the samples. The RUMP computer simulation program was
used to analyze the RBS spectra. Sheet resistance was obtained with the van der
Pauw four-point-probe and the resistivity was determined from the sheet resistance
and the film thickness.
Thermal Stability 59
Energy (MeV)
Channel
Yield
4.4.3 Results
4.4.3.1 Aluminum Transport in Silver Films
1. Argon Ambient
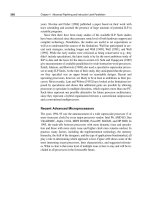
Figure 4.8 compares the 3.0 MeV RBS spectrum of the as-deposited Ag(200
nm)/Al(8 nm) bilayer with that annealed at three different temperatures for
30 minutes in a flowing Ar ambient.
When the samples are annealed at 400°C and higher temperatures, Al segregates to
the free surface and reacts with residual oxygen to form a thin aluminum-oxide
layer, as indicated by the presence of the surface Al peak (labeled ‘‘surface Al’’)
and surface O peak (labeled ‘‘surface O’’). The shift in the Ag signal to lower
energies is due to this surface layer. Due to the small mass separation, the Al and
Si signals overlap. However, the peak labeled ‘‘interfacial Al’’ indicates the
presence of Al at the interface. The RUMP simulation was used to simulate the
RBS spectra. The simulation shows that the surface aluminum oxide layer is
Figure 4.8. RBS spectra (3 MeV He
+2
, 7° tilt) obtained from a Ag(200 nm)/Al(8 nm) bilayer
on a SiO
2
structure annealed in Ar at three different temperatures for 30 minutes [16]
60 Silver Metallization
about 13 nm thick for the sample annealed at 700°C and that the thickness of the
Ag layer is ~180 nm thick. Figure 4.9 gives the RBS spectra of the surface Al
peaks only. It is evident that the amount of Al at the surface increases with
annealing temperature, with the largest amount corresponding to the 700°C anneal.
The spectra further show that the background yields for the annealed samples is
higher than the backscattered yield of the as-deposited sample. This higher yield
(channel 295–298) is due to the residual Al in the Ag film. According to the
RUMP simulation, the residual Al concentration is ~1 at.% at 700°C.
Figure 4.9. RBS spectra (3 MeV He
+2
, 7° tilt) of the diffusion barriers before and after
being annealed in flowing Ar for 30 minutes at three different temperatures [16]
Elemental distribution and depth profiling were obtained from AES analyses,
Figure 4.10. Figure 4.10(a) shows the depth profile of the as-deposited sample for
the interfacial region only. It clearly shows the Al at the interface. The presence of
the oxygen and aluminum signals near the surface region for temperatures greater
than 400°C confirms the outdiffusion of Al to the surface and the subsequent
formation of a thin aluminum oxide (Figures 6.10(b) and 6.10(c)). Within the
detection limits of AES, no accumulation of Al in the Ag or unreacted interfacial
aluminum could be detected for temperatures ≥400°C.
Energy (MeV)
Channel
Yield