Báo cáo khoa học: "Distance-dependent competition measures for eucalyptus plantations in Portugal" doc
Bạn đang xem bản rút gọn của tài liệu. Xem và tải ngay bản đầy đủ của tài liệu tại đây (931.98 KB, 13 trang )
Original
article
Distance-dependent
competition
measures
for
eucalyptus
plantations
in
Portugal
Paula
Soares*
Margarida
Tomé
Department
of
Forestry,
Tapada
da
Ajuda,
1399
Lisboa
Codex,
Portugal
(Received
17
March
1998;
accepted
22
February
1999)
Abstract -
Data
from
permanent
plots
and
spacing
trials
of
Eucalyptus
globulus
Labill.
were
used
to
study
distance-dependent
com-
petition
measures.
The
data
were
divided
into
three
subsets
representing
different
stages
of
stand
development
and
therefore
different
levels
of
competition.
Different
formulations
of
each
type
of
index
were
tested.
The
rules
for
the
selection
of
competitors
as
well
as
the
mathematical
formulation of
each
index
were
considered
in
the
analysis.
The
linear
relationship
between
the
dbh
and
the
distance
to
which
a
tree
can
compete -
characteristic
of
the
selection
of
competitors
based
on
the
basal
area
factor -
was
not
consistent
over
time.
Rules
defined
as
asymptotically
restricted
non-linear
functions
of
tree
size
were
designed
to
overcome
this
problem.
The
use
of
a
fixed
number
of
competitors
was
also
tested.
The
evaluation
of
the
prediction
ability
of
each
index
was
based
mainly
on
its
perfor-
mance
in
multiple
linear
regression
functions
for
the
prediction
of
the
tree
basal
area
annual
increment.
The
results
showed
the
supe-
riority
of
the
indices
based
on
the
Richards’
function
for
selecting
competitors.
This
supremacy
was
more
evident
when
trees
in
the
lower
diameter
classes
were
not
suppressed.
When
the
asymmetric
competition
was
evident
the
area
potentially
available
indices
showed
the
best
performance.
(©
Inra/Elsevier,
Paris.)
distance-dependent
indices
/
selection
of
competitors
/
prediction
ability
/
stand
development
/
Eucalyptus
globulus
Labill.
/
plantations
Résumé -
Indices
de
compétition
dépendants
de
la
distance
pour
plantations
d’eucalyptus
au
Portugal.
Pour
étudier
des
indices
de
compétition
dépendants
des
distances,
on
utilise
des
données
des
parcelles
permanentes
et
d’essais
d’espacement
d’Eucalyptus
globulus
Labill.
Les
données,
divisées
en
trois
sous-groupes,
représentent
différentes
étapes
de
développement
du
peu-
plement,
donc,
différents
niveaux
de
compétition.
Diverses
formulations
de
chaque
type
d’indice
de
compétition
sont
testées.
Les
règles
pour
la
sélection
des
compétiteurs
ainsi
que
la
formulation
mathématique
de
chaque
indice
sont
testées
dans
cette
analyse.
La
relation
linéaire
établie
entre
le
diamètre
et
la
distance
jusqu’à
laquelle
chaque
arbre
peut
concurrencer
n’est
pas
consistante
dans
le
temps.
Aussi,
on
propose
des
règles
basées
sur
des
fonctions
non
linéaires
restreintes
par
une
asymptote
supérieure.
L’utilisation
d’un
nombre
fixe
de
compétiteurs
est
aussi
testé.
L’évaluation
de
la
capacité
de
prédiction
de
chaque
indice
est
basée
sur
sa
performance
en
fonction
d’une
régression
multilinéaire
pour
la
prédiction
de
l’accroissement
annuel
en
surface
terrière
au
niveau
individuel.
Les
résultats
mettent
en
évidence
la
supériorité
des
indices
de
compétition
basés
sur
la
fonction
de
Richard
pour
la
sélection
des
compéti-
teurs.
Cette
suprématie
est
plus
évidente
au
moment
où
les
arbres
des
classes
de
diamètre
le
plus
bas
ne
sont
pas
supprimés
naturelle-
ment.
Lorsque
la
compétition
asymétrique
est
évidente,
les
indices
basés
sur
le
polygone
de
Voronoï
montrent
une
meilleure
perfor-
mance.
(©
Inra/Elsevier,
Paris.)
indices
dépendants
de
la
distance
/
sélection
des
compétiteurs
/
capacité
de
prédiction
/
développement
du
peuplement
/
Eucalyptus
globulus
Labill.
/
plantations
*
Correspondence
and
reprints
1.
Introduction
Competition
may
be
defined
as
an
interaction
between
individuals
brought
about
by
a
shared
requirement
for
a
resource
in
limited
supply,
and
leading
to
a
reduction
in
the
survival,
growth
and/or
reproduction
of
the individ-
ual
concerned
[2].
The
effect
of
competition
on
growth
of
individual
trees
has
long
been
studied
in
an
attempt
to
predict
tree
growth
as
accurately
and
precisely
as
possi-
ble.
Distance-dependent
competition
indices
are
used
to
predict
the
performance
of
focal
individuals
as
a
function
of
the
interference
from
a
localised
subset
of
other
plants
[5].
These
indices
incorporate
in
a
mathematical
formu-
lation
the
number,
dimensions
and
location
of
certain
neighbours
that
are
selected
as
competitors
according
to
an
empirical
rule.
Conceptually,
one
would
expect
some
improvement
in
precision
when
comparing
models
that
incorporate
distance-dependent
measures
as
regressors
against
simpler
models
that
do
not
use
them.
However,
most
of
the
comparisons
between
distance-dependent
and
distance-independent
individual
tree
growth
models
do
not
report
the
expected
differences
in
prediction
abili-
ty.
One
of
the
main
reasons
for
this
poor
efficiency
of
distance-dependent
competition
indices
in
explaining
tree
growth
is
the
fact
that
the
processes
controlling
inter-tree
competition
are
not
well
known,
making
it
impossible
to
develop
biologically
consistent
competi-
tion
indices.
Generally,
the
competition
index
formula-
tion
simply
implies
that
competition
is
greater
if
the
sub-
ject
tree
has
more
neighbours
(selected
with
an
empirical
rule),
if
these
neighbours
are
larger
and
if
they
are
close
[3, 7-9,
11,
14,
16, 23].
Depending
on
the
respective
for-
mulation,
competition
indices
implicitly
assume
an
asymmetric
or
symmetric
partitioning
of
plant
interfer-
ence
processes
into
neighbourhood
effects
and
are
then
used
to
predict
growth
of
trees
growing
in
stands
of
dif-
ferent
ages
independently
of
the
stage
of
stand
develop-
ment.
Competition
processes
have been
defined
accord-
ing
to
two
basic
models:
symmetric/asymmetric
and
one-sided/two-sided
competition
[4,
18,
31,
32].
In
two-
sided
competition
resources
are
shared
(equally
or
pro-
portionally
to
size)
by
all
the
trees
while
in
one-sided
competition
larger
trees
are
not
affected
by
smaller
neighbours
[4,
33].
When
there
is
perfect
sharing
relative
to
size,
competition
is
symmetric
[4].
In
this
study
one-
sided
competition
is
considered
as
an
extreme
case
of
asymmetric
competition
and
two-sided
competition
is
considered
as
being
symmetric
or
asymmetric
according
to
whether
or
not
the
sharing
of
resources
is
proportional
to
the
size
of
the
individuals.
Recently,
some
indices
have
used
crown
measures,
therefore
reflecting
competition
for
light
with
some
suc-
cess
[5,
14, 21, 22].
However,
crown
measures
are
not
always
available
and,
it
has
also
been
shown
for
some
species
that,
in
the
early
stages
of
a
stand,
competition
for
light
may
not
be
present,
although
the
effects
of
com-
petition
for
water
and
nutrients
are
evident.
Additionally,
even
when
competition
for
light
is
the
main
factor
con-
trolling
individual
plant
growth,
two-sided
competition
for
water
and
nutrients
also
controls
plant
growth
[24].
The
objective
of
the
research
described
in
this
paper
was
to
select
a
competition
index
for
future
use
to
model
individual
tree
growth.
Some
of
the
existing
competition
indices
were
analysed
with
improvements
being
pro-
posed
when
appropriate.
Particular
attention
was
given
to
the
rules
for
the
selection
of
competitors
in
order
to
assess
their
importance
in
the
prediction
ability
of
the
indices
in
comparison
with
the
index
formulation.
It
was
also
our
objective
to
test
how
the
prediction
ability
of
different
competition
indices
(both
formulation
and
rule)
depends
on
the
stage
of
development
of
the
stand,
i.e.
if
there
is
an
overall
best
index
applicable
during
all
the
life
of
the
stand
or
not.
The
analysis
was
based
on
data
from
eucalyptus
stands
in
Portugal,
managed
in
planta-
tions
without
thinnings
and
without
density-dependent
mortality,
in
relation
to
which
a
detailed
study
on
the
changes
in
structure,
variability
and
relative
growth
rate
pattern
under
different
intraspecific
competition
gradi-
ents
was
available
[24].
2.
Data
Eucalyptus
globulus
is
a
fast-growing
species
that
was
introduced
in
Portugal
150
years
ago.
At
present
it
is
the
third
most
represented
forest
species
in
Portugal,
cover-
ing
20.7
%
of
the
total
forestland
and
occupying
an
area
of
3
358.8
x
10
3
ha
[10].
The
success
of
eucalyptus
was
a
consequence,
in
part,
of
good
environmental
conditions
in
a
substantial
part
of
the
country
for
eucalyptus
growth.
In
fact,
eucalyptus
species
are
highly
productive
even
in
areas
where
drought
and
nutrient
stress
occur
in
spite
of
the
fact
that
its
productivity
is
strongly
dependent
on
soil
water
and
nutrient
availability
[13,
19].
In
Portugal,
eucalyptus
plantations
are
mainly
used
by
the
pulp
industry
and
the
trees
are
planted
at
the
final
density -
thinning
and
pruning
practices
are
not
usually
carried
out.
These
stands
are
intensively
managed
as
a
short
rotation
coppice
system
in
which
the
first
cycle
of
plant-
ed
seedlings
(single
stem)
is
followed
by
two
or
three
coppiced
stands,
with
an
average
cutting
cycle
of
10-12
years.
Data
from
permanent
plots,
two
spacing
trials
and
a
fertilisation
and
irrigation
experiment
of
Eucalyptus
globulus
Labill.
in
first
rotation,
all
located
in
the
centre
coastal
region
of
Portugal,
were
used.
The
principal
cri-
terion
for
the
selection
of
these
plots
was
the
availability
of
tree
co-ordinates
or
the
possibility
of
obtaining
them.
This
data
set
includes
ten
plots
from
the
Alto
do
Vilão
spacing
trial
with
a
range
of
densities
between
500
and
1667
trees
ha-1
.
These
plots
were
used
by
Tomé
[27]
in
a
study
involving
the
evaluation of
distance-dependent
competition
measures
of
different
types.
The
permanent
plots
and
the
spacing
trials
were
remeasured
at
approxi-
mately
annual
intervals;
dbh
of
each
tree,
a
sample
of
heights
and/or
dominant
height
were
obtained
in
each
measurement.
Data
about
crown
radius
or
height
of
the
base
of
the
live
crown
were
not
available.
Dbh
and
height
of
each
tree
were
measured
in
the
fertilisation
and
irrigation
experiment
at
monthly
intervals
during
the
first
15
months,
every
2
months
until
the
end
of
1987
and
twice
a
year
thereafter.
This
experiment
was
carried
out
at
a
3
x
3-m
spacing.
Table
I
presents
a
summary
of
the
principal
variables
that
were
gathered
in
the
37
plots
selected.
An
initial
set
of
54
plots
was
available
but
some
of
them
were
elimi-
nated
by
the
use
of
the
basal
area
factor
(BAF)
1
m2
ha-1
as a
rule
to
define
the
border
trees
in
the
calculation
of
the
distance-dependent
indices.
The
border
trees
were
selected
for
each
remeasurement
in
every
plot
as
a
func-
tion
of
BAF
=
1
and
the
maximum
diameter
of
each
remeasurement.
The
growth
periods
not
corresponding
to
1
year
(or
multiples
of
that)
were
eliminated
as
euca-
lyptus
is
a
species
characterised
by
free
growth
1.
However,
variations
of
2
months
were
considered
acceptable.
After
these
eliminations
there
were
101
growth
periods
available
and
a
total
number
of observa-
tions
at
the
tree
level
of
5
409.
1
free
growth -
"involves
elongation
of
shoots
by
simultaneous
initiation
and
elongation
of
new
shoot
components
as
well
as
expansion
of
performed
parts.
Such
plants,
which
include
euca-
lyptus, ,
continue
to
expand
their
shoots
late
into
the
sum-
mer" [15].
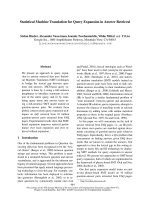
Figure
I
presents
the
site
index
versus
age
and
the
stand
density
versus
tree
size
graphics.
These
provide
a
good
summary
of
the
site
and
stand
conditions
represent-
ed
in
the
data
base
[30].
Site
index
was
expressed
as
the
mean
height
of
the
dominant
trees
(100
largest
dbh
trees
per
hectare)
at
a
base
age
of
10
years
and
it
was
obtained
directly
by
interpolation
or
estimated
according
to
Tomé
[28].
As
can
be
seen
in figure
11
there
is
a
representative
range
of
sites
and
ages
in
the
data
set.
The
fertilisation
and
irrigation
experiment
is
well
individualised
corre-
sponding
to
high
site
indices
and
lower
ages.
Most
of
the
plots
were
monitored
more
than
eight
times.
Figure
1II
shows
that
most
of
the
plots,
excluding
the
spacing
trials,
had
a
similar
plantation
density.
In
fact,
the
pulp
compa-
nies
used
the
3
x
3-m
spacing
and
small
variations
around
it
during
the
plantation
period
under
analysis
(table
I).
At
present
there
is
a
broader
range
of
spacings
and
therefore
new
plots
should
be
added
to
this
database
to
obtain
more
general
results.
In
the
plots
used,
natural
mortality
(self-
thinning)
was
not
found,
reflecting
the
under-stocking
of
the
eucalyptus
plantations
in
Portugal.
Two
plots,
clearly
shown
in figure
1II,
are
an
exception,
with
values
of
mor-
tality
of
23
%
at
15
years
and
40
%
at
25
years.
3.
Methods
3.1.
Indices
used
Most
of
the
authors
who
analysed
existing
competi-
tion
indices
[e.g.
1,
3,
18,
29]
classified
them
into
dis-
tance-weighted
size
ratio
functions,
point
density
mea-
sures,
area
overlap
indices
and
area
potentially
available.
These
indices
as
well
as
the
unilateral
version
of
each
index
and
the
modified
version
developed
by
Tomé
and
Burkhart
[29]
were
also
analysed
(table
II).
The
unilater-
al
as
well
as
the
modified
indices
reflect
one-sided
com-
petition.
An
analysis
of
the
formulation
of
the
modified
indices
suggests
that
they
give
an
indication
of
the
domi-
nance
of
the
tree
in
relation
to
its
closer
neighbours.
The
usual
area
overlap
and
distance-weighted
size
ratio
indices
are
typically
two-sided
while
the
area
potentially
available
can
be
considered
as
assuming
a
two-sided
asymmetric
competition,
the
level
of
asymmetry
depend-
ing
on
the
weight
given
to
the
tree
size
in
the
definition
of
the
area
potentially
available.
One
aspect
taken
into
consideration
in
the
study
of
distance-dependent
competition
measures
is
the
defini-
tion
of
border
trees.
Two
different
approaches
can
be
used:
1)
to
simulate
the
border
trees,
which
involves
the
reflection
or
translation
of
the
trees
inside
the
plot
to
form
a
border
strip
with
trees
similar
in
size
and
distribu-
tion
with
the
plot;
2)
to
define
the
border
trees
from
the
trees
on
the
plot
and
close
to
the
plot
limit.
In
the
first
case,
approaches
based
on
the
linear
expansion
method
can
also
be
utilised
[17].
In
fact,
the
use
of
these
simula-
tion
methodologies
on
applications
of
the
competition
indices
can
be
accepted
but
when
the
objective
is
the
comparison
of
the
prediction
ability
of
alternative
indices
these
methodologies
may
bias the
results.
In
that
case
the
measurement
of
real
border
trees
should
be
con-
sidered.
Accordingly,
in
this
study
the
border
trees
were
selected
from
the
trees
inside the
plots
so
that
every
sub-
ject
tree’s
possible
neighbours
had
been
measured.
3.2.
Rules
to
select
competitor
trees
To
analyse
the
influence
of
the
rules
to
select
com-
petitors
on
the
ability
of
the
index
to
predict
growth
some
traditional
rules
and
new
rules
were
tested.
The
rules
to
select
competitors
are
usually
based
on
a
fixed
distance
or
a
fixed
number
of
trees,
on
overlap
areas
or
on
basal
area
factors,
depending
on
the
type
of
competi-
tion
index
used.
The
area
potentially
available
index
represents
the
area
of
the
smaller
polygon
built
with
the
perpendiculars
relative
to
the
subject
tree
and
its
neighbours,
and
selects
as
competitors
the
trees
whose
perpendiculars
contribute
to
the
definition
of
this
polygon.
In
this
study
a
maxi-
mum
of
35
trees
was
used
as
potential
competitors.
The
tree
basal
area
and
its
square
were
tested
(APA2
and
APA4,
respectively).
The
APA4
gives
a
larger
propor-
tion
of
space
to
bigger
trees
than
APA2.
The
distance-weighted
size
ratio
functions
and
point
density
measures
were
calculated
for
BAF
1
and
4
m2
ha-1
.
BAF
1
is
associated
with
a
greater
number
of
competitors
when
compared
with
BAF
4.
From
the
two
modalities
of
point
density
measures
presented
by
Spurr
[26],
including
and
excluding
the
subject
tree,
the
second
was
consistently
better
in
our
data.
As
crown
measurements
were
not
available,
the
area
overlap
indices
had
to
be
calculated
using
two
empirical
definitions
of
radius
of
influence
area
(0.125
x
dbh;
0.25
x
dbh).
The
first
definition
corresponds
approximately
to
a
BAF
of
4
and
the
second
to
a
BAF
of
1.
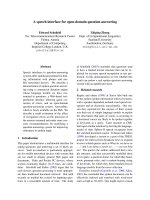
The
rules
to
select
competitors
based
on
BAF
define
a
linear
positive
relationship
between
the
distance
and
the
size
of
the
tree.
For
instance,
a
tree
with
40-cm
diameter,
for
BAF
=
1,
competes
until
a
distance
of
20
m
and
is
therefore
associ-
ated
with
a
high
number
of
competitors
(figure
2I).
In
practice,
and
in
plantations,
it
is
not
probable
that
one
tree
has
a
strong
effect
on
the
growth
of
neighbours
that
are
20
m
away
(more
than
six
rows
apart
for
a
3
x
3-m
spacing).
selected
competitor
has
its
own
contribution
to
the
value
of
the
index
and
this
contribution
must
decrease
when
the
distance
increases
or
the
size
decreas-
es.
New
rules
based
on
asymptotically
restricted
non-lin-
ear
functions
of
tree
size
are
proposed
in
this
paper.
These
rules
are
specific
for
the
distance-weighted
size
ratio
function
indices
and
point
density
measures
both
in
their
traditional
and
modified
formulations.
The
selected
functions
were
hyperbolic
and
monomolecular
and
Richards’
function
(see
mathematical
formulations
in
figure
21,
II,
III,
respectively).
The
monomolecular
func-
tion
is
a
particular
case
of
Richards’
function
when
m
=
0.
This
selection
was
based
on
the
graphical
form
of
these
functions
in
their
integral
formulation
and
on
the
existence
of
a
superior
asymptote.
Each
of
these
func-
tions
has
two
to
three
parameters:
one
of
them
being
the
asymptote
A
and
the
others
(k,
m)
being
shape
parame-
ters
(figure
2).
Based
on
the
results
of
a
previous
study
by
Soares
and
Tomé
[25],
a
value
of
7
m
for
the
asymp-
tote
was
used.
This
distance
is
a
function of
tree
size
and,
for the
bigger
trees,
it
approaches
7
m.
The
asymp-
tote
of
7
m
was
found
to
be
the
more
appropriate
based
on
a
previous
study
in
which
different
asymptotes
were
tested.
This
value
refers
only
to
eucalyptus
trees
in
plan-
tation
(densities
ranging
from
1 000
to
1
600
trees
per
hectare).
Both
functions
were
restricted
to
obtain
null
co-
ordinates
in
the
origin.
Different
values
were
tested
for
the
m
and
k
parameters.
A
fixed
number
of
competitors
(four
or
eight)
were
also
tested.
The
consistency
of
the
different
rules
that
were
tested,
as
well
as
the
selection
of
the
parameters
in
the
asymp-
totically
restricted
non-linear
functions
of
tree
size
(test-
ing
one
value
of
asymptote
and
several
values
for
the
k
and
m
parameters),
was
mainly
based
on
the
number
of
selected
competitors
for
a
particular
rule
in
different
age
classes.
3.3.
Definition
of
stages
of
stand
development
The
study
of
evidence
and
intensity
of
competition
present
in
the
selected
data
at
different
moments
in
time
was
analysed.
For
that,
and
based
on
Perry
[20],
the
data
were
initially
divided
into
three
subsets
representing
dif-
ferent
competition
stages
of
stand
development:
1)
small
trees
present
larger
relative
growth
rate
(RGR)
than
large
ones -
correlation
coefficient
between
RGR
and
dbh
negative
and
significantly
different
from
zero;
2)
RGR
differs
little
among
social
classes -
correlation
coeffi-
cient
not
significantly
different
from
zero;
3)
trees
in
the
lower
diameter
classes
are
suppressed -
correlation
coef-
ficient
between
RGR
and
dbh
positive
and
significantly
different
from
zero.
The
characterisation
of
the
data
subsets
is
presented
in
table
III.
It
was
anticipated
that
the
two-sided
oriented
indices
would
give
better
predictions
for
subset
1 while
the
unilateral
or
asymmetric
versions
would
be
more
appropriate
to
predict
growth
in
subsets
2
and
3.
3.4.
Prediction
ability
The
growth
of
individual
trees
on
particular
sites
is
influenced
by
a
number
of
factors
such
as
tree
character-
istics
(size
and
age),
microenvironment,
genetic
charac-
teristics
and
competitive
status
[29].
One
of
the
most
important
predictors
of
how
a
tree
grows
is
its
own
size
[20]
because
past
competitive
interactions
are
integrated
in
current
tree
size
and
also
because
variability
is
intro-
duced
as
a
consequence
of
genotypic
differences
in
response
to
competition
and
of
environmental
hetero-
geneity
[6].
Stand
density
expresses
differences
in
tree
growth
among
different
stands,
the
relative
dimension
of
the
tree
expresses
the
dominance
of
a
tree
in
relation
to
other
trees
in
the
stand
and
competition
indices
express
local
competition
among
a
tree
and
its
neighbours.
The
study
of
the
prediction
ability
of
distance-depen-
dent
indices
was
based
both
on:
-
simple
correlation
of
each
index
with
tree
basal
area
growth
for
each
one
of
the
data
subsets
considered;
-
performance
in
a
multiple
linear
regression
equation
to
predict
the
annual
increment
of
tree
basal
area
where
variables
characterising
the
stand
and
the
individual
tree
were
present:
where
ib
is
the
annual
increment
in
tree
basal
area;
S
h,t
,
represents
a
measure
of
site
productivity
(site
index);
TD
expresses
tree
initial
characteristics
(diameter,
dbh;
tree
basal
area,
b);
RTD
is
a
measure
of
the
relative
tree
dimension
(ratio
between
tree
basal
area
and
stand
basal
area,
RBM;
ratio
between
dbh
and
the
quadratic
mean
dbh,
RDM);
and
SC
expresses
the
competition
at
stand
level
(number
of
trees
per
hectare,
N;
basal
area
per
hectare,
G;
the
inverse
of
each
of
these
variables,
l/N,
l/G).
An
all
possible
regression
algorithm
was
used
to
select
the
best
model
out
of
a
large
set
of
tree
and
stand
variables
representing
site
index,
initial
tree
size,
stand
density
and
relative
tree
size.
The
selection
of
the
model
was
based
on measures
of
multiple
linear
regression
quality
and
prediction
ability:
adjusted
R2,
residual
mean
square
(RMS),
prediction
sum
of
squares
(PRESS)
and
sum
of
absolute
prediction
errors
(APRESS).
The
pres-
ence
of
colinearity
in
the
models
was
analysed
through
the
values
of
the
variance
inflation
factors
(VIF).
This
study
was
carried
out
separately
for
each
one
of
the
data
subsets.
The
contribution
of
each
index
to
the
selected
model
was
analysed
based
on
the
value
of
the
F-statistic.
4.
Results
and
discussion
4.1.
Rules
to
select
competitor
trees
Table
Iva,
b shows
the
number
of
observations
obtained
with
six
different
rules
to
select
competitors
in
each
one
of
the
possible
combinations
of
’number
of
selected
competitors/age’.
To
analyse
these
tables
the
stage
of
stand
development
represented
by
each
one
of
the
data subsets
was
considered.
For
rules
based
on
BAF
=
4
m2
ha-1
,
in
32
%
of
the
observations
in
age
class
]36,
60]
months
no
competitors
were
selected
(table
IVa).
Based
on
the
conclusions
of
previous
studies
[24],
considering
the
age
and
the
development
of
the
stand,
the
non-existence
of
competition
relationships
between
trees
was
not
expected
for
these
ages.
In
fact,
if
the
low
number
of
selected
competitors
by
this
rule
for
older
stands
(maximum
of
12
competitors)
seems
logical
for
planted
stands,
the
high
percentage
associated
with
no
competitors
in
this
age
class
is
not
biologically
con-
sistent.
For
BAF
=
1
m2
ha-1
,
41
and
84
%
of
the
obser-
vations
in
the
age
classes
] 108,
132]
and
]132,
216]
months,
respectively,
were
associated
with
a
number
of
competitors
superior
to
20
that
seems
too
large
from
a
biological
standpoint.
On
the
selection
of
the
parameters
for
the
new
rules
to
select
competitors
in
the
classes
of both
no
competitors
and
age
greater
than
24
months
as
well
as
in
the
classes
of
more
than
20
competitors,
a
reduced
or
low
number
of
observations
was
required
(table
IVb).
Accordingly,
the
following
parameter
values
were
selected:
hyperbolic
function
k
=
0.2
and
0.3;
monomolecular
function
k
=
10
and
15;
Richards’
function
k
=
15
and
30;
m
=
1/2
and
9/10.
4.2.
Prediction
ability
Table
V
presents
the
linear
tree
basal
area
growth
models
selected
for the
three
stages
of
stand
develop-
ment
considered.
The
best
model
with
four
variables
was
similar
for
each
one
of
the
stages
of
stand
development
considered,
involving
site
index,
dbh,
RDM
or
RBM
and
basal
area
per
hectare.
In
the
latter
stages
of
stand
devel-
opment
the
RBM
had
a
better
contribution
to
the
tree
basal
area
growth
model
while
in
the
other
stages
the
RDM
was
superior.
This
result
may
be
justified
by
the
fact
that,
for
eucalyptus
trees,
the
exponent
in
the
allo-
metric
relationship
between
weight
and
dbh
increases
with
age
[ 12].
The
RDM
and
RBM
may
both
express,
at
different
ages,
the
ratio
between
the
subject
tree
biomass
and
the
tree
of
mean
biomass.
The
contribution
of
each
competition
index
to
the
tree
basal
area
growth
model
is
presented
in
table
VI.
APA
indices
were
excluded
from
the
analysis,
as
they
are
quite
different
both
in
the
mathematical
formulation
and
in
the
way
the
competitors
are
selected.
The
superiority
of
the
rules
to
select
competitors
based
on
the
Richards’
function
is
evident
from
this
table,
particularity
in
the
modality
2
(A
=
7,
k =
30
and
m
=
9/10).
It
is
also
evi-
dent
that
the
contribution
of
a
certain
index
formulation
(mathematical
expression
and
selection
rule)
is
different
for
each
stage
of
stand
development.
In
the
initial
stages
DR
indices
are
generally
non-significant
with
the
excep-
tion
of
those
defined
by
the
Richards’
function
(namely
modality
2)
and,
to
a
certain
extent,
BAF
=
4.
The
AO
indices
are
poorly
significant
for
BAF
=
1
and
non-sig-
nificant
for
BAF
=
4.
The
contribution
of
PD
measures
is
slightly
better
in
this
stage,
however
showing
again
a
superiority
of
the
Richards’
function,
in
particular
if
associated
with
the
unilateral
version.
However,
the
expected
superiority
of
the
unilateral
or
modified
ver-
sions
of
the
indices
is
not
clear.
Most
of
the
tested
indices
are
not
significant
in
the
intermediate
stage
of
stand
development.
An
exception
is
the
DR
indices
asso-
ciated
with
the
Richards’
function,
namely
in
the
modali-
ty
2 with
the
unilateral
and
modified
versions
being
slightly
superior
to
the
traditional
one.
This
lack
of
sig-
nificance
of
competition
indices
in
this
intermediate
stage
may
indicate
that
this
data
set
joins
remeasure-
ments
that
are
not
clearly
from
the
initial
stages
of
stand
development
nor
show
evidence
effects
of
suppression
of
small
trees.
Note
that
this
is
the
smallest
of
the
three
subsets.
Later
in
stand
development,
when
there
is
evi-
dence
of
suppression
of
small
trees,
the
unilateral
and
modified
versions
of
the
DR
indices
associated
with
the
modality
of
the
Richards’
function
were
clearly
superior
Finally,
the
superiority
of
the
APA
indices
in
the
last
stage
of
stand
development
is
also
evident
with
the
APA
indices
showing
the
highest
partial
correlation
in
multi-
ple
regression
with
tree
basal
area
growth.
Tomé
and
Burkhart
[29]
and
Tomé
[27]
with
adult
eucalyptus
stands
have
obtained
identical
results.
APA4,
which
gives
more
weight
to
larger
trees,
shows
greater
F-values
reinforcing
the
presence
of
asymmetric
competition
in
the
data.
The
DRU,
based
on
Richards’
function
with
asymp-
tote
7,
k
=
30
and
m
=
9/10
presents
the
best
contribution
when
analysed
simultaneously
in
each
subset
and
with
all
the
data.
In
fact,
the
contribution
of
the
DRU
to
the
tree
basal
area
growth
model
defined
for
all
the
data
(model
with
four
variables -
S
h,t
,
d,
G
and
RDM)
corre-
sponded
to
a
partial
F
of
162.2,
the
highest
partial
F-
value
when
all
the
data
were
considered
as
a
whole
(very
similar
to
the
value
of
161.5
obtained
with
APA4).
The
correlation
coefficients
of
some
competition
indices
with
tree
basal
area
growth
are
presented
in
table
VII.
The
lack
of
correspondence
between
the
values of
correlation
coefficients
and
the
contribution
of
each
index
to
the
tree
basal
area
growth
model
reinforces
the
scant
information
given
by
the
correlation
coefficients
when
analysed
per
se.
For
instance,
in
the
last
stage
of
stand
development,
the
PDU
presents
the
highest
absolute
values
but
this
type
of
index
has
no
significant
contribution
to
the
tree
basal
area
growth
model
(table
VI).
This
fact
is
a
consequence
of
the
relationship
between
some
of
the
indices
and
the
other
variables
already
present
in
the
model
(colinearity).
As
expected,
all
the
indices
indicating
competitive
stress
present
negative
correlation
with
growth,
while
the
APA
indices
expressing
competitive
advantages
show
positive
correlation.
Analysing
the
correlation
between
competition
indices
and
tree
basal
area
growth
over
an
increased
intensity
of
asymmetric
competition -
subset
1
to
subset
3 -
it
can
be
observed
that
the
correlation
coef-
ficients
are
small
in
subset
1
and
increase
as
the
asym-
metric
competition
increases.
This
behaviour
was
not
observed
with
the
DRM
and
DD
as
well
as
with
the
APA
indices.
5.
Conclusion
Indices
based
on
asymptotically
restricted
non-linear
functions
of
tree
size
as
rules
for
selecting
competitor
trees
present,
when
compared
with
the
BAF
rule,
a
high-
er
contribution
to
multiple
linear
regression
models.
The
Richards’
function
defined
by
asymptote
7
m
and
shape
form
parameters
k
=
30
and
m
=
9/10
seems
to
be
capa-
ble
of
expressing
a
biologically
acceptable
relationship
between
’number
of
selected
competitors/age’.
The
supremacy
of
the
indices
based
on
the
Richards’
func-
tions
was
observed
for
all
stages
of
stand
development.
The
DRU
indices,
based
on
the
Richards’
function,
make
a
significant
contribution
to
the
tree
basal
area
growth
model
in
all
of
the
analysed
data
subsets.
However,
later
in
stand
development,
when
there
is
evi-
dence
of
suppression
of
small
trees,
the
APA4
seemed
to
present
a
better
performance.
Acknowledgements:
Financial
support
for
this
pro-
ject
was
provided
by
the
projects
AIR2-CT93-1678
’Improvement
of
eucalyptus
management.
An
integrated
approach:
breeding,
silviculture
and
economics’
and
PAMAF
4025
’Influência
do
compasso
no
crescimento
e
produção
de
plantações
de
Eucalyptus
globulus
Labill.
e
Pinus
pinaster
Ait.
em
diferentes
ambientes
ecológicos’.
We
acknowledge
unpublished
data
provided
by
the
pulp
company
STORA
CELBI.
References
[1]
Alemdag
I.S.,
Evaluation
of
some
competition
indexes
for
the
prediction
of
diameter
increment
in
planted
white
spruce,
For.
Manag.,
Inst.
Inf.
Rep.
FMR
-X-
108
(1978)
39
pp.
[2]
Begon
M.,
Harper
J.L.,
Townsend
C.R.,
Ecology,
2nd
ed.,
Blackwell
Science,
Oxford,
1986.
[3]
Biging
G.S.,
Dobbertin
M.,
A
comparison
of
distance-
dependent
competition
measures
for
height
and
basal
area
growth
of
individual
conifer
trees,
For.
Sci.
38
(1992)
695-720.
[4]
Brand
D.G.,
Magnussen
S.,
Asymmetric,
two-sided
competition
in
even-aged
monocultures
of
red
pine,
Can.
J.
For.
Res.
18 (1988) 901-910.
[5]
Burton
P.,
Some
limitations
inherent
to
static
indices
of
plant
competition,
Can.
J.
For.
Res.
23
(1993)
2141-2152.
[6]
Cannell
M.G.,
Njuguna
C.K.,
Ford
E.D.,
Smith
R.,
Variation
in
yield
among
competing
individuals
within
mixed
genotype
stands
of
tea:
a
selection
problem,
J.
Appl.
Ecol.
14
(1977) 969-985.
[7]
Courbaud
B.,
Houllier
F.,
Rupe
C.,
Un
modèle
de
crois-
sance
en
hauter
des
arbres
en
pessière
pure
irrégulière
de
mon-
tagne,
Ann.
Sci.
For.
50
(1993)
337-351.
[8]
Daniels
R.F.,
Simple
competition
indices
and
their
cor-
relation
with
annual
loblolly
pine
tree
growth,
For.
Sci.
22
(1976) 454-456.
[9]
Daniels
R.F.,
Burkhart
H.E.,
Classon
T.R.,
A
compari-
son
of
competition
measures
for
predicting
growth
of
loblolly
pine
stands,
Can.
J.
For.
Res.
16
(1986)
1230-1237.
[10]
DGF,
Resultados
preliminares
da
2a
fase
da
3a
Revisão
do
Inventário
Florestal
Nacional,
Site
Web,
1998.
[11]
Doyle
TW.,
An
evaluation
of
competition
models
for
investigating
tree
and
stand
growth
processes,
in:
Dixon
R.K.,
Meldahl
R.S.,
Ruark
G.A.,
Warren
W.G.
(Eds.),
Process
Modelling
of
Forest
Growth
Responses
to
Environmental
Stress,
Timber
Press,
Portland,
Oregon,
1990,
pp.
271-277.
[12]
Fabião
A.,
Contribuição
Para
o
Estudo
da
Dinâmica
da
Biomassa
e
da
Produtividade
Primária
Liquída
em
Eucaliptais,
Região
Centro
de
Portugal,
PhD
Thesis,
Instituto
Superior
Agronomia,
Lisboa,
1986.
[13]
Florence
R.G.,
Ecology
and
Silviculture
of
Eucalypt
Forests,
CSIRO,
Australia,
1996.
[14]
Holmes
M.J.,
Reed
D.D.,
Competition
indices
for
mixed
species
of
northern
hardwoods,
For.
Sci.
37
(1991)
1338-1349.
[15]
Kozlowski
T.T.,
Kramer
P.J.,
Pallardy
S.G.,
The
Physiological
Ecology
of
Woody
Plants,
Academic
Press,
London, 1991.
[16]
Lorimer
C.G.,
Tests
of
age-independent
competition
indices
fore
individual
trees
in
natural
hardwood
stands,
For.
Ecol.
Manag.
6
(1983)
343-360.
[17]
Martin
G.L.,
Ek
A.R.,
Monserud
R.A.,
Control
of
plot
bias
in
forest
stand
growth
simulation
models,
Can.
J.
For.
Res.
7 (1977) 100-105.
[18]
Martin
G.L.,
Ek
A.R.,
A
comparison
of
competition
measures
and
growth
models
for
predicting
plantation
red
pine
diameter
and
height
growth,
For.
Sci.
30
(1984)
731-743.
[19]
Pereira
J.S.,
Linder
S.,
Araújo
M.C.,
Pereira
H.,
Ericsson
T.,
Borralho
N.,
Leal
L.C.,
Optimization
of
biomass
production
in
Eucalyptus
globulus
plantations -
a
case
study,
in:
Pereira
J.S.,
Landsberg
J.J.
(Eds.),
Biomass
Production
by
Fast
Growing
Trees,
Kluwer
Academic
Publishers,
Dordrecht,
Holanda,
1989,
pp.
101-121.
[20]
Perry
D.A.,
The
competition
process
in
forest
stands,
in:
Cannel
M.G.R.,
Jackson
J.E.
(Eds.),
Attributes
of Trees
as
Crop
Plants,
Institute
of
Terrestrial
Ecology,
Abbots
Ripton,
Hunts,
1985,
pp.
481-506.
[21]
Short
III
E.A.,
Burkhart
H.E.,
Prediction
crown-height
increment
for
thinned
and
unthinned
loblolly
pine
plantations,
For.
Sci.
38
(1992)
594-610.
[22]
Smith
W.R.,
The
static
geometric
modelling
of
three-
dimensional
crown
competition,
in:
Dixon
R.K.,
Meldahl
R.S.,
Ruark
G.A.,
Warren
W.G.
(Eds.),
Process
Modelling
of
Forest
Growth
Responses
to
Environmental
Stress,
Timber
Press,
Portland,
Oregon,
1990,
pp.
294-302.
[23]
Stohlgren
T.J.,
Intraspecific
competition
(crowding)
of
giant
sequoias
(Sequoiadendron
giganteum),
For.
Ecol.
Manag.
59 (1993) 127-148.
[24]
Soares
P.,
Tomé
M.,
Changes
in
eucalyptus
plantations
structure,
variability
and
relative
growth
rate
pattern
under
dif-
ferent
intraspecific
competition
gradients,
in:
Skovsgaard
J.P.,
Johannsen
V.K.
(Eds.),
Modelling
Regeneration
Success
and
Early
Growth
of
Forest
Stands,
Proc.
IUFRO
Conf.,
Copenhagen,
10-13
June
1996,
Danish
Forest
and
Landscape
Research
Institute,
Forskningsserien
3,
1996,
pp.
255-269.
[25]
Soares
P.,
Tomé
M.,
Analysis
of
the
biological
consis-
tency
and
prediction
ability
of
some
distance-dependent
com-
petition
measures,
in:
Skovsgaard
J.P.,
Johannsen V.K.
(Eds.),
Modelling
Regeneration
Success
and
Early
Growth
of
Forest
Stands,
Proc.
IUFRO
Conf.,
Copenhagen,
10-13
June
1996,
Danish
Forest
and
Landscape
Research
Institute,
Forskningsserien
3,
1996,
pp.
270-284.
[26]
Spurr
S.H.,
A
measure
of
point
density,
For.
Sci.
8
(1962) 85-96.
[27]
Tomé
M.,
Distance
dependent
competition
measures
to
model
growth
of
individual
trees,
in:
Burkhart
H.E.
(Ed.),
Research
in
Forest
Mensuration,
Growth
and
Yield.
Proc.
ses-
sions
of
S4.01
at
the
World
Congress
of
IUFRO,
publication
FWS-2-90,
School
of
Forestry
and
Wildlife
Resources,
Virginia
Polytechnic
Institute
and
State
University,
Blacksburg,
Virginia,
1990,
pp.
219-231.
[28]
Tomé,
M.,
Modelação
do
crescimento
em
altura
domi-
nante
em
eucaliptais
com
recurso
a
análise
multivariada
e
análise
de
regressão,
in:
Turkman
M.,
Carvalho,
M.
(Eds.),
Actas
da
1a
Conferência
em
Estatística
e
Optimização.
INIC
and
DEIO
(Univ.
Lisboa),
Lisboa,
1990,
pp.
443-462.
[29]
Tomé
M.,
Burkhart
H.E.,
Distance
dependent
competi-
tion
measures
for
predicting
growth
of
individual
trees,
For.
Sci.
35
(1989)
816-831.
[30]
Vanclay
J.K.,
Skovsgaard
J.P.,
Hansen
C.P.,
Assessing
the
quality
of
permanent
sample
plot
databases
for
growth
modeling
in
forest
plantations,
in:
Vanclay
J.K.,
Skovsgaard
J.P.,
Gertner
G.Z.
(Eds.),
Growth
and
Yield
Estimation
from
Successive
Forest
Inventories,
Proc.
IUFRO
Conf.,
Copenhagen,
14-17
June
1993,
Danish
Forest
and
Landscape
Research
Institute,
Forskningsserien
3,
1993,
pp.
89-102.
[31]
Weiner
J.,
Size
hierarchies
in
experimental
populations
of
annual
plants,
Ecology
66
(1985)
743-752.
[32]
Weiner
J.,
How
competition
for
light
and
nutrients
affect
size
variability
in
Ipomoea
tricolor
populations,
Ecology
67 (1986) 1425-1427.
[33]
Weiner
J.,
Asymmetric
competition
in
plant
popula-
tions,
Trends
Ecol.
Evol.
5
(1990)
360-364.