Designing Autonomous Mobile Robots phần 5 ppt
Bạn đang xem bản rút gọn của tài liệu. Xem và tải ngay bản đầy đủ của tài liệu tại đây (801.61 KB, 36 trang )
128
Chapter 9
The first law is due to the fact that navigation is never an exact science, and the readings
from sensors will always contain some error. Furthermore, the robot may experience
stretches on which it has no active navigation and is depending entirely on odometry.
The second law is due to the fact that it is impossible to move a mass to an exact
position
1
. We must accept the fact that our performance will always contain some
error, and set our goal for “good enough.”
Path planning and execution
There are two elements to the path-planning process itself. First, we must know the
path we wish to travel, and secondly, we must have a strategy for getting onto and
tracking that path. In an indoor environment, the actual paths can be composed of
simple straight lines joined by curves. For outdoor road-following robots, on the
other hand, paths will tend to be sequences of points that represent undulating
curves.
Convergence behaviors
To understand the subtleties of path following, let’s consider the simplest possible
case, a straight path to a destination. For discussion purposes, we will call the ends of
path segments nodes.
1
See Chapter 5, Closed Loop Controls, Rabbits and Hounds.
B
A
Obstacle
B
A
Obstacle
B
A
Obstacle
Strategy 1 Strategy 3Strategy 2
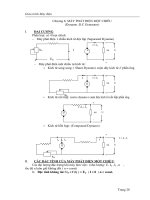
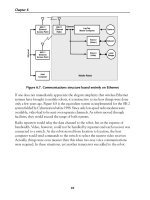
Figure 9.1. Three strategies for getting to a destination
129
The Best Laid Plans of Mice and Machines
In Figure 9.1, our robot was supposed to be at Node A, and was to travel from there
to Node B. When the robot prepared to execute the move, it realized that its posi-
tion was actually some distance from where it should have been at Node A. There
are three obvious strategies it can use to accomplish the move.
The first possible strategy is to ignore the path, and move straight for destination
Node B. The problem with this strategy, at least in this case, is that the robot will
run into an obstacle. The fact is that the path was placed where it is to provide a
safe avenue for the robot, and when we ignore it we may invite disaster.
The second strategy is to play it safe and first move straight to the correct starting
position (Node A) before heading for Node B. This strategy may be safer, but it is
also very time consuming. There is also a problem with this strategy if the robot is
on the move when it begins the process. In this case, it would need to stop to ex-
ecute the 90-degree turn to the path.
The third strategy is the “wagon tongue” method, so named because it works like a
child pulling a wagon by its tongue. If the child stays on the path, the wagon will
smoothly converge onto the path as well. In software, the robot is given a rabbit to
chase that is on the path, but some lead distance closer to the goal than the robot.
As the robot chases the rabbit, the rabbit continues to stay the same distance ahead.
If the distance to the destination is less than the lead distance, then the strategy will
not be appropriate.
So, which strategy is right? The answer is that they all are, at different times and
under different circumstances. If the robot is only slightly off the path, and relatively
near the destination, then the first strategy is fine. On the other hand, if the robot is
grossly off the path and far from the destination, then the second strategy is indi-
cated. For situations between these extremes, the third method is best.
The problem becomes one of definition. How far off the path do we need to be to
use the first strategy? In a tight area, the distance will be shorter than in an open
area. One solution is to treat paths as objects and provide a property that defines
this distance.
Another approach is to create a path program that the robot executes to move be-
tween the nodes. If we do this, we can include an instruction in this path program
that provides a definition of this distance. If our robot is to accomplish specific tasks
along the path, then a path program is almost essential.
130
Chapter 9
Closing behaviors
At first, we would think that we could drive to the destination and stop or run to
the next destination. Unfortunately, things aren’t that simple.
Flashback…
I remember well my first attempt at sending a robot to a node. It was all so simple. My
algorithm continually recalculated the vector heading and distance from the robot’s po-
sition estimate to the destination, and then traveled down that heading until the vector
distance was less than half an inch. As it approached the end of the run, it continually
recalculated the fastest possible velocity that would still allow it to stop at the destina-
tion without exceeding a specified deceleration.
On the first run, the algorithm worked perfectly, so I imprudently
2
called in all my co-
workers and attempted to repeat the demonstration. The robot ran purposefully toward
its destination, but at the moment when I should have humbly accepted my praise, it all
went wrong. The robot abruptly and ungracefully swerved to the left, stopped, turned
around, and continued driving in ever-tighter circles like a dog chasing its tail. My algo-
rithm violated the second immutable law of odometry when the robot missed the end
point. Once it had stopped, it could not make the minute move required to put it on the
target.
As with convergent behaviors, there are several different behaviors that may be
required as the robot nears its destination.
Are we there yet?
There are two methods of deciding how much further to drive. The first method is
to continually recalculate the distance as we drive. The problem with this comes
with the fact that as we approach the end, and the destination is to the side or rear,
the vector distance is still positive unless we take into account the vector angle
between it and the path.
The second method involves calculating the distance at the beginning of the run,
and simply counting down the distance remaining as a parallel process in the
odometry. The problem with this approach is that we may end up weaving about for
any number of reasons, requiring a longer drive distance than calculated.
2
For a detailed explanation of the phenomenon at work here, see “The law of conservation of defects
and the art of debugging” in Section 3.
131
The Best Laid Plans of Mice and Machines
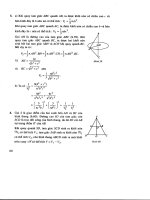
One answer is to use the parallel distance to the node to plan the stop, not the vector
distance. The second immutable law says we are never exactly where we want to be,
and Figure 9.2 shows an extreme case of this. The reasons why our robot could have
gotten so far off the straight and narrow are many. It may have had some bad naviga-
tion data, and only received good information at the last minute. Or, it could have
been forced to circumnavigate an obstacle and has not yet gotten back onto the
path.
B
d
As the robot approaches the end of the path, it must switch out of the wagon tongue
behavior and attempt to close on the end point. However, getting exactly to point B
is not the only consideration. As in my unfortunate experience, we don’t want the
robot to swerve near the end of the path as the vector direction to the end node di-
verges from the path direction due to the robot being to the left or right of the path.
Thus, it is usually more important that the robot end the path at the correct heading
than at the perfectly correct place.
One solution is to limit the angle between the robot and the path ever more tightly
as it approaches the end. Thus, at the end of the path the robot will be consistently
oriented parallel to the path. Whatever the lateral position error, we simply accept
it. If the robot gets a job to go on forward from Node B, then it can pick one of the
convergence behaviors already discussed.
There are other considerations in path planning as well. For example, it is common
for the robot’s collision avoidance to have a specified stopping or standoff distance.
This i
s
the distance from an obstacle that the robot should plan to stop. It is common,
how-
ever, for the distance from the end of a path to a wall or obstacle to actually be less
than the desired standoff distance. If this is the case, then the robot may stop before it
reaches the end of the path. It may even attempt to circumnavigate the “obstacle.”
In another case, the planner may be preparing to execute a tight turn that would be
unsafe at the current speed. In fact, the robot needs to have rules about such limits.
Figure 9.2. Calculating the distance remaining
132
Chapter 9
Therefore, it is important to recognize that the path planner must communicate
with other algorithms such as collision avoidance and speed control to allow the
robot to behave intelligently in a wide range of circumstances.
Running on
The situation becomes even more complex if the robot is expected to run on from
one node to the next without stopping, as shown in Figure 9.3.
B C
A
In this case, the robot knows ahead of time that it is not actually running to node B,
but is actually arcing past Node B to Node C. In this case, the robot plans the radius
of the turn, and this is the distance away from Node B that it must begin to turn.
Once into the turn, it steers at a constant rate until the heading is that of the B-C
path. When the heading matches, it can revert to a convergence behavior as previ-
ously discussed. Remember, the speed in the turn must be slower as the radius is
made
smaller.
Again, the collision avoidance behavior must interact with the planner to assure the
robot takes the appropriate avoidance action depending upon the type of maneuver
it is executing.
Bread crumbs and irregular path following
In the case of irregular paths such as roads, the basic techniques just discussed are
still valid, but must be modified somewhat. The most common method of describing
such paths is as a series (or locus) of points sometimes called “bread crumbs.” The
term is appropriate as these points are usually saved along a teaching run as the
storybook characters Hansel and Gretel used bread crumbs to mark their path back
Figure 9.3. Running on past a node
133
The Best Laid Plans of Mice and Machines
out of the forest. The behaviors already discussed can be adapted to such routes by
moving the rabbit from point to point along the path instead of moving it along the
straight line of the path.
1
7
6
5
4
3
2
8
9
Wagon Tongue
Figure 9.4. Converging onto a bread crumb path
134
Chapter 9
If the distance between points is too small, the number of points can become unnec-
essarily large, requiring a great deal of memory. Since this path may be transmitted
over our communications system, large files are undesirable from a bandwidth stand-
point as well. The spacing between points is usually within an order of magnitude of
the length of the vehicle, unless they describe a particularly tight geometry.
Smoothest performance can be achieved in following such a path if the rabbit is
moved
in smaller increments than the distance between the bread crumbs. This can be
done by
simply performing a straight-line segment between each of the bread crumbs.
The Z axis, maps, and wormholes
For outdoor systems, the z axis must be saved for each of the points in a bread
crumb
trail if the robot is to operate on anything but a flat surface. Indoors, however, the
robot may need to move from floor-to-floor of a building. It is not enough to save
the z value of each floor, because the floor plans are typically different at each level.
For this reason, instead of a normal z axis, I prefer having the ability to change maps.
In Cybermotion systems, each node has a prefix that is the abbreviation for the map
it belongs to. For example, Flr1_AB is node AB on the Flr1 map. Special “paths”
known as wormholes have nodes that are physically at the same location but that
belong to adjoining maps. In this way, an action from Flr1_AB to Flr2_AC creates
no executable instructions for the robot, but causes the base station to register that
the robot has gone from node AB on the Flr1 map to node AC on the Flr2 map.
An object-oriented approach to the situation is to assign both the value of Z and the
map name as properties of the nodes. Paths between nodes would then inherit these
p
roperties. Nodes can be objects in their own right that are in turn properties of
paths, or they can simply be members of arrays that are properties of paths. The
latter representation will conserve memory while the former is more politically
correct.
There are compelling reasons to maintain multiple map capability, even in outdoor
systems. For one thing, the size of each map can be kept reasonable. Smaller maps
mean faster display, pan, and zoom at the base station. In addition, it is quite pos-
sible that an autonomous vehicle will need to enter a structure such as a parking
garage where multiple maps are essential.
135
The Best Laid Plans of Mice and Machines
Summary
The behaviors discussed here are but one way of performing path planning and
execu
tion. There are undoubtedly many other methods, but the principles and
considerations are the same. As the path planner evolves, it will become ever more
interconnected with other algorithms and states. Some of these interactions will be
discussed in the chapters to come.
The important thing to remember is that each behavior must be capable of operat-
ing properly if the robot’s position estimate is suddenly changed. If our robot has
good solid live reckoning, these changes will happen continuously.
Navigation as a Filtering Process
10
CHAPTER
137
At this point, we have created a way of representing our paths and executing
them
from odometry alone. This means that we should be able to run simple short pro-
grams using only odometry. As it runs without navigational corrections, our robot
will become increasingly disoriented, but we can tell that it is doing basically the
right maneuvers. This is a distinct advantage in the dual-personality approach as it
eases the debug process.
We can think of the path planner and executer as the pilot. It easily follows succes-
sive headings for prescribed distances. The navigator, on the other hand, studies the
terrain and decides whether the position and heading estimates are correct. If it
decides to change them, the pilot’s heading commands and distances will change
automatically.
Filtering for the truth
A truly capable mobile robot may have many navigation algorithms, each of which
is adapted to a certain environment. For example, office buildings usually have hall-
ways with easily detected walls as boundaries. Warehouses, on the other hand, have
aisles but these may be defined by nothing more than a paint stripe. Sensors like
sonar and lidar can detect the walls, but not the stripes. Cameras can detect both,
but only if there is sufficient illumination.
There may also be multiple modes in which a sensor is used. For example, lidar may
look for flat surfaces such as walls or special retro-reflectors to provide navigation up
-
dates. The algorithms for these two modes are completely different.
138
Chapter 10
Additionally, there may be areas in which it is necessary to specify more than one
method of navigation concurrently. For example, there may be a warehouse aisle
de
fined
by crates along the aisle boundaries. If the crates are removed, walls or
reflectors
may
be
exposed behind them. For this reason, our navigator may be looking for multiple
features at the same time.
Add to this the fact that almost any feature we are looking for may be mimicked by a
false reading, and you begin to see the challenge. For example, a series of boxes
along a
wall may look just like the wall to our sensor, indicating that we are out of position
by the width of the boxes. The navigation process therefore becomes one of selective
belief in things that are most likely to be right. As we will see later, most of the
time our
machine will not believe anything entirely!
There are several metaphors that come to mind when trying to describe this process.
In some ways, a good navigator is like a police detective, sorting through clues and
contradictions trying to find the truth. The metaphor that I like best, however, is
that of an electronic filter that locks in on and passes good data while blocking false
information. For optimal performance, this filter will become more and less selective
as the platform becomes more and less uncertain of its position estimates.
The importance of uncertainty
Last spring we experienced some terrible flooding. As I dug out from all of the debris
I decided to order about 100 tons of rock and gravel to fill in the holes. When the
truck driver called with the first load, I gave him instructions on how to find our
prop-
erty. I told him that after the road makes a sharp left turn, he should go about 1.25
miles and find a gazebo on the right-hand side of the road. Just after the gazebo was
my driveway. I told him to come across the low-water bridge and drop his load to the
right of the driveway just past the bridge.
When he finally arrived, he informed me that there was another gazebo and bridge
about half a mile after the turn. Apparently, this gazebo had recently been erected.
He had turned into this drive, and was preparing to drop the first 10 tons of rock
when a frantic man emerged from the house and wanted to know why he was going
to drop the rock on his vegetable garden!
In retrospect, the driver said that it did not seem like a mile and a quarter from the
turn to the gazebo, but that the coincidence had been too much for him. The driver
had opened his window of acceptance to allow the first gazebo to be taken as the
landmark. On the other hand, if he had refused to turn into my driveway because his
139
Navigation as a Filtering Process
odometer was only registering 1.2 miles from the curve, then I might never have re-
ceived my rock. No self-respecting robot would have had an uncertainty window of
.75 miles after having driven only .5 miles, but such an uncertainty might have been
reasonable, after, say, 20 miles. Thus, uncertainty and the window of acceptance
cannot be a simple constant.
For optimal navigation, our filter window needs to be as small as possible and no smaller.
In navigation, we (hopefully) know the true distances and directions very accurately,
but we may be uncertain of how far we have traveled, and in exactly which direc
tion.
The margin of error is therefore a variable that depends upon how far we have trav-
eled since our last correction. The German bombers, described in Chapter 7,
received
their only longitudinal correction just before the target and this was for a good
reason.
By minimizing the distance to be estimated, the margin for error from that point to
the target was minimized. The same principle applies for other parameters such as
heading.
Uncertainty is thus the gauge of how open we must make our filter to keep from
missing our landmarks. The longer the robot runs without a correction, the larger its
uncertainty and the higher the risk that it will accept false data.
When we are fortunate enough to acquire valid navigation data, it may only pertain
to one relative axis or the heading. After such a fix, we might become more certain
of, say our lateral position, but not of our longitudinal position. Although most
buildings are relatively orthogonal, this correction may translate to a mix of x and y
in the global coordinate system, but that doesn’t matter.
Global navigation corrections (such as GPS) apply to all global axes, but do not
directly tell us our heading (though we can of course infer this from successive
fixes). Many other types of corrections will be with respect to the vehicle’s frame of
reference. For example, if our robot is going down a hall and using the walls for navi-
gation, our corrections should tell us its lateral position and its heading, but they tell
us nothing about its distance traveled. In this case, our uncertainty in the corrected
axes will diminish, but the uncertainty in the uncorrected axes will continue to
accumulate. The solution is to treat all corrections as being relative to our frame of
reference. Thus, a GPS fix is treated as both a lateral and a longitudinal correction.
140
Chapter 10
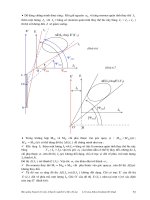
In Figure 10.1, the robot has driven from the bottom of the screen through the
nodes Y7,
Y8, and then stopped at node Z1. As it approached Y7, it collected sonar data
(shown as “+” marks) from the wall on its right. When this data was processed, the
“fix line” was drawn through the “+” marks to show where the robot found the wall.
From this fix the robot corrected its lateral position and its heading. As it turned the
corner and went through a wide doorway, it measured the edges of the door and drew
a “+” where it found the center should have been. Again, it made a correction to its
lateral position, but while the first lateral correction translated to a correction along
the x-axis of the map, this correction corrected its error along the y axis. The un-
certainty of the corrected axes will have been reduced because of each of these fixes.
Modeling uncertainty
To calculate uncertainty is to model the way the robot’s odometry accumulates error.
For the purposes of this discussion, I am going to assume a platform that can turn in
place. If you are working with a drive system that cannot do this, such as an Acker-
man system, then you will need to interpret some of these concepts to allow for the
coupling between driving and steering.
Figure 10.1. Correcting multiple axes
(Courtesy of Cybermotion, Inc.)
141
Navigation as a Filtering Process
Uncertainty is most easily calculated relative to the vehicle’s frame of reference. The
reasons for keeping uncertainty in a relative reference are several. Most importantly,
errors will occur for different reasons along the vehicle’s lateral and longitudinal
axes. Heading errors will occur for different reasons yet, and it will induce lateral
error as the robot drives.
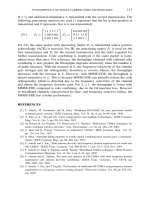
Figure 10.2 shows a diagnostic display for monitoring uncertainty. The ellipse indi-
cates the lateral and longitudinal uncertainty, while the intersecting lines indicate
the heading uncertainty. In this case, the uncertainty represents the absolute bound-
ary for correction data that is received. Data outside of this boundary will be ignored,
but this does not mean that a correction of slightly less than this magnitude would
be used to correct the position estimates directly. More will be said about this in the
coming chapters.
Azimuth (heading) uncertainty
A robot that is not moving generally accumulates no error
1
. Heading uncertainty is
therefore caused primarily by the acts of turning or driving. Like other forms of un-
certainty, this one has both an inherent platform component and a surface
component.
Figure 10.2. Uncertainty diagnostic display
(Courtesy of Cybermotion, Inc.)
1
Actually, it can falsely accumulate uncertainty if an encoder repeatedly registers forward and
backward ticks as the result of Servo-hunting or edge jitter on an encoder. Therefore, it is a good
policy to incorporate hysteresis on all such signal inputs.
142
Chapter 10
If a robot is attempting to turn in place on a loose throw rug, the error may be worse
than on a tile floor. Generally, the platform component of heading uncertainty for
steering can be calculated by simply multiplying the cumulative magnitude of a turning
action by an error factor (in units of degrees of error per degree of turning). It is
desirable that this factor be readily changed by the robot. It may be changed in the
i
nitialization sequence, a path program, or a learning program of the platform as
neces-
sary. These error factors are a prime example of a good use of blackboard variables.
If the mobile platform has a steering encoder that causes tick interrupts, the calcula-
tion becomes nothing more than adding the error factor to the accumulated
uncertainty in a register.
If the mobile platform does not have an interrupt for steering, then it is necessary to
do this calculation during the drive interrupts. This can be done by noting the
amount
that the steering angle has changed since the previous interrupt. This calculation
must be done before the lateral uncertainty can be calculated.
Similarly, the heading uncertainty generated by driving is a factor of the distance
moved. Every time the odometry advances the robot’s position estimate by one tick,
it can add an appropriate amount to the heading uncertainty accumulator.
Generally, the error factors are quite small numbers, so it is convenient for the
uncertainty accumulator to be two or more words. The incremental increases are
then added to the lower word with carry to the higher register(s). The higher
register(s) are the only ones accessed by consuming tasks. In this way, the math for
these calculations can stay in integers and therefore execute very fast.
Heading errors related to driving, and thus uncertainty, are generally symmetric.
Turning errors are, however, not generally symmetric. A turn is much more likely to
come up short than long. The ideal model would take this into account, but very
decent performance can be accomplished by treating the uncertainty as if it were
symmetric by using its worst case factor.
Note that while we are performing uncertainty calculations using simple multiplica-
tion and addition, the effect of doing this iteratively is to produce the integral of
these functions.
Longitudinal uncertainty
Longitudinal error accumulates primarily from slippage, wheel wear, and improper
tire inflation. There are again two elements to be taken into account: errors from
143
Navigation as a Filtering Process
the mobile platform itself, and those from the surface it is running on. A robot run-
ning in snow will likely under-run the distance it thinks it has traveled.
Longitudinal uncertainty is thus nothing more than the distance traveled, multiplied
by
an error factor. Longitudinal uncertainty is not generally symmetric. On level
ground,
a robot may tend to underrun the path but will seldom overrun it. On an uphill
slope,
t
his tendency is more significant yet. On a downhill slope, the robot will tend to
overrun its path if slippage occurs during braking. Again, reasonable results can be
gained with a symmetric assumption about longitudinal uncertainty, but the advan-
tage of keeping separate values for the two directions is fairly strong.
As the robot turns, the accumulated lateral and longitudinal uncertainty are simply
converted into a vector, rotated, and converted back into lateral and longitudinal
components. If a robot turns 90 degrees, then the lateral uncertainty will become
the longitudinal uncertainty and vice versa.
Lateral uncertainty
Lateral error is predominantly accumulated as the result of driving with a heading
error. Thus, lateral uncertainty is accumulated by multiplying the distance traveled
by the sine of the heading error. If this accumulation is done frequently, the fact that
the heading error is not constant can be ignored. Since heading can be approxi
mated as
being symmetric, so can the accumulated increments of lateral uncertainty.
Reducing uncertainty
Up until now, we have been mostly concerned about accumulating uncertainty.
Clearly
there must also be a way of diminishing it. When an axis accepts a fix, its uncer
tainty
should also be reduced. But beware, this process is not as simple as zeroing the
accum-
ulator for the axes that were corrected.
First, if we allow uncertainty to go to zero, we will not be able to accept any new
fixes
until we have traveled enough to accumulate new uncertainty. Since there is always
a bit of error in sensor readings, building measurements, and other factors, we need
to establish a minimum uncertainty threshold below, which we do not go.
Let’s assume that we have just received a correction of the lateral position of the ro-
bot. No matter how good our filtering is, there is always a finite chance that this
correction is not valid. If we reduce our uncertainty too much, we may lock our filter
into this correction and refuse to believe the correct data when we next receive it.
144
Chapter 10
Therefore, uncertainty should never be reduced below the magnitude of the current
correction or the minimum uncertainty threshold, whichever is larger.
Learning to be accurately uncertain
If our uncertainty estimates are too pessimistic, they will potentially allow bad data
to be accepted into the position estimates. If the uncertainty estimates are too opti-
mistic, then they may cause true navigational corrections not to be believed. Thus,
the better the uncertainty model, the tighter our filter, and the better the navigation
should be.
Unfortunately, things change. We may find the perfect parameters for uncertainty at
installation, only to find them less accurate months or years later. Gears wear, carpet
wears, road conditions change, etc. For this reason, it is very useful to learn the
proper
error factors as the robot drives. This learning can most easily be accomplished by a
program that statistically studies the operation of the robot and the fixes it accepts.
If these statistics indicate that corrections are beginning to regularly approach the
magnitude of the uncertainty, it may be useful to learn new error factors.
Uses of uncertainty
The importance of the uncertainty estimate cannot be overstated. In the coming
chap-
ters, we will see that this estimate is crucial in acquiring and processing navigation
data. It is also important in controlling the behavior of the robot in such a way as to
assure safe operation.
Hard Navigation vs.
Fuzzy Navigation
11
CHAPTER
145
We have discussed the importance of knowing uncertainty as a control over the
navigation filtering process, but we have yet to consider the mechanism for this
control. Here we leave the world of rigid mathematics and move into a more subjec-
tive one. The concepts that follow are ones that I have developed and found useful.
Following the principle of enlightened instinct you may find methods that work even
better. These proven concepts are very simple and straightforward
1
.
Sensor data and maps
Sensors represent one of the many enabling technologies that are making autonomous
robots more capable every year. A decade ago, the best affordable sensor for a mobile
robot was a short-range sonar system
2
. Navigation based on such sensors worked very
much the way a blind person uses a cane.
Today, we have affordable lidar sensors that can read ordinary objects beyond 10
meters, and reflective markers as far away as 50 meters. Despite these developments,
the fundamental problem remains the same. At any given time, a robot can image
only a small part of its world with its sensors, and the images received will always
contain anomalies.
1
Nothing more complex than simple vector manipulation is required. (See Appendix A.)
2
Even with such limited sensors, robots were developed that could navigate many indoor
environments.
146
Chapter 11
Range data from a lidar is far richer than that from sonar, but even so, it remains a
skewed and partial perception of reality as Figure 11.1 demonstrates. For example,
areas like “A” where no target is present are usually reported as being at the system’s
maximum range. Shiny objects such as the glass fronts of the vending machines “B”
specularly reflect the beam instead of returning it to the ranging unit. Specular reflec-
tion is the effect seen in a mirror, with the angle of incidence being equal to the
angle of reflection.
In the case of the upper vending machine, the lidar actually reports the reflection
“D” of
the file cabinet “C” because of these reflections. The shiny paint of the upper file
cabinet also causes a small amount of specular reflection “E” because the angle of in-
cidence of the laser beam is so shallow. Notice that the workbenches on the left are
above the lidar scan height, so only their legs and those of their chairs are detected
by the lidar. Worse, some of these legs are masked by other objects.
Figure 11.1. Lidar range data for an indoor environment
147
Hard Navigation vs. Fuzzy Navigation
Range data from Figure 11.1 can be filtered by simple techniques such as eliminating
any lines that lay radial to the sensor or which have one or more end points at the
rang
e limit. The result is shown in Figure 11.2. This scene still bares little resem-
b
lance to the map. As the robot moves, it will see things differently, and if the
odometry
is sufficiently reliable, a more complete map can be built from successive perspec
tives.
Here we face the same tradeoff discussed earlier. If we wait and drive long enough to
see the room from many perspectives, our position estimate may have degenerated to
the point that we are no longer correlating things in their proper places. Therefore,
the robot will quickly need to identify things in the scene it can use to verify and
correct its position estimate. One solution is to select navigation features ahead of
time that will be easily recognized.
Navigation features
A navigation feature is an expected (permanent) object that a robot’s sensors can
detect and measure, and that can be reasonably discriminated from other objects
around it. This navigation feature may be a part of the environment, or something
Figure 11.2. Lidar range data after initial filtering
148
Chapter 11
added to the environment for the robot’s purposes
3
. Features that are added to the
environment for navigation purposes are called fiducials or fids. Robot engineers
often refer to the need to add such artificial references as “decorating the environ-
ment,” a phrase of mild derision.
In the days when sonar was the best available sensor technology, the programmer
had no choice but to use the very narrow range of navigation features that sonar
could
detect and discriminate. As sensor systems have become more capable, the naviga-
tion features available to robots have become more complex. In many ways, this
development cycle has paralleled the history of modern aircraft navigation, espe-
cially as it accelerated rapidly during World War II.
Here we pick up the story where we left off in Chapter 7. As WWII progressed, the
allies turned the tables and began bombing operations over occupied Europe. Now
the British Royal Air Force (RAF) began experiencing the same heavy losses of
bombers that the Luftwaffe had experienced during the Battle of Britain. Like the
Germans, they switched to night bombing, and they too found accurate navigation
over blacked-out terrain to be very difficult. Since they had defeated the German
beam
systems, the British looked for a more robust solution to the navigation problem.
A new downward-looking radar was developed that could show the navigator a
representation of the ground below. Although much of the terrain showed up as a
confusing jumble of blips (like the lidar data in Figure 11.2), some features like rivers
and shorelines stood out clearly. The British thus navigated by dead reckoning until
such an easily recognized feature was reached, and then corrected their position
estimates. Missions were planned to assure that the bombers would fly over an easily
recognized feature shortly before they reached their targets
4
.
3
Even data from a GPS receiver is essentially the result of imaging a set of satellites. Most of the
concepts discussed here will thus work if a GPS system is simply considered to be one of the
robot’s sensors.
4
In response to this system, the Germans developed a receiver for their night fighters that could
home in on the radar transmissions of the RAF bombers. This continual game of measures and
countermeasures spurred the ever-faster development of electronic technology. Developments
ranging from microwave ovens to computers and fax machines all have their roots in this incred-
ible period of history.
149
Hard Navigation vs. Fuzzy Navigation
Hard navigation
Navigation of ships and planes was originally accomplished using manual calcula
tions.
These calculations took some considerable time, so updates in the craft’s position
estimates were infrequent. When a reasonable correction was calculated, it was sim-
ply accepted as fact. This is an early example of what we will call hard navigation.
The first semi-autonomous wheeled vehicles were AGVs (automatic guided ve
hicles)
that followed physical paths (stripes or wires in the floor). These vehicles performed
no true navigation as they had no sense of their position other than as related to the
path they were following. As these systems began to evolve toward more flexibility,
the first attempts at true navigation quite naturally used hard navigation.
One very early laser navigation system developed by Caterpillar Corp. triangulated
between reflective targets to fix its position. These targets looked like barcodes on
steroids, being several feet high and at least a foot wide. The reasoning for this was
that the vehicle needed to know which reflector was which so that it could perform
its calculations without the possibility of ambiguity. The vehicle could find its posi-
tion by no other means than this calculation, and it “believed” each calculation
literally. This is an example of hard navigation. Even the first robots that we field-
tested at Cybermotion used hard navigation.
Figure 11.3. Radar image of islands in a river as a navigation feature
150
Chapter 11
Flashback…
One of the problems of autonomous robot development is that our creations will quickly
evolve to work well in the development environment, but may be confounded by other
environments
5
. The first robot we fielded in a real-world application (circa 1987) had
only a few navigation tricks. It could home in on a beam from its charger to become
oriented (referenced) and it could use wide-beam digital sonar to image wall surfaces and
correct its odometry. In our facility this, of course, worked wonderfully.
When, however, we turned the robot loose in the customer’s facility, it weaved down the
halls like a drunken sailor. The customer was not impressed. This happened on a Friday,
and our customer was scheduled to show the system to his vice president on Monday. It
would be a busy weekend.
We determined the cause of the problem rather quickly. Where the walls in our offices
had been flat, the walls in this new facility were interrupted frequently by recessed picture
windows. There were also large doors that were routinely left slightly ajar. The problem
occurred when the robot imaged these sections. The heading correction implied by these
features was often at a significant angle to the true heading of the hallway. Each time
such a correction was made the robot would change course, only to correct itself a few
meters further down the hall.
The first thing we did was to set the acceptance threshold on the heading correction
much tighter
6
. If a fit wasn’t close to our current heading, we would simply reject it. This
eliminated the false angular corrections, but then other places around the building be-
gan to cause trouble.
There were several places where the robot was forced to drive for some distance without
any navigational corrections. When the robot crossed these gaps and began getting wall
readings again, it often rejected them as being at too great an angle.
Over the weekend, we applied the first crude fuzzy logic to our navigation process. The
results were remarkable, and we got through the demonstration that following Monday
with flying colors.
5
The mechanism at work here is clearly parallel to natural selection. This is another example of
how closely robotics parallels nature.
6
We could change this threshold on site because it was an easily accessible blackboard variable as
discussed in Chapter 6.
151
Hard Navigation vs. Fuzzy Navigation
The concept of fuzzy navigation
There is an old saying, “Don’t believe anything you hear, and only half what you
see!”
This could be the slogan for explaining fuzzy navigation. When police interrogate
suspects, they continue to ask the same questions repeatedly in different ways. This
iterative process is designed to filter out the lies and uncover the truth.
We could simply program our robot to collect a large number of fixes, and then sort
through them for the ones that agreed with each other. Unfortunately, as it was
doing this, our robot would be drifting dangerously off course. We need a solution
that responds minimally to bad information, and quickly accepts true information.
The trick is therefore to believe fixes more or less aggressively according to their
quality.
If a fix is at the edge of the believable, then we will only partially believe it. If this is
done correctly, the system will converge on the truth, and will barely respond at all
to bad data. But how do we quantify the quality of a fix? There are two elements to
quality:
1. Feature image quality
2. Correction quality
Feature image quality
The image quality factor will depend largely on the nature of the sensor system and
the feature it is imaging. For example, if the feature were a straight section of wall,
then the feature image quality would obviously be derived from how well the sensor
readings match a straight line. If the feature is a doorway, then the image data qual-
ity will be based on whether the gap matches the expected dimensions, and so forth.
The first level of sensor processing is simply to collect data that could possibly be
associated with each feature. This means that only readings from the expected
position of the feature should be collected for further image processing. This is the
first place that our uncertainty estimate comes into use.
Figure 11.4 shows a robot imaging a column. Since the robot’s own position is
uncer
tain,
it is possible the feature will be observed within an area that is the mirror
image of the
robot’s own uncertainty. For example, if the robot is actually a meter closer to
the
feature than its position estimate indicates, then to the robot the feature will
appear
to be a meter closer than expected. The center of the feature may thus be in an area
the size of the robot’s uncertainty around the known (programmed) position of the
152
Chapter 11
feature. Since the column is not a point, we must increase this area by the radius of
the column and collect all points that lay within it for further processing.
Position estimate
Uncertainty
Programmed
feature position
Feature position
window
Figure 11.4. Using position uncertainty to find a feature’s window
The feature position window gets even larger when we include the robot’s heading
uncertainty as demonstrated in Figure 11.5.
Figure 11.5. Feature window compensated for heading uncertainty
Position estimate
Uncertainty
Programmed
feature position
Feature position
window
Heading Uncertainty