Cranes – Design, Practice, and Maintenance phần 2 pptx
Bạn đang xem bản rút gọn của tài liệu. Xem và tải ngay bản đầy đủ của tài liệu tại đây (980.53 KB, 35 trang )
Introduction 15
Fig. 1.3.11 Container mover
Fig. 1.3.12 Excavator
Cranes – Design, Practice, and Maintenance16
Fig. 1.3.13 Shuttle carrier
1.4 Capacities, number of cycles, cycle-time
Container quay cranes
In the container business, the containers are referred to as TEUs. A
TEU is a 20 ft equivalent unit. A 20 ft container is one TEU, and a
40 ft container is two TEUs. In converting the number of TEUs to the
number of ‘moves’ it can be assumed that a ratio of 1 :1 of 20 ft to
40 ft containers does not exist today. Therefore, a TEU factor of 1,5 is
produced. As the proportion of 40 ft containers seems to be increasing,
the TEU factor will rise, and in the near future it will be reasonable to
assume a TEU factor of 1,6.
Introduction 17
In container handling operations managers often say that they expect
and achieve a high number of ‘cycles’ or ‘moves’ per hour. Theoretically
the time a duty cycle takes can be calculated, but factors that can dis-
turb or affect efficiency must also be taken into account. Many oper-
ators state that they would like to calculate using a capacity of 100–
125 containers per hour per ship using a maximum of three to four
container quay cranes, working together loading or unloading one ship.
Example
– Container vessel 4000 TEU
– Number of containers with a TEU 4000ë1,5G2666 cont.
factor of 1,5
– Number of containers to be unloaded 2666 · 0,6G1600 cont.
in the particular harbourA60%
– Assumed number of containers which G1200 cont.
have to be loaded
– Total number of containers which G2800 cont.
have to be handled
– Total of the time which the vessel is 24 hours
to be allowed to stay moored
– Needed as average hour capacity 2800ë24G117 cont.͞hr
What are the disturbances and how great is their impact?
The following disturbances must be considered.
Average operation time over a number of vessels:
(Normal, real operation time, without disturbancesG100%)
– Time for lashing͞unlashing –
– Time to unlock͞lock semi-automatic container cones –
– Dealing with hatch covers –
– Hoisting͞lowering the boom –
– Breakdown of the crane –
– Break for meals͞refreshments –
Cranes – Design, Practice, and Maintenance18
– Shift changes –
– Waiting for transportation ashore –
– Loss of time due to jammed twistlocks –
– Delays due to the vessel –
– Waiting time to start work –
– Time to examine control seals, any damage, and –
the CSC plate
Total %
It is vital to be aware that, under certain circumstances, the total of
these disruptions can be up to 30–40 percent of the potential operation
time. It is often assumed that capacity increases when the movements
are automated or semi-automated, but the level of improvement in
capacity varies from harbour to harbour and from operative to opera-
tive. The capacity of a container quay crane will be greatest when a
skilled crane driver is being used. However, people do tire but auto-
mation never becomes fatigued in the same way. Therein lies the
difference!
In the USA the following productivity measures have been developed
by, among others, the National Ports and Waterways Institute. The
data here are by kind permission of Dr A. Ashar.
Port timeGPort access timeCTerminal preparation time
CTerminal handling time
Terminal handling timeGContainer moves͞net berth productivity
Net berth productivityGNet gang productivity
BAverage number of gangs
Container moves
While serving a ship a gang may perform a series of direct and indirect
activities. The activities are usually qualified by ‘moves’, the four most com-
mon types of which are:
(a) Load͞unload – the transfer of domestic (import and export) and
transhipment boxes between ship and yard;
(b) Re-handle – the transfer of transhipment boxes between ship and
dock for a later transfer from the dock to the same ship;
Introduction 19
(c) Shifting on-board – the transfer of boxes between bays (cells) without
staging them on dock;
(d) Hatch opening͞closing – the transfer of hatchcovers between the ship
and the dock.
Definitions of times, activities, and quantities
Ship and gang times
The services that a ship receives at a port begin when the ship arrives at
the entry buoy and ends when the ship passes the buoy on its way out,
after finishing loading͞unloading its cargo. The actual handling of cargo is
performed by one or more gangs, each using a shore-based or ship-based
crane. The times and the activities are generally divided into those related
to the ship itself, and those related to the gangs or cranes working the
ship. The ship handling process involves many activities and times. For
simplification, the times are incorporated into six functional categories; three
related to ships and three to gangs.
Ship times include:
(a) Port time – the buoy-to-buoy time; the total time that the ship spends
at a port, including waiting for a berth, documents, pilot, tugs, delays
due to bad weather, etc.
(b) Gross berth time – the first-to-last line time, the total time that a ship
is at berth, including ship preparations, waiting for documents, gangs,
beginning of shift, change of shifts, availability of cargo, etc. and the
major delays during work due to equipment breakdowns, bad weather,
etc.
(c) Net berth time – the first unlash-to-last lash-time, or the working time
of a ship at berth, during which gangs load͞unload the containers and
perform related activities such as lashing͞unlashing, placing͞remov-
ing cones, opening͞closing hatchcovers, etc. The net berth time
includes minor during-work interruptions due to unavailability of cargo,
equipment breakdowns, etc.
Gang (crane) times include:
(a) Gross gang time – the time that a gang is available (assigned) to work
a ship and for which the gang is paid, including waiting times before
and after work (stand-by) and interruptions during work.
(b) Net gang time – the time that a gang is actually working, including
handling boxes and performing other, indirect activities, along with
during-work minor interruptions.
(c) Net͞net gang time – the same as net gang time, but only including
the time spent handling containers.
Cranes – Design, Practice, and Maintenance20
Ship and gang productivity
Ship productivity includes three measures:
(a) Port accessibility – the difference between port time and gross berth
time. This measure reflects:
– the geographical situation of a port, mainly the distance and navi-
gation conditions on the access channel;
– availability of pilots and tugs;
– availability of governmental agencies responsible for clearing ships,
crews, and cargo; and
– availability of berthage.
(b) Gross berth productivity – ‘moves’ (boxes) transferred between the
ship and the dock͞yard, divided by ship’s gross berth time – the
difference between the first and the last line. This measure reflects
the shift structure and labour situation.
(c) Net berth productivity – the same as gross berth productivity, but using
net berth time. This measure reflects the number of gangs (cranes)
assigned to the ship and the net gang productivity (see below).
Gang productivity also includes three measures:
(a) Gross gang productivity – ‘moves’ divided by gross gang time. This
measure reflects labour contract, especially regarding idle ‘stand-by’
times at the beginning, during, and end of shifts ‘early finish’.
(b) Net gang productivity – the same as gross gang productivity, but using
net gang time. This measure reflects necessary, although non-
productive, that is not producing ‘moves’, activities such as handling
hatch covers, shifting boxes, on-board (cell-to-cell) ‘moves’, inserting͞
removing cones, etc.
(c) Net͞net gang productivity – the same as above but using the net͞net
gang time. This measure, also called ‘pick rate’, reflects the technical
capability of facilities and equipment, along with the proficiency of the
labour in operating them and the competence of terminal management
in planning and controlling them.
Since all times are usually measured in hours, the productivity measures are
all expressed in moves͞hours.
Grab unloaders
The definition of a grab unloader is a ship-to-shore unloader with a
built in hopper. The maximum capacity of these unloaders can be from
1500 tons per hour up to 6000 tons per hour. Unlike a continuously
Introduction 21
Fig. 1.4.1 Break-down of ship and gang times (by kind permission of Dr A.
Ashar)
running conveyor whose capacity can be easily defined, the definition
of the unloading capacity of the intermittently working grab-unloader
is less simple.
Different terms are used:
(a) maximum capacity;
(b) free digging capacity; and
(c) average capacity.
Maximum capacity
This is the maximum capacity that can be reached. It depends upon the
shortest cycle time, the maximum load of the grab, the skill of the
operator, and the shape of the hatch of the ship which is to be unloaded.
Operator skill and hatch configuration, are factors which equally affect
the free digging and average capacity. In fact a crane driver can main-
tain this capacity for only a short period of time. The rating of the hoist
motors and trolley travelling motors must be designed so that working
at maximum capacity does not lead to overloading or overheating that
would lead to further loss of potential maximum capacity.
Free-digging capacity
This is the capacity that can be maintained during a certain time, under
certain conditions, with a skilled crane driver and takes into account
Cranes – Design, Practice, and Maintenance22
Table 1.4.1 Definition of productivity measures
Parameter Notation Unit Description
Ship times
Port time Tp Hour Buoy-to-buoy, including wait
at anchorage (for pilot, tug,
berth, clearance, weather,
etc.)
Gross berth time Tbg Hour First-to-last line, including
waiting before͞after work (for
gang, clearance, etc.)
Net berth time Tbn Hour First-to-last box, when gangs
are assigned including minor
waiting during work (for
stand-bys, meals,
breakdowns, etc.)
Gang times
Gross gang time Tgg Hour Assigned (paid) gang time,
including stand-by (for
vessel, cargo, equipment,
etc.) but excluding meal
breaks
Net gang time Tgn Hour Working gang time (first-to-
last box), including handling
hatchcovers and minor
waiting during work (for
cargo, equipment,
documents, etc., but
excluding meal break)
Net͞net gang time Tgnn Hour Working gang time handling
boxes only
Gang activities
Ship-to-yard Sy Box Transferring boxes between
ship and container yard
Ship-to-dock Sd Box Transferring boxes between
ship and dock (re-handle,
one way)
Ship-to-ship Ss Box Transferring boxes between
cells (shifting on-board)
Ship-to-dock Hc Hatchcover Transferring hatchcovers
between ship and dock
‘Moves’ Mv Box SyCSd
Productivities measures
Port accessibility Ba Hours TpATbg
Gross berth productivity Pbg Moves͞Hour Mv͞Tbg
Net berth productivity Pbn Moves͞Hour Mv͞Tbn
Gross gang productivity Pgg Moves͞Hour Mv͞Tgg
Net gang productivity Pgn Moves͞Hour Mv͞Tgn
Net–net gang productivity Pgnn Moves͞Hour Mv͞Tgnn (‘pick rate’)
Introduction 23
the assumed discharge trajectory. It does not take into account any time
for shifting the unloader from hatch to hatch, or time for a break, etc.
In addition, the type and conditions of the material which has to be
transported must be defined. Commonly the starting point of the trajec-
tory of the grab is taken in the middle of the hatch of the ship (x co-
ordinate) and the mean low water line (MLW) as y co-ordinate (see
Fig. 1.4.2). The end point of the trajectory should be almost at the
centre of the hopper. Care should be taken with the hatch opening.
Fig. 1.4.2 Grab unloader
Aûerage capacity
The material-handling manager is also very interested in the average
capacity of the unloader. Defining the average capacity per hour is more
complicated because it depends upon how the start and finish of the
job are measured. It is defined as The total amount of material that has
been discharged during a longer period of time diûided by the number of
hours. During this period a great deal of time is lost in shifting the
unloader from hatch to hatch, removing and replacing the hatches, meal
and refreshment breaks for the working crew, and cleaning up the
hatches with a payloader, etc.
Sometimes it is necessary to consider the ‘turn-around time’ for
determining the average capacity. The turn-around time is then con-
sidered to be from the moment of mooring the ship or opening the
hatches, up to closing the empty hatches or de-mooring the ship.
The average capacity can be roughly indicated as a certain percentage
of the maximum capacity or free-digging capacity. The amount of this
Cranes – Design, Practice, and Maintenance24
percentage depends wholly upon the local circumstances, the skill and
enthusiasm of the crane driver and the dock personnel, the type of ship,
the dimensions of the hatches, the ability to clean up those hatches, and
a myriad of other factors.
Larger unloaders are normally semi-automated. The crane driver, sit-
ting in a movable, but stationary cabin, digs in the grab with the help
of the controllers. After having hoisted the grab up to a certain position,
a knob is pushed which starts the automation. The grab automatically
runs towards the hopper, opens, discharges the material, and automati-
cally returns to the point where the crane driver started the automation.
The crane driver then takes command again and lowers the grab further
to fill it. Duty cycles of approximately 45 seconds can be achieved.
However, the average capacity can be as low as 80 or even 60 percent
of the free-digging capacity.
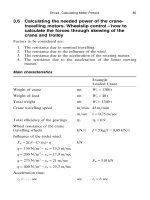
For example, the unloading of medium-sized bulk carriers in a par-
ticular blast furnace plant with ore, gave, under very good conditions,
Fig. 1.4.3.
Fig. 1.4.3 Production scheme
Introduction 25
Fig. 1.4.4 Double grab unloader
1.5 The influence of wind and storms
Wind and storms can influence the entire operation of cranes and can
even destroy whole cranes. It is vital to make an accurate calculation
of the wind forces which the cranes will meet ‘in operation’ as well as
‘out of operation’. In the 1940s the famous Swedish singer Zarah
Leander sang a beautiful song called ‘Der Wind hat mir ein Lied er-
za
¨
hlt’ (The wind has told me a song). How true that is.
Wind can be pleasant, strong, a storm, a gale, or a typhoon. The
crane must be able to drive against the windforce, which we call the
‘operating limit’. This operating limit should be indicated by the com-
pany which asks for a tender. In many parts of the world, this will be
a ûG20 m͞sec windspeed (force 8 on the Beaufort scale) which corre-
sponds with a dynamic pressure of the wind of qG250 N͞m
2
. During
a storm, this can become qG400 N͞m
2
or ûG25,3 m͞sec (force 10 on
the Beaufort scale means ûG24,5–28,4 m͞sec).
The relation between the wind-speed and the dynamic pressure of the
wind is as follows:
qG1͞16 · û
2
Cranes – Design, Practice, and Maintenance26
where qGdynamic pressure in kg͞m
2
and ûGwindspeed in m͞sec. In
the following pages the Rules for the Design of Hoisting Appliances of
the FEM 1.001; 3rd edition 1987, 10.01; booklet 2 are quoted. (All
extracts of the FEM standards are given by courtesy of the Comite
´
National Franc
¸
ais de la FEM in Paris.)
Table T.2.2.4.1.2.1 In-service design wind pressure
Wind pressure Wind speed
in service in service
Type of appliance (N͞m
2
)(m͞s)
Lifting appliance easily protected against wind
action or designed for use exclusively in light
wind. Erection operations. 125 14
All normal types of crane installed in the open 250 20
Appliances which must continue to work in high
winds* 500 28
* For example appliances of type 12a in Table T.2.1.2.5.
Action of wind on the load
The action of the wind on the hook load for a crane which handles miscel-
laneous loads shall be determined from the relationship:
FG2.5ABq
where
F is the force exerted by the wind on the hook load in N,
q is the in-service wind pressure from Table 2.2.4.1.2.1 in N͞m
2
A is the maximum area of the solid parts of the hook load in m
2(1)
. Where
this area is not known, a minimum value of 0.5 m
2
per tonne of safe
working load shall be used.
Where a crane is designed to handle loads of a specific size and shape only,
the wind loading shall be calculated for the appropriate dimensions and
configurations.
2.2.4.1.2.2. Wind out of service
This is a maximum (storm) wind for which the lifting machine is designed to
remain stable in out of service conditions, as indicated by the manufacturer.
The speed varies with the height of the apparatus above the surrounding
ground level, the geographical location and the degree of exposure to the
prevailing winds.
(1)
Where, exceptionally, a crane is required to handle loads of large surface area, it
is admissible for the manufacturer to determine a wind speed less than that speci-
fied in Table T.2.2.4.1.2.1 above which such loads shall not be handled.
Introduction 27
Table 1.5.1 Wind scale and appertaining wind pressure
(q)
Wind speed averaged over
10 min. At 10 m height above Wind pressure
flat ground or above sea Name
(N͞m
2
)
Wind Above flat
force
(1)
m͞s
(1)
km͞h
(2)
ground Above sea
0 0,0–0,2 0,0–0,7 Calm Calm 0–0,03
1 0,3–1,5 1,1–5,4 Light wind Flat calm 0,06–1,4
2 1,6–3,3 5,8–11,9 Light wind Flat͞freshening 1,6–6,8
3 3,4–5,4 12,2–19,4 Moderate wind Slight fresh 7,2–18,2
4 5,5–7,9 19,8–28,4 Moderate wind Moder. fresh 18,8–39
5 8,0–10,7 28,8–38,5 Fairly strong wind Fresh breeze 40–71
6 10,8–13,8 38,9–49,6 Strong wind Stiff breeze 73–118
7 13,9–17,1 50–61,5 Hard wind Hard wind 121–182
8 17,2–20,7 61,9–74,5 Stormy wind Stormy wind 184–267
9 20,8–24,4 74,9–87,8 Storm Storm 270–371
10 24,5–28,4 88,2–102,2 Heavy storm Heavy storm 375–502
11 28,5–32,6 102,6–117,3 Very heavy Very heavy 509–662
storm storm
12 H32,6 H117,3 Hurricane Hurricane H662
Notes:
(1)
The figure for the wind force is borrowed from the International Beaufort scale, which is
originally defined above sea. Depending on the dimensions of waves and the presence of
foam crests and such like, the wind velocity can be estimated with the help of this scale.
Above land therefore it is more difficult, and inaccurate, to work with this scale. However, the
indication of the wind force and the relation with the wind velocity, now measured in m͞s,
are applied internationally both above land, and above sea, for the classification of wind.
(2)
The values for the wind velocity in km͞h are deduced from those in m͞s. There are several
methods to calculate the force of the wind on a crane, but it is always necessary to calculate
carefully the projected areas; the areas exposed to a direct hit and also all the shielded areas
of all parts of the crane which are affected by the wind.
Fig. 1.5.1 The Beaufort scale
Cranes – Design, Practice, and Maintenance28
For lifting appliances used in the open air, the normal theoretical wind
pressure and the corresponding speed, for ‘‘out of service’’ conditions are
indicated in the Table T.2.2.4.1.2.2.
Table T.2.2.4.1.2.2 Out of service wind
Approximate
Height above Out of service design equivalent out of service
ground level wind pressure design wind speed
(m) (N͞m
2
)(m͞s)
0 to 20 800 36
20 to 100 1100 42
More than 100 1300 46
When calculating wind loads for out of service conditions the wind pressure
may be taken as constant over the vertical height intervals in Table
T.2.2.4.1.2.2. Alternatively, the design wind pressure at the top of the crane
may be assumed constant over its entire height.
Where cranes are to be permanently installed or used for extended periods
in areas where wind conditions are exceptionally severe, the above figures
may be modified by agreement between the manufacturer and purchaser in
the light of local meteorological data.
For certain types of appliance of which the jib can be quickly lowered,
(such as a tower crane which can be easily lowered by a built-in mechanism)
the out of service wind need not be taken into consideration provided the
machine is intended for lowering after each working day.
2.2.4.1.3 WIND LOAD CALCULATIONS
For most complete and part structures, and individual members used in
crane structures the wind load is calculated from:
FGA · q · C
f
where
F is the wind load in N,
A is the effective frontal area of the part under consideration in m
2
,
q is the wind pressure corresponding to the appropriate design condition
in N͞m
2
,
C
f
is the shape coefficient in the direction of the wind for the part under
consideration.
The total wind load on the structure is taken as the sum of the loads on
its component parts.
In determining strength and stability requirements of the appliance the
total wind load shall be considered.
Introduction 29
The magnitude of the wind load to be allowed for in the design of a mech-
anism, in determining the motor and brake requirements for the mechanism
and to provide for the safety of the appliance in the wind, are given in the
chapter dealing with the design of mechanisms.
2.2.4.1.4 SHAPE COEFFICIENTS
2.2.4.1.4.1 Individual members, frames, etc.
Shape coefficients for individual members, single lattice frames and machin-
ery houses are given in Table T.2.2.4.1.4.1. The values for individual mem-
bers vary according to the aerodynamic slenderness and, in the case of
large box sections, with the section ratio. Aerodynamic slenderness and
section ratio are defined in Fig. 2.2.4.1.4.1.
Table T.2.2.4.1.4.1 Force coefficients
Aerodynamic Slenderness 1͞bor1͞D
(1)
Type Description ⁄51020304050H50
Individual Rolled sections [ ] 1,15 1,15 1,3 1,4 1,45 1,5 1,6
members Rectangular hollow 1,4 1,45 1,5 1,55 1,55 1,55 1,6
sections up to 356 mm
square
and 254B457 mm 1,05 1,05 1,2 1,3 1,4 1,5 1,6
rectangular
Other sections 1,30 1,35 1,60 1,65 1,70 1,80 1,80
Circular sections where:
D · V
S
F6m
2
͞s 0,60 0,70 0,80 0,85 0,90 0,90 0,90
D · V
S
¤ 6m
2
͞s 0,60 0,65 0,70 0,70 0,75 0,80 0,80
b͞d
Rectangular hollow 2 1,55 1,75 1,95 2,10 2,20
sections over 356 mm 1 1,40 1,55 1,75 1,85 1,90
square and 0,5 1,0 1,20 1,30 1,35 1,40
254B457 mm 0,25 0,80 0,90 0,90 1,0 1,0
rectangular
Single lattice Flat-sided sections 1,70
frames Circular sections where:
D · V
s
F6m
2
͞s 1,10
D · V
s
¤ 6m
2
͞s 0,80
Machinery Rectangular clad 1,10
houses etc. structures on ground or
solid base
(1)
See Fig. 2.2.4.1.4.1.
Cranes – Design, Practice, and Maintenance30
The wind load on single lattice frames may be calculated on the basis of
the coefficients for the individual members given in the top part of Table
T.2.2.4.1.4.1. In this case the aerodynamic slenderness of each member
shall be taken into account. Alternatively the overall coefficients for lattice
frames constructed of flat-sided and circular sections given in the middle
part of the table may be used.
Where a lattice frame is made up of flat-sided and circular sections, or of
circular sections in both flow regimes (D · V
S
F6m
2
͞s and D · V
S
¤ 6m
2
͞s)
the appropriate shape coefficients are applied to the corresponding frontal
areas.
Where gusset plates of normal size are used in welded lattice construction
no allowance for the additional area presented by the plates is necessary,
provided the lengths of individual members are taken between the centres
of node points.
Shape coefficients obtained from wind-tunnel or full-scale tests may also
be used.
(I) Aerodynamic slenderness:
length of member
breadth of section across wind front
G
l*
b
or
l*
D
* In lattice construction the lengths of individual members are taken
between the centres of adjacent node points. See diagram below.
(II) Solidity ratioG
area of solid parts
enclosed area
G
A
A
e
G
∑
n
l
liBbi
LBB
Introduction 31
(III) Spacing ratioG
distance between facing sides
breadth of members across wind front
G
a
b
or
a
B
Fig. 2.2.4.1.4.1 Definitions: Aerodynamic Slenderness, Solidity Ratio, Spacing
Ratio, and Section Ratio
for ‘a’ take the smallest possible value in the geometry of the exposed
face.
(IV) Section ratioG
breadth of section across wind front
depth of section parallel to wind flow
G
b
d
2.2.4.1.4.2 Multiple frames of members: shielding factors
Where parallel frames or members are positioned so that shielding takes
place, the wind loads on the windward frame or member and on the unshel-
tered parts of those behind it are calculated using the appropriate shape
coefficients. The wind on the sheltered parts is multiplied by a shielding
factor
η
given in Table T.2.2.4.1.4.2. Values of
η
vary with the solidity and
spacing ratios as defined in Fig. 2.2.4.1.4.1.
Table T.2.2.4.1.4.2 Shielding coefficients
Solidity ratio A͞A
e
Spacing ratio
a͞b 0,1 0,2 0,3 0,4 0,5 ¤ 0,6
0,5 0,75 0,40 0,32 0,21 0,15 0,10
1,0 0,92 0,75 0,59 0,43 0,25 0,10
2,0 0,95 0,80 0,63 0,50 0,33 0,20
4,0 1,0 0,88 0,76 0,66 0,55 0,45
5,0 1,0 0,95 0,88 0,81 0,75 0,68
6,0 1,0 1,0 1,0 1,0 1,0 1,0
Where a number of identical frames or members are spaced equidistantly
behind each other in such a way that each frame shields those behind it,
the shielding effect is assumed to increase up to the ninth frame and to
remain constant thereafter.
The wind loads are calculated as follows:
On the 1st frame F
1
GA · q · C
f
in N
On the 2nd frame F
2
G
η
· A · q · C
f
in N
Cranes – Design, Practice, and Maintenance32
On the nth frame F
n
G
η
(n−1)
· A · q · C
f
in N
(where n is from
3to8)
On the 9th and F
9
G
η
8
· A · q · C
f
in N
subsequent frames
The total wind load
is thus:
Where there are up F
total
G[1C
η
C
η
2
C
η
3
C···
η
(n−1)
]A · q · C
f
in N
to 9 frames
GA · q · C
f
1A
η
n
1A
η
Where there are F
total
G[1C
η
C
η
2
C
η
3
C···
η
8
C(nA9)
η
8
]A · q · C
f
in N
more than 9 frames
GA · q · C
f
΄
1A
η
9
1A
η
C(nA9)
η
8
΅
Note The term
η
x
used in the above formula is assumed to have a lower limit of
0,10. It is taken as 0,10 whenever
η
x
F0,10.
2.2.4.1.4.3 Lattice towers
In calculating the ‘‘face-on’’ wind load on square towers, in the absence of
a detailed calculation, the solid area of the windward face is multiplied by
the following overall force coefficient:
For towers composed of flat-sided 1,7 · (1C
η
)
sections
For towers composed of circular
sections
where D · V
S
F6m
2
͞s 1,1 · (1C
η
)
where D · V
S
¤ 6m
2
͞s 1,4
The value of
η
is taken from Table 2.2.4.1.4.2 for a͞bG1 according to the
solidity ratio of the windward face.
The maximum wind load on a square tower occurs when the wind blows
on to a corner. In the absence of a detailed calculation, this load can be
considered as 1,2 times that developed with ‘face-on’ wind on one side.
2.2.4.1.4.4 Parts inclined in relation to the wind direction
Individual members, frames, etc.
Where the wind blows at an angle to the longitudinal axis of a member or
to the surface of a frame, the wind load in the direction of the wind is obtained
from:
FGA · q · C
f
sin
2
θ
in N
Introduction 33
where F, A, q and C
f
are as defined in Subsection 2.2.4.1.3 and
θ
is the
angle of the wind (
θ
F90°) to the longitudinal axis or face.
Lattice trusses and towers
Where the wind blows at an angle to the longitudinal axis of a lattice truss
or tower, the wind load in the direction of the wind is obtained from:
FGA · q · C
f
· K
2
in N
where F, A, q and C
f
are as defined in Subsection 2.2.4.1.3 and
K
2
G
θ
50(1,7ASp͞S)
which cannot be less than 0,35 or greater than 1.
Where
θ
is the angle of the wind in degrees (
θ
F90°) to the longitudinal axis
of the truss or tower.
Sp is the area in m
2
of the bracing members of the truss or tower projected
on to its windward plane.
S is the area in m
2
of all (bracing and main) members of the truss or tower
projected on to its windward plane.
The value of K
2
is assumed to have lower and upper limits of 0,35 and
1,0 respectively. It is taken as 0,35 whenever the calculated value <0,35
and as 1,0 whenever the calculated valueH1,0.
The DIN–BS–ISO and CEN standards calculate the wind influence in
a manner which deviates slightly from FEM.
In the USA and a number of other countries it is permissible to make
an accurate scale model (scale 1 :50) of the crane and to test the scale
model in an approved aeronautical laboratory, e.g. in a windtunnel.
The model also has to include aerodynamically representative surfaces
for the walkways, stairways, ladders, platforms, and other secondary
details as a minimum requirement.
The results have to be determined for the boom in the operating
positions as well as in the stowed positions and with the trolley located
in the critical point with and without load. Wind testing must involve
wind from several different directions.
In general this could result in a lower wind force on the crane, e.g.
FGc · q · A then becomes for the full crane: FG1,4 · q · A. This is some-
what lower than indicated by the standards.
A crane builder has to state openly how the windforces on the crane
have been calculated and show which motor powers and motor torques
Cranes – Design, Practice, and Maintenance34
this has led to. It must be kept in mind that it is a matter of torque
which has to be delivered by the motors to the crane or to the trolley.
MG
N · 9550
n
Nm
where
MGtorque in Nm on the motorshaft
NGthe motor power in kilowatts
nGnumber of revolutions per minute of the motor
A note with regard to the standards
It has been decided that the European Standards will be replaced by
the CEN standards (CENGComite
´
Europe
´
en de Normalisation). These
CEN standards are now developed (see Sections 5.1–5.3).]
To be able to meet the wind force on the crane only it is necessary that
MG
Σ(c · q · A) · D͞2
i ·
η
where
MGtotal torque, needed on the motorshaft(s), to drive the crane
against the windforce
Σ(c · q · A)Gtotal windforce
D͞2Gradius of the driven wheel
iGreduction of the gearings between the driven wheel and the driving
motor
iGn
motor
:n
wheel
η
Gtotal efficiency of the drive mechanism
The motors have to be able to deliver the necessary torque also at low
speeds during such a time that the crane driver can drive the crane
against the storm towards the storm pot, where the crane can be
anchored.
Considerations that must be borne in mind for a crane travelling
mechanism are (see also Chapter 3):
– the resistance due to nominal travelling;
– the resistances due to the influence of the wind;
– the resistances due to the acceleration of the linear moving masses;
and
– the resistances due to the acceleration of the rotating masses.
Introduction 35
The wind speeds and aerodynamic pressures become greater at greater
heights from the ground.
Table 1.5.2 Windspeeds etc., at greater heights
Aerodynamic pressure
Height above quay in Storm windspeed in
metres m͞sec qinN͞m
2
(in lbs͞sq ft)
0–20 metres 36 800 (16)
20–100 metres 42 1100 (22)
H100 metres 46 1300 (26)
1.6 Hatchless container vessels
Container vessels with hatches are well known. The deck-containers are
then loaded on top of the hatches and must be very well lashed with
lashings and semi-automated twist locks (SATLs) to prevent containers
being lost during a storm etc.
Unlashing respective. Lashing the containers, handling the SATLs,
and opening and closing the hull of vessels with hatches takes a con-
siderable time.
In order to overcome these problems, naval architects designed the
so-called ‘hatchless vessels’. These vessels have no hatches and
reinforced cell-guides run from the bottom of the vessel, up to almost
the top of the highest deck-container. Lashing of these deck-containers
and handling the hatches is then no longer necessary. This hatchless
construction saves a lot of work and time during unloading or loading
the vessel; in addition, the danger of losing containers in a storm is
fully avoided.
Nedlloyd and other stevedores have built a number of these hatchless
vessels. Nedlloyd states that they achieved 10–15 percent greater pro-
ductivity, although now all containers have to be hoisted over the
higher cell-guides.
The well-known Dutch naval architect Ir. E. Vossnack has made
designs for a series of modernized hatchless vessels which show interest-
ing design details. Figures 1.6.1 and 1.6.2 show some of the design
sketches of Ir. E. Vossnack.
Cranes – Design, Practice, and Maintenance36
Fig. 1.6.1 Hatchless vessel, 22 across
Introduction 37
Fig. 1.6.2 Capacity, width and draft, etc.
Cranes – Design, Practice, and Maintenance38
Fig. 1.6.3 Hatchless vessel
Chapter 2
Wire Ropes
2.1 Wire rope reeving systems
The system of the wire rope reeving differs from one crane type to
another. Two of the main reeving systems are indicated in the following
figures. In container cranes, the safety of the wire rope against rupture
Fig. 2.1.1 Normal hoist wire rope scheme for a container crane