An introduction to predictive maintenance - part 2 pot
Bạn đang xem bản rút gọn của tài liệu. Xem và tải ngay bản đầy đủ của tài liệu tại đây (331.21 KB, 46 trang )
and finance experts. Financial evaluation of preventive maintenance is divided gen-
erally into either single transactions or multiple transactions. If payment or cost reduc-
tions are multiple, they may be either uniform or varied. Uniform series are the easiest
to calculate. Nonuniform transactions are treated as single events that are then summed
together.
Tables 2–1 through 2–5 are done in periods and interest rates that are most applica-
ble to maintenance and service managers. The small interest rates will normally be
applicable to monthly events, such as 1 percent per month for 24 months. The larger
interest rates are useful for annual calculations. The factors are shown only to three
decimal places because the data available for calculation are rarely even that accurate.
The intent is to provide practical, applicable factors that avoid overkill. If factors that
are more detailed, or different periods or interest rates, are needed, they can be found
in most economics and finance texts or automatically calculated by the macros in com-
puterized spreadsheets. The future value factors (Tables 2–1 and 2–3) are larger than
1, as are present values for a stream of future payments (Table 2–4). On the other
hand, present value of a single future payment (Table 2–2) and capital recovery (Table
2–5 after the first year) result in factors of less than 1.000. The money involved to
give the answer multiplies the table factor. Many programmable calculators can also
work out these formulas. If, for example, interest rates are 15 percent per year and the
total amount is to be repaid at the end of three years, refer to Table 2–1 on future
38 An Introduction to Predictive Maintenance
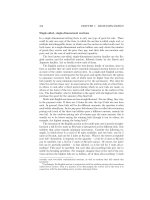
Table 2–5 Capital Recovery, Uniform Series with Present Value $1
Interest
Periods 1% 2% 4% 10% 15% 20%
1 1.010 1.020 1.040 1.100 1.150 1.200
2 .508 .515 .530 .576 .615 .654
3 .340 .347 .360 .402 .438 .475
4 .256 .263 .275 .315 .350 .386
5 .206 .212 .225 .264 .298 .334
6 .173 .179 .191 .230 .264 .301
7 .149 .155 .167 .205 .240 .277
8 .131 .137 .149 .187 .223 .261
9 .117 .122 .135 .174 .210 .248
10 .106 .111 .123 .163 .199 .239
11 .096 .102 .114 .154 .191 .231
12 .089 .095 .107 .147 .184 .225
18 .061 .067 .079 .120 .163 .208
24 .047 .053 .066 .111 .155 .203
36 .0033 .038 .051 .094 .151 .200
48 .026 .032 .045 .092 .150 .200
60 .022 .028 .043 .091 .150 .200
CP P
ii
i
n
n
=
+
()
+
()
-
Ê
Ë
Á
ˆ
¯
˜
1
11
value. Find the factor 1.521 at the intersection of three years and 15 percent. If our
example cost is $35,000, it is multiplied by the factor to give:
$35,000 ¥ 1.521 = $53,235 due at the end of the term
Present values from Table 2–2 are useful to determine how much we can afford to
pay now to recover, say, $44,000 in expense reductions over the next two years. If the
interest rates are expected to be lower than 15 percent, then:
$44,000 ¥ 0.75% = $33,264
Note that a dollar today is worth more than a dollar received in the future. The annuity
tables are for uniform streams of either payments or recovery. Table 2–3 is used to
determine the value of a uniform series of payments. If we start to save now for a
future project that will start in three years, and save $800 per month through reduc-
tion of one person, and the cost of money is 1 percent per month, then $34,462 should
be in your bank account at the end of 36 months.
$800 ¥ 43.077 = $34,462
The factor 43.077 came from 36 periods at 1 percent. The first month’s $800 earns
interest for 36 months. The second month’s savings earns for 35 months, and so on.
The use of factors is much easier than using single-payment tables and adding the
amount for $800 earning interest for 36 periods ($1,114.80), plus $800 for 35 periods
($1,134.07), and continuing for 34, 33, and so on, through one. If I sign a purchase
order for new equipment to be rented at $500 per month over five years at 1 percent
per month, then:
$500 ¥ 44.955 = $22,478
Note that five years is 60 months in the period column of Table 2–4. Capital recov-
ery Table 2–5 gives the factors for uniform payments, such as mortgages or loans that
repay both principal and interest. To repay $75,000 at 15 percent annual interest over
five years, the annual payments would be:
$75,000 ¥ 0.298 = $22,350
Note that over the five years, total payments will equal $111,750 (5 ¥ $22,350), which
includes the principal $75,000 plus interest of $36,750. Also note that a large differ-
ence is made by whether payments are due in advance or in arrears.
A maintenance service manager should understand enough about these factors to do
rough calculations and then get help from financial experts for fine-tuning. Even more
important than the techniques used is the confidence in the assumptions. Control and
finance personnel should be educated in your activities so they will know what items
are sensitive and how accurate (or best judgment) the inputs are, and will be able to
support your operations.
Financial Implications and Cost Justification 39
Trading Preventive for Corrective and Downtime
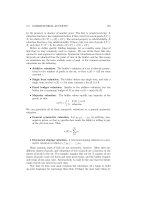
Figure 2–7 illustrates the relationships between preventive maintenance, corrective
maintenance, and lost production revenues. The vertical scale is dollars. The hori-
zontal scale is the percentage of total maintenance devoted to preventive maintenance.
The percentage of preventive maintenance ranges from zero (no PMs) at the lower
left intersection to nearly 100 percent preventive at the far right. Note that the curve
does not go to 100 percent preventive maintenance because experience shows there
will always be some failures that require corrective maintenance. Naturally, the more
of any kind of maintenance that is done, the more it will cost to do those activities.
The trade-off, however, is that doing more preventive maintenance should reduce both
corrective maintenance and downtime costs. Note that the downtime cost in this illus-
tration is greater than either preventive or corrective maintenance. Nuclear power-
generating stations and many production lines have downtime costs exceeding
$10,000 per hour. At that rate, the downtime cost far exceeds any amount of mainte-
nance, labor, or even materials that we can apply to the job. The most important effort
is to get the equipment back up without much concern for overtime or expense budget.
Normally, as more preventive tasks are done, there will be fewer breakdowns and
therefore lower corrective maintenance and downtime costs. The challenge is to find
the optimum balance point.
40 An Introduction to Predictive Maintenance
Figure 2–7 The relationship between cost and amount of preventive
maintenance.
As shown in Figure 2–7, it is better to operate in a satisfactory region than to try for a
precise optimum point. Graphically, every point on the total-cost curve represents the
sum of the preventive costs plus corrective maintenance costs plus lost revenues costs.
If you presently do no preventive maintenance tasks at all, then each dollar of effort
for preventive tasks will probably gain savings of at least $10 in reduced corrective
maintenance costs and increased revenues. As the curve shows, increasing the invest-
ment in preventive maintenance will produce increasingly smaller returns as the
breakeven point is approached. The total-cost curve bottoms out, and total costs begin
to increase again beyond the breakeven point. You may wish to experiment by going
past the minimum-cost point some distance toward more preventive tasks. Even
though costs are gradually increasing, subjective measures, including reduced confu-
sion, safety, and better management control, that do not show easily in the cost cal-
culations are still being gained with the increased preventive maintenance. How do
you track these costs? Figure 2–8 shows a simple record-keeping spreadsheet that
helps keep data on a month-by-month basis.
Financial Implications and Cost Justification 41
Figure 2–8 Preventive maintenance, condition monitoring, and lost
revenue cost, $000.
It should be obvious that you must keep cost data for all maintenance efforts in order
to evaluate financially the cost and benefits of preventive versus corrective mainte-
nance and revenues. A computerized maintenance information system is best, but data
can be maintained by hand for smaller organizations. One should not expect imme-
diate results and should anticipate some initial variation. This delay could be caused
by the momentum and resistance to change that is inherent in every electromechani-
cal system, by delays in implementation through training and getting the word out to
all personnel, by some personnel who continue to do things the old way, by statisti-
cal variations within any equipment and facility, and by data accuracy.
If you operate electromechanical equipment and presently do not have a preventive
maintenance program, you are well advised to invest at least half of your maintenance
budget for the next three months in preventive maintenance tasks. You are probably
thinking: “How do I put money into preventive and still do the corrective mainte-
nance?” The answer is that you can’t spend the same money twice. At some point,
you have to stand back and decide to invest in preventive maintenance that will stop
the large number of failures and redirect attention toward doing the job right once.
This will probably cost more money initially as the investment is made. Like any other
investment, the return is expected to be much greater than the initial cost.
One other point: it is useless to develop a good inspection and preventive task sched-
ule if you don’t have the people to carry out that maintenance when required. Careful
attention should be paid to the Mean Time to Preventive Maintenance (MTPM). Many
people are familiar with Mean Time to Repair (MTTR), which is also the Mean Cor-
rective Time (M
—
ct). It is interesting that the term MTPM is not found in any text-
books the author has seen, or even in the author’s own previous writings, although
the term M
—
pt is in use. It is easier simply to use Mean Corrective Time (M
—
ct) and
Mean Preventive Time (M
—
pt).
PM Time/Number of preventive maintenance events calculates M
—
pt. That equation
may be expressed in words as the sum of all preventive maintenance time divided by
the number of preventive activities done during that time. If, for example, five oil
changes and lube jobs on earthmovers took 1.5, 1, 1.5, 2, and 1.5 hours, the total is
7.5 hours, which divided by the five events equals an average of 1.5 hours each. A
few main points, however, should be emphasized here:
1. Mean Time Between Maintenance (MTBM) includes preventive and cor-
rective maintenance tasks.
2. Mean Maintenance Time is the weighted average of preventive and cor-
rective tasks and any other maintenance actions, including modifications
and performance improvements.
3. Inherent Availability (A
i
) considers only failure and M
—
ct. Achieved avail-
ability (A
a
) adds in PM, although in a perfect support environment. Oper-
ational Availability (A
0
) includes all actions in a realistic environment.
42 An Introduction to Predictive Maintenance
Too many maintenance functions continue to pride themselves on how fast they can
react to a catastrophic failure or production interruption rather than on their ability
to prevent these interruptions. Although few production engineers will admit their
continued adherence to this breakdown mentality, most plants continue to operate in
this mode.
3.1 MAINTENANCE MISSION
Contrary to popular opinion, the role of maintenance is not to “fix” breakdown in
record time; rather, it is to prevent all losses that are caused by equipment or system-
related problems. The mission of the maintenance department in a world-class orga-
nization is to achieve and sustain the following:
• Optimum availability
• Optimum operating conditions
• Maximum utilization of maintenance resources
• Optimum equipment life
• Minimum spares inventory
• Ability to react quickly
3.1.1 Optimum Availability
The production capacity of a plant is partly determined by the availability of produc-
tion systems and their auxiliary equipment. The primary function of the maintenance
organization is to ensure that all machinery, equipment, and systems within the plant
are always online and in good operating condition.
3
ROLE OF MAINTENANCE
ORGANIZATION
43
3.1.2 Optimum Operating Condition
Availability of critical process machinery is not enough to ensure acceptable plant per-
formance levels. The maintenance organization must maintain all direct and indirect
manufacturing machinery, equipment, and systems so that they will continuously be
in optimum operating condition. Minor problems, no matter how slight, can result in
poor product quality, reduced production speeds, or other factors that limit overall
plant performance.
3.1.3 Maximum Utilization of Maintenance Resources
The maintenance organization controls a substantial part of the total operating budget
in most plants. In addition to an appreciable percentage of the total-plant labor budget,
the maintenance manager often controls the spare parts inventory, authorizes the use
of outside contract labor, and requisitions millions of dollars in repair parts or replace-
ment equipment. Therefore, one goal of the maintenance organization should be effec-
tive use of these resources.
3.1.4 Optimum Equipment Life
One way to reduce maintenance cost is to extend the useful life of plant equipment.
The maintenance organization should implement programs that will increase the
useful life of all plant assets.
3.1.5 Minimum Spares Inventory
Reductions in spares inventory should be a major objective of the maintenance orga-
nization; however, the reduction cannot impair their ability to meet the first four goals.
With the predictive maintenance technologies that are available today, maintenance
can anticipate the need for specific equipment or parts far enough in advance to pur-
chase them on an as-needed basis.
3.1.6 Ability to React Quickly
All catastrophic failures cannot be avoided; therefore, the maintenance organization
must be able to react quickly to the unexpected failure.
3.2 E
VALUATION OF THE MAINTENANCE ORGANIZATION
One means to quantify the maintenance philosophy in your plant is to analyze the
maintenance tasks that have occurred over the past two to three years. Attention should
be given to the indices that define management philosophy.
One of the best indices of management attitude and the effectiveness of the mainte-
nance function is the number of production interruptions caused by maintenance-
related problems. If production delays represent more than 30 percent of total
44 An Introduction to Predictive Maintenance
production hours, reactive or breakdown response is the dominant management phi-
losophy. To be competitive in today’s market, delays caused by maintenance-related
problems should represent less than 1 percent of the total production hours.
Another indicator of management effectiveness is the amount of maintenance over-
time required to maintain the plant. In a breakdown maintenance environment, over-
time costs are a major, negative cost. If your maintenance department’s overtime
represents more than 10 percent of the total labor budget, you definitely qualify as a
breakdown operation. Some overtime is, and always will be, required. Special pro-
jects and the 1 percent of delays caused by machine failures will force some expen-
diture of overtime premiums, but these abnormal costs should be a small percentage
of the total labor costs.
Labor usage is another key to management effectiveness. Evaluate the percentage of
maintenance labor, compared to total available labor hours that are expended on the
actual repairs and maintenance prevention tasks. In reactive maintenance manage-
ment, the percentage will be less than 50 percent. A well-managed maintenance orga-
nization should maintain consistent labor usage above 90 percent. In other words, at
least 90 percent of the available maintenance labor hours should be effectively used
to improve the reliability of critical plant systems, not spent waiting for something to
break.
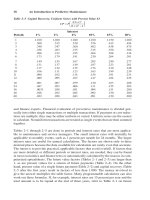
3.2.1 Three Types of Maintenance
There are three main types of maintenance and three major divisions of preventive
maintenance, as illustrated in Figure 3–1:
• Maintenance improvement
• Corrective maintenance
• Preventive maintenance
• Reactive
• Condition monitoring
• Scheduled
Maintenance Improvement
Picture these divisions as the five fingers on your hand. Maintenance improvement
efforts to reduce or eliminate the need for maintenance are like the thumb, the first
and most valuable digit. We are often so involved in maintaining that we forget to
plan and eliminate the need at its source. Reliability engineering efforts should empha-
size elimination of failures that require maintenance. This is an opportunity to pre-act
instead of react.
For example, many equipment failures occur at inboard bearings that are located in
dark, dirty, inaccessible locations. The oiler does not lubricate inaccessible bearings
as often as those that are easy to reach. This is a natural tendency, but the need for
Role of Maintenance Organization 45
lubrication could be reduced by using permanently lubricated, long-life bearings. If
that is not practical, at least an automatic oiler could be installed. A major selling point
of new automobiles is the elimination of ignition points that require replacement and
adjustment, introduction of self-adjusting brake shoes and clutches, and extension of
oil-change intervals.
Corrective Maintenance
The little finger in our analogy to a human hand represents corrective maintenance
(i.e., emergency, repair, remedial, unscheduled). At present, most maintenance is cor-
rective. Repairs will always be needed. Better maintenance improvement and pre-
ventive maintenance, however, can reduce the need for emergency corrections. A shaft
that is obviously broken into pieces is relatively easy to maintain because little human
decision is involved. Troubleshooting and diagnostic fault detection and isolation
are major time consumers in maintenance. When the problem is obvious, it can
usually be corrected easily. Intermittent failures and hidden defects are more time-
consuming, but with diagnostics, the causes can be isolated and then corrected.
From a preventive maintenance perspective, the problems and causes that result in
failures provide the targets for elimination by viable preventive maintenance. The
challenge is to detect incipient problems before they lead to total failures and to
correct the defects at the lowest possible cost. That leads us to the middle three
fingers—the branches of preventive maintenance.
Preventive Maintenance
As the name implies, preventive maintenance tasks are intended to prevent unsched-
uled downtime and premature equipment damage that would result in corrective or
46 An Introduction to Predictive Maintenance
MAINTENANCE
IMPROVEMENT
(MI)
PREVENTIVE
(PM)
CORRECTIVE
(CM)
Reliability-driven
Modification
Retrofit
Redesign
Change order
Equipment-driven
Self-scheduled
Machine-cued
Control limits
When deficient
As requred
Statistical analysis
Trends
Vibration monitoring
Tribology
Thermography
Ultrasonics
Other NDT
Periodic
Fixed intervals
Hard time limits
Specific time
Breakdowns
Emergency
Remedial
Repairs
Rebuilds
Predictive
Time-driven
Event-driven
Figure 3–1 Structure of maintenance.
repair activities. This maintenance management approach is predominantly a time-
driven schedule or recurring tasks, such as lubrication and adjustments that are
designed to maintain acceptable levels of reliability and availability.
Reactive. Reactive maintenance is done when equipment needs it. Inspection using
human senses or instrumentation is necessary, with thresholds established to indicate
when potential problems start. Human decisions are required to establish those
standards in advance so that inspection or automatic detection can determine when
the threshold limit has been exceeded. Obviously, a relatively slow deterioration
before failure is detectable by condition monitoring, whereas rapid, catastrophic
modes of failure may not be detected. Great advances in electronics and sensor tech-
nology are being made.
Also needed is a change in human thought process. Inspection and monitoring should
disassemble equipment only when a problem is detected. The following are general
rules for on-condition maintenance:
1. Inspect critical components.
2. Regard safety as paramount.
3. Repair defects.
4. If it works, don’t fix it.
Condition Monitoring. Statistics and probability theory are the basis for condition-
monitoring maintenance. Trend detection through data analysis often rewards the
analyst with insight into the causes of failure and preventive actions that will help
avoid future failures. For example, stadium lights burn out within a narrow period.
If 10 percent of the lights have burned out, it may be accurately assumed that the
rest will fail soon and should, most effectively, be replaced as a group rather than
individually.
Scheduled. Scheduled, fixed-interval preventive maintenance tasks should generally
be used only if failures that cannot be detected in advance can be reduced, or if
dictated by production requirements. The distinction should be drawn between
fixed-interval maintenance and fixed-interval inspection that may detect a threshold
condition and initiate condition-monitoring tasks. Examples of fixed-interval tasks
include 3,000-mile oil changes and 48,000-mile spark plug changes on a car, whether
it needs the changes or not. This may be wasteful because all equipment and their
operating environments are not alike. What is right for one situation may not be right
for another.
The five-finger approach to maintenance emphasizes elimination and reduction of
maintenance needs wherever possible, inspection and detection of pending failures
before they happen, repair of defects, monitoring of performance conditions and
failure causes, and accessing the equipment on a fixed-interval basis only if no better
means exist.
Role of Maintenance Organization 47
Advantages and Disadvantages
Overall, preventive maintenance has many advantages. It is beneficial, however, to
overview the advantages and disadvantages so that the positive may be increased
and the negative reduced. Note that in most cases the advantages and disadvantages
vary with the type of preventive maintenance tasks and techniques used. Use of on-
condition or condition-monitoring techniques is usually better than fixed intervals.
Advantages. There are distinct advantages to preventive maintenance management.
The predominant advantages include the following:
• Management control. Unlike repair maintenance, which must react to
failures, preventive maintenance can be planned. This means “pre-active”
instead of “reactive” management. Workloads may be scheduled so that
equipment is available for preventive activities at reasonable times.
• Overtime. Overtime can be reduced or eliminated. Surprises are reduced.
Work can be performed when convenient; however, proper distribution of
the time-driven preventive maintenance tasks is required to ensure that all
work is completed in a timely manner without excessive overtime.
• Parts inventories. Because the preventive maintenance approach permits
planning of which parts are going to be required and when, those material
requirements may be anticipated to be sure they are on hand for the event.
A smaller stock of parts is required in organizations that emphasize pre-
ventive tasks compared to the stocks necessary to cover breakdowns that
would occur when preventive maintenance is not emphasized.
• Standby equipment. With high demand for production and low equipment
availability, reserve, standby equipment is often required in case of break-
downs. Some backup may still be required with preventive maintenance, but
the need and investment will certainly be reduced.
• Safety and pollution. If no preventive inspections or built-in detection
devices are used, equipment can deteriorate to a point where it is unsafe or
may spew forth pollutants. Performance will generally follow a saw-tooth
pattern, as shown in Figure 3–2, which does well after maintenance and then
degrades until the failure is noticed and it is brought back up to a high level.
A good detection system catches degrading performance before it reaches
too low a level.
• Quality. For the same general reasons discussed previously, good preven-
tive maintenance helps ensure quality output. Tolerances are maintained
within control limits. Naturally, productivity is improved and the investment
in preventive maintenance pays off with increased revenues.
• Support to users. If properly publicized, preventive tasks help show equip-
ment operators, production managers, and other equipment users that the
maintenance function is striving to provide a high level of support. Note
here that an effective program must be published so that everyone involved
understands the value of performed tasks, the investment required, and their
own roles in the system.
48 An Introduction to Predictive Maintenance
• Cost–benefit relationship. Too often, organizations consider only costs
without recognizing the benefit and profits that are the real goal. Preventive
maintenance allows a three-way balance between corrective maintenance,
preventive maintenance, and production revenues.
Disadvantages. Despite all the good reasons for doing preventive maintenance,
several potential problems must be recognized and minimized:
• Potential damage. Every time a person touches a piece of equipment,
damage can occur through neglect, ignorance, abuse, or incorrect proce-
dures. Unfortunately, low-reliability people often service much high-
reliability equipment. The Challenger space shuttle failure, the Three Mile
Island nuclear power plant disaster, and many less-publicized accidents have
been affected by inept preventive maintenance. Most of us have experienced
car or home appliance problems that were caused by something that was
done or not done at a previous service call. This situation gives rise to the
slogan: “If it works, don’t fix it.”
• Infant mortality. New parts and consumables have a higher probability of
being defective or failing than exists with the materials that are already in
use. Replacement parts are too often not subjected to the same quality assur-
ance and reliability tests as parts that are put into new equipment.
• Parts use. Replacing parts at preplanned preventive maintenance intervals,
rather than waiting until a failure occurs, will obviously terminate that part’s
useful life before failure and therefore require more parts. This is part of the
trade-off among parts, labor, and downtime, of which the cost of parts will
usually be the smallest component. It must, however, be controlled.
• Initial costs. Given the time-value of money and inflation that causes a dollar
spent today to be worth more than a dollar spent or received tomorrow, it
should be recognized that the investment in preventive maintenance is made
earlier than when those costs would be incurred if equipment were run until
failure. Even though the cost will be incurred earlier—and may even be
larger than corrective maintenance costs would be—the benefits in terms of
equipment availability should be substantially greater from doing preven-
tive tasks.
• Access to equipment. One of the major challenges when production is at a
high rate is for maintenance to gain access to equipment in order to perform
Role of Maintenance Organization 49
Figure 3–2 Preventive maintenance to keep acceptable performance.
preventive maintenance tasks. This access will be required more often than
it is with breakdown-driven maintenance. A good program requires the
support of production, with immediate notification of any potential prob-
lems and willingness to coordinate equipment availability for inspections
and necessary tasks.
The reasons for and against doing preventive maintenance are summarized in the fol-
lowing list. The disadvantages are most pronounced with fixed-interval maintenance
tasks. Reactive and condition-monitoring tasks both emphasize the positive and reduce
the negatives.
Advantages
• Performed when convenient
• Increases equipment uptime
• Creates maximum production revenue
• Standardizes procedures, times, and costs
• Minimizes parts inventory
• Cuts overtime
• Balances workload
• Reduces need for standby equipment
• Improves safety and pollution control
• Facilitates packaging tasks and contracts
• Schedules resources on hand
• Stimulates pre-action instead of reaction
• Indicates support to user
• Assures consistent quality
• Promotes benefit/cost optimization
Disadvantages
• Exposes equipment to possible damage
• Failures in new parts
• Uses more parts
• Increases initial costs
• Requires more frequent access to equipment
3.3 D
ESIGNING A PREDICTIVE MAINTENANCE PROGRAM
An effective predictive maintenance program must include both condition-driven and
time-driven tasks. These tasks are determined by the specific equipment and systems
that constitute the plant. At a minimum, each plant should evalute:
• Failure data
• Improving equipment reliability
• Improvement process
50 An Introduction to Predictive Maintenance
• Failures that can be prevented
• Maintenance to prevent failures
• Personnel
• Service Teams
3.3.1 Failure Data
Valid failure data provide the intelligence for an effective preventive maintenance
program. After all, the objective is to prevent those failures from recurring. A
failure reporting system should identify the problem, cause, and corrective action
for every call. An action group, prophetically called the Failure Review and
Corrective Actions Task Force (FRACAS), can be effective for involving responsible
organizations in both detailed identification of problems and causes, and assignment
of both short- and long-term corrective action. The following are typical factory and
field problems and codes that shorten the computer data entry to four or fewer
characters:
NOOP Not Operable OTHR Other
BELR Below rate PM Preventive task
INTR Intermittent QUAL Quality
LEAK Leak SAFE Safety
MOD Modification WEAT Weather
NOIS Noise NPF No problem found
The following are typical cause codes:
1. Not applicable 60. Program
10. Controls 70. Materials
20. Power 71. Normal wear
21. External input power 72. Damaged
22. Main power supply 80. Operator
30. Motors 90. Environment
40. Drivers 99. No cause found
50. Transports PM. Preventive maintenance
The typical action codes are:
A/A Adjust/align REF Refurbish
CAL Calibrate REB Rebuild
CONS Consumables LUBE Lubricate
DIAG Diagnose MOD Modify
REMV Remove PM Preventive task
R/R Remove and replace RPR Repair
R/RE Remove and reinstall TRN Train
INST Install NC Not complete
INSP Inspect NK Not known
Role of Maintenance Organization 51
These parameters and their codes should be established to fit the needs of the specific
organization. For example, an organization with many pneumatic and optical instru-
ments would have sticky dials and dirty optics that would not concern an electroni-
cally oriented organization. Note also that the code letters are the same, whenever
possible, as the commonly used word’s first letters. Preventive maintenance activities
are recorded simply as PM/PM/PM. The cause codes, which may be more detailed,
can use numbers and subsets of major groups, such as all power will be 20s, with
external input power = 21, main power supply = 22, and so on.
It is possible, of course, to write out the complete words; however, analysis—whether
done by computer or manually—requires standard terms. Short letter and number
codes strike a balance that aids short reports and rapid data entry.
Use of the equipment at every failure should also be recorded. A key to condition-
monitoring preventive maintenance effectiveness is knowing how many hours, miles,
gallons, activations, or other kind of use have occurred before an item failed. This
requires hour meters and similar instrumentation on major equipment. Use on related
equipment may often be determined by its relationship to the parent. For example, it
may be determined that if a specific production line is operating for seven hours, then
the input feeder operates five hours (5/7), the mixer two hours (2/7), and the packag-
ing machine four hours (4/7).
It is also important to determine the valid relationship between the cause of the
problem and the recording measurement. For example, failures of an automotive
starter are directly related to the number of times the car engine is started and only
indirectly to odometer miles. If startup or a particular activity stresses the equipment
different from normal use, then those special activities should be recorded.
Figure 3–3 is a combination work order and completion form. This form is printed by
the computer on plain paper with the details of the work order on the top, space in the
center for labor and materials for work orders that take a day or less, and a completion
blank at the bottom to show when the work was started, when it was completed, the
problem/cause/action codes, and meter reading. Labor on work orders that take more
than one day is added daily from time reports and accumulated against the work order.
Figure 3–4 shows the computer input screen for a simple service call report form that
gathers the minimum information necessary for field reporting. Those forms may be
used as input for a computer system, when a direct-entry system is not available.
3.3.2 Improving Equipment Reliability
Total-plant performance management (TPPM) and similar quality programs promote
a holistic approach that includes equipment performance as a major enhancement to
productivity. To reinforce the five-fingered approach to effective maintenance outlined
previously, the fundamental thumb is elimination of failures. Uptime of equipment is
what counts. Maintainability and maintenance are most successful if we do not have
failures to fix.
52 An Introduction to Predictive Maintenance
Role of Maintenance Organization 53
Larry Smith
Charger Kit
A/C 544
PM-A Recharge Freon in A/C 44
Maint. Planning EXT. 356 5/30/00
44
23445
Jones, Joe
BENDIX AIR CONDITIONER
CPTR RM 16
PRD-PROD PERMT
100%123-555
1Freon, A/C Charge Kit603552
5/30/00
$12.75 $12.75
$12.75
CURR
METER
6/1/00
REQUESTED
BY:
ORDER#: 1926 PAD#: 45524
DEPARTMENT
TYPE:
WORK ORDER
DESCRIPTION EQUIPMENT
TELEPHONE# TGT START TGT COMPLETE
A
PRI: 9
ID:
ID:
NAME:
ACCOUNTING:
LABOR USED (ONLY FOR SINGLE-DAY JOBS)
PERSON OR EQUIPMENT
WORK TVL
TOTAL HOURS-MINUTES
DELAY OT $
NAME:
LOC:
PRECAUTIONS
ASSIGNED EMPLOYEE
SPECIAL EQUIPMENT
DATE:
DOC:
DATE:
PART#
DATE
STARTED:
COMPLETED:
SIGNATURE:
TIME
COMPLETION
MATERIAL POSTING
DESCRIPTION
QTY.
TOTAL MATERIAL COST:
CODES:
PBM:
CAU:
ACT:
DATE:
$ UNIT $ TOTAL
READ:
Figure 3–3 Combination work order and completion form.
Figure 3–4 Simple call report.
Successful maintenance organizations spend more time identifying trends and elimi-
nating problems than they spend fixing repetitive breakdowns. Computerized mainte-
nance management systems provide a tool to gather data and provide analysis that can
lead to improvement.
3.3.3 Improvement Process
Figure 3–5 diagrams a business improvement process. A maintenance organization
should start by measuring its own performance. For example, just a breakout of a
typical day in the life of a maintenance person is revealing. Many groups are cha-
grined to discover that maintenance staff actually works less than 30 percent of the
time. Benchmark comparisons with similar organizations provide a basis for analyz-
ing performance both on metrics and processes. The third step in goal setting is to
identify realistic ideal levels of performance. These goals should have the following
characteristics:
• Written
• Measurable
• Understandable
• Challenging
• Achievable
The goals will have firm times, dollars, percentages, and dates. Everyone who will be
challenged to meet the goals should be involved in their establishment. This may seem
like a bureaucratic, warm-fuzzy approach, but the time it takes to achieve buy-in is
earned back many times during accomplishment. Once the goals are set, any gaps
between where performance is now versus where it needs to be can be identified. Then
both short-term plans and long-term strategies can be implemented to reach the goals.
54 An Introduction to Predictive Maintenance
COMPARISON
CURRENT
IDEAL
VARIANCE
GOALS
SHORT-TERM
TACTICS
LONG-TERM
STRATEGIES
MEASURE
FEEDBACK
PROCESS &
IMPLEMENTATION
(How we get there)
(Benchmarking)
(Maintenance
Evaluation)
(Duty-Task Analysis)
(Gap Analysis)
(Where you want to be
and When)
(How we are doing)
(Correction as required)
Figure 3–5 Business improvement process.
Frequent measurement and feedback will revise performance to achieve the desired
levels.
3.3.4 Failures That Can Be Prevented
Failure modes, effects, and criticality analysis (FMECA) provide a method for deter-
mining which failures can be prevented. Necessary inputs are the frequency of occur-
rence for each problem and cause combination and what happens if a failure occurs.
Criticality of the failure is considered for establishing priority of effort. FMECA is a
bottom-up approach that looks at every component in the equipment and asks: “Will
it fail? And if so, how and why?” Preventive maintenance investigators are interested
in how a component will fail so that the mechanism for failure can be reduced or
eliminated. For example, heat is the most common cause of failure for electro-
mechanical components. Friction causes heat in assemblies moving relative to each
other, often accompanied by material wear, and leads to many failures. Any moving
component is likely to fail at a relatively high rate and is a fine candidate for preven-
tive maintenance. The following are common causes of failure:
Abrasion Friction
Abuse Operator negligence
Age deterioration Puncture
Bond separation Shock
Consumable depletion Stress
Contamination Temperature extremes
Corrosion Vibration
Dirt Wear
Fatigue
3.3.5 Maintenance to Prevent Failures
Cleanliness is the watchword of preventive maintenance. Metal filings, fluids in the
wrong places, ozone and other gases that deteriorate rubber components—all are
capable of damaging equipment and causing it to fail. A machine shop, for example,
that contains many electromechanical lathes, mills, grinders, and boring machines
should have established procedures for ensuring that the equipment is frequently
cleaned and properly lubricated. In most plants, the best tactic is to assign respon-
sibility for cleaning and lubrication to the machine’s operator. There should be proper
lubricants in grease guns and oilcans, and cleaning materials at every workstation.
Every operator should be trained on proper operator preventive tasks. A checklist
should be kept on the equipment for the operator to initial every time the lubrication
is done.
It is especially important that lubrication be done cleanly. Grease fittings, for example,
should be cleaned with waste material both before and after the grease gun is used.
Grease attracts and holds particles of dirt. If the fittings are not clean, the grease gun
could force contaminants between the moving parts, which is precisely what should
Role of Maintenance Organization 55
be avoided. This is one example of how preventive maintenance done poorly can be
worse than no maintenance at all.
3.3.6 Personnel
Another tactic for ensuring thorough lubrication is to have an oiler who can do all of
the lubrication at the beginning of each shift. This may be better than having the
operators do lubrication if the task is complicated or if the operators are not suffi-
ciently skilled.
Whether operators will do their own equipment lubrication, rather than an oiler, is
determined by the following criteria:
• The complexity of the task
• The motivation and ability of the operator
• The extent of pending failures that might be detected by the oiler but over-
looked by operators
If operators can properly do the lubrication, then it should be made a part of their total
responsibility, just as car drivers ensure that they have adequate gasoline in their vehi-
cles. It is best if the operators are capable of doing their own preventive maintenance.
Like many tasks, preventive maintenance should be delegated to the lowest possible
level consistent with adequate knowledge and ability. If, however, operators may cause
damage through negligence, willful neglect, or lack of ability, then a maintenance spe-
cialist should do lubrication. The tasks should be clearly defined. Operators may be
able to do some items, whereas maintenance personnel will be required for others.
Examples of how the work can be parceled out will be described later.
Preventive tasks are often assigned to the newest maintenance trainee. In most cases,
management is just asking for trouble if maintenance is regarded as low-status, unde-
sirable work. If management believes in preventive maintenance, they should assign
well-qualified personnel. Education and experience make a big difference in mainte-
nance. Most organizations have at least one skilled maintenance person who can step
onto the factory floor and sense—through sight, sound, smell, vibration, and tempera-
ture—the conditions in the factory. This person can tell in an instant that “The feeder
on number 2 is hanging up a little this morning, so we’d better look at it.” This person
should be encouraged to take a walk around the factory floor at the beginning of every
shift to sense what is going on and inspect any questionable events. The human senses
of an experienced person are the best detection systems available today.
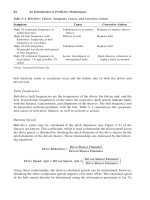
3.3.7 Service Teams
A concept that is successfully applied in both factory and field service organizations
is teams of three or four persons. This type of organization can be especially effec-
tive if equipment must have high uptime but requires lengthy maintenance time at
56 An Introduction to Predictive Maintenance
failures or preventive maintenance activities. If individual technicians were assigned
to specific equipment, the person might well be busy on a lengthy project when a call
comes to fix another machine. In an individual situation where a single person is
responsible for specific machines, either the down machine would have to wait until
the technician completes the first job and gets to the second or if the second machine
has greater priority, the first machine may be left inoperable. The technician then inter-
rupts his or her task to take care of the second problem and must return later to com-
plete the first, thus wasting time and effort. The optimum number of people can be
calculated for any scenario, time, and effort. Figure 3–6 illustrates one situation in
which two was the best team size.
A good technique for teamwork is to rotate the preventive maintenance responsibil-
ity. The first week, Adam performs all the required tasks, while Brad, Chuck, and
Donna make modifications and repairs. It may also help to assign Brad the short “do-
it-now” (DIN) tasks for the same week. The next week, Brad does preventive, and
Donna handles DIN, while Chuck and Adam attend to emergencies. Rotating pre-
ventive maintenance tasks has the following advantages:
• Responsibility is shared equally by all.
• Doing a good preventive job one week should reduce the breakdown emer-
gency repairs in following weeks; thus a technician can benefit from the
results of his or her own preventive efforts.
• Technicians’ skills and interests vary, so that what one person fails to notice
during his or her week will probably be picked up by another person the
next week.
The time to start is now. Don’t let any more failures occur or information be lost.
There is probably a lot of effort ahead, so get started implementing your program now.
Role of Maintenance Organization 57
70
60
50
40
30
20
10
0
1234567
Number of Technicians
Total Cost ($000)
Figure 3–6 Total maintenance costs for varied number of technicans.
3.3.8 How to Start
The necessary items for establishing an effective preventive maintenance program are
as follows:
• Every piece of equipment uniquely identified by prominent ID number or
serial number and product type
58 An Introduction to Predictive Maintenance
Yes No Comments
1. Standardization
a. Is equipment already in use that provides the desired function?
b. Is this the same as existing equipment?
c. Are there problems with existing equipment?
d. Can we maintain this equipment with existing personnel?
e. Are maintenance requirements compatible with our current procedures?
2. Reliability and Maintainability
a. Can vendor prove the equipment will operate at least to our specifications?
b. Warranty of all parts and labor for 90+ days?
c. Is design fault-tolerant?
d. Are tests go/no go?
3. Service Parts
a. Is recommended replacement list provided?
b. Is the dollar total of spares less than 10% of equipment cost?
c. Do we already have usable parts?
d. Can parts be purchased from other vendors?
e. Are any especially high quality or expensive parts required?
4. Training
a. Is special technician training required?
b. Will manufacturer provide training?
1. At no additional cost for first year?
2. At our location as required?
Yes No Comment
s
5. Documentation
a. All technical manuals provided?
1. Installation
2. Operation
3. Corrective and preventive maintenance
4. Parts
6. Special Tools and Test Equipment
a. Do we already have all required tools and test equipment?
b. Can at least 95% of all faults be detected by use of proposed equipment?
c. Are calibration procedures minimum and clear?
7. Safety
a. Are all UL/SCA, OSHA, EPA and other applicable requirements met?
b. Are any special precautions required?
c. Can one person do all maintenance?
Figure 3–7 Maintenance considerations checklist for purchasing agents and facilities
engineers.
• Accurate equipment history records
• Failure information by problem, cause, and action
• Experience data from similar equipment
• Manufacturer’s interval and procedure recommendations
• Service manuals
• Consumables and replaceable parts
• Skilled personnel
• Proper test instruments and tools
• Clear instructions with a checklist to be signed off
• User cooperation
• Management support
A typical initial challenge is to get proper documentation for all equipment. When a
new building or plant is constructed, the architects and construction engineers should
be required to provide complete documentation on all facilities and the equipment
installed in them. Any major equipment that is installed after that should have com-
plete documentation. Figure 3–7 is a checklist that should be given to anyone who
purchases facilities and equipment that must be maintained. One of the items on this
list is ensuring availability of complete documentation and preventive maintenance
recommendations.
Purchasing agents and facilities engineers are usually pleased to have such a check-
list and will be cooperative if reminded occasionally about their major influence on
life-cycle costs. This brings us back again to the principle of avoiding or minimizing
the need for maintenance. Buying the right equipment in the beginning is the way to
start. The best maintainability is eliminating the need for maintenance.
If you are in the captive service business or concerned with designing equipment that
can be well maintained, you should recognize that the preceding recommendation was
aimed more at factory maintenance; but after all, that is an environment in which your
equipment will often be used. It helps to view the program from the operator and
serviceperson’s eyes to ensure that everyone’s needs are satisfied.
Role of Maintenance Organization 59
Predictive maintenance is not a substitute for the more traditional maintenance
management methods. It is, however, a valuable addition to a comprehensive, total-
plant maintenance program. Where traditional maintenance management programs
rely on routine servicing of all machinery and fast response to unexpected failures, a
predictive maintenance program schedules specific maintenance tasks as they are
actually required by plant equipment. It cannot eliminate the continued need for
either or both of the traditional maintenance programs (i.e., run-to-failure and pre-
ventive). Predictive maintenance can, however, reduce the number of unexpected
failures and provide a more reliable scheduling tool for routine preventive mainte-
nance tasks.
The premise of predictive maintenance is that regular monitoring of the actual
mechanical condition of machine-trains and operating efficiency of process systems
will ensure the maximum interval between repairs; minimize the number and cost of
unscheduled outages created by machine-train failures; and improve the overall avail-
ability of operating plants. Including predictive maintenance in a total-plant manage-
ment program will optimize the availability of process machinery and greatly reduce
the cost of maintenance. In reality, predictive maintenance is a condition-driven pre-
ventive maintenance program.
The benefits that are derived from using predictive maintenance technologies depend
on the way the program is implemented. If the predictive maintenance program is
limited to preventing catastrophic failures of select plant systems, then that is the result
that will be derived; however, exclusive focus on preventing failures may result in a
substantial increase in maintenance costs. For example, a large integrated steel mill
was able to reduce unscheduled machine failures by more than 30 percent, but a review
of maintenance costs disclosed a 60 percent increase.
4
BENEFITS OF PREDICTIVE
MAINTENANCE
60
4.1 PRIMARY USES OF PREDICTIVE MAINTENANCE
When used properly, predictive maintenance can provide almost unlimited benefits;
however, when the scope of the program is artificially limited by the scope or work
or restrictions imposed by the plant, the benefits may be substantially reduced. Typi-
cally, predictive maintenance is implemented for one of the following reasons:
• As a maintenance management tool
• As a plant optimization tool
• As a reliability improvement tool
4.1.1 As a Maintenance Management Tool
Traditionally, predictive maintenance is used solely as a maintenance management
tool. In most cases, this use is limited to preventing unscheduled downtime and/or
catastrophic failures. Although this goal is important, predictive maintenance can pro-
vide substantially more benefits by expanding the scope or mission of the program.
As a maintenance management tool, predictive maintenance can and should be used
as a maintenance optimization tool. The program’s focus should be on eliminating
unnecessary downtime, both scheduled and unscheduled; eliminating unnecessary
preventive and corrective maintenance tasks; extending the useful life of critical
systems; and reducing the total life-cycle cost of these systems.
Benefits Derived from Maintenance-Only Use
A survey of 1,500 plants that had implemented predictive maintenance programs
solely as a maintenance management tool indicated a substantial reduction in poten-
tial benefits. Results of the survey disclosed that 85.9 percent of the plants are
currently using one or more of the traditional predictive maintenance technologies as
an active part of their maintenance management activities and that the remaining 14.1
percent planned to start a program within the next three years. Five years ago, the
reverse was true, with only 15 percent of surveyed plants using these technologies.
One can conclude from this statistic that most plants have recognized the potential of
predictive maintenance and have made an attempt to incorporate it into their main-
tenance management program.
Reasons for Implementation
The reason that plants implement predictive maintenance programs is also changing.
In earlier surveys, the dominant reasons for which predictive maintenance was imple-
mented focused on traditional maintenance issues, such as lower maintenance costs
and reductions in unscheduled downtime caused by catastrophic machine failure.
Although the companies polled in our May 2000 survey continue to cite these two
factors as primary considerations, several nonmaintenance reasons have been added.
Product Quality. Almost 77 percent (76.7%) of the respondents cited improved
product quality as a dominant reason their program was implemented. A few years
Benefits of Predictive Maintenance 61
ago, few plants recognized the ability of predictive technology to detect and correct
product-quality problems.
Asset Protection. More than 60 percent (60.8%) of those interviewed included asset
protection as the reason for implementation. Although asset management and protec-
tion is partially a maintenance issue, its inclusion as justification for a predictive main-
tenance program is a radical change from just a few years ago.
ISO Certification. Almost 36 percent (35.8%) included ISO certification as a reason
for implementing predictive maintenance. The primary focus of ISO 9000 is pro-
duct quality. As a result, the certification process includes criteria that seek to ensure
equipment reliability and consistent production of first-quality products. Predictive
maintenance helps maintain consistent quality performance levels of critical plant
production systems. Although ISO certification does not include specific requirements
for predictive maintenance, its inclusion in the plant program will greatly improve the
probability of certification and will ensure long-term compliance with ISO program
requirements.
Management Directive. Almost one-third (30.7 percent) of respondents stated that the
primary reason for implementation was top management directives. More senior-level
managers have recognized the absolute need for a tool to improve the overall reli-
ability of critical plant systems. Many recognize the ability of predictive maintenance
technologies as this critical management tool.
Lower Insurance Rates. Insurance considerations were cited by 25 percent of those
interviewed. Most plants have insurance policies that protect them against interrup-
tions in production. These policies are primarily intended to protect the plant against
losses caused by fire, flood, breakdowns, or other prolonged interruptions in the plant’s
ability to operate. Over the past 10 years, insurance companies have begun to recog-
nize the ability of predictive maintenance technology to reduce the frequency and
severity of machine- and process-related production interruptions. As a result, the
more progressive insurance companies now offer a substantially lower premium for
production interruption insurance to plants that have a viable predictive maintenance
program.
Predictive Maintenance Costs
The average maintenance budget of the plants interviewed was $12,053,000, but
included those with budgets ranging from less than $100,000 to more than $100
million. The average plant invests 15.8 percent of its annual maintenance budget in
predictive maintenance programs, but one-third (33%) of the plants interviewed in our
May 2000 survey allocate less than 10 percent to predictive maintenance.
According to the survey, the average cost of a predictive maintenance program is $1.9
million annually. This cost includes procuring instrumentation but consists primarily
of the recurring labor cost required to sustain these programs. The burdened cost—
62 An Introduction to Predictive Maintenance