Báo cáo lâm nghiệp: "The allometric model in the stand density management of Pinus pinaster Ait. in Portugal" ppsx
Bạn đang xem bản rút gọn của tài liệu. Xem và tải ngay bản đầy đủ của tài liệu tại đây (268.75 KB, 8 trang )
807
Ann. For. Sci. 61 (2004) 807–814
© INRA, EDP Sciences, 2005
DOI: 10.1051/forest:2004077
Original article
The allometric model in the stand density management
of Pinus pinaster Ait. in Portugal
Jaime F. SALES LUIS*, Teresa F. FONSECA
Departamento Florestal, Universidade de Trás-os-Montes e Alto Douro, 5000 Vila Real, Portugal
(Received 16 July 2003; accepted 17 June 2004)
Abstract – The allometric model is very suitable for practical applications, as it gives an approximately correct expression of a number of
relations, such as plant density (N) and average plant size (dg), very useful in forest management. Density management diagrams, based on the
allometric model, are simple and effective procedures to display the complex dimensional stand development relationships and to translate
general management objectives into stand-specific thinning prescriptions. This study presents a comprehensive approach, based on the
allometric model, to manage the development of Pinus pinaster even-aged stands in Portugal, using National Forest Inventory data of 1998.
The self-thinning allometric model is a linear limiting relationship, between N and dg. It requires upper boundary plot selection and corresponds
to the use of the upper confidence interval limit for the intercept coefficient (13.634), with a slope coefficient of –1.897. The upper and lower
limits for the optimum growth-density interval also requires attention. In this study, trees square spacing and a 10 cm reference diameter were
selected to calculate limits that are, respectively, 63% and 32%. Two associated relationships (dominant height and total volume isolines) were
developed to allow evaluation of thinning regimes in terms of age, height and volume. Three alternative management regimes (unthinned,
commercial and precommercial), aiming a 30 cm target diameter, were discussed and compared. Mortality was only predicted in the unthinned
regime, accounting for 46% total yield loss. The 30 cm target diameter was reached considerably earlier in the precommercial (38 years) and
commercial (45 years) regimes, compared with the unthinned regime (54 years), but at the expense of a much lower residual trees·ha
–1
350,
544 and 789, yielding a total volume of 278, 600 and 992 m
3
·ha
–1
and corresponding to 7.3, 13.3 and 18.4 m
3
·ha
–1
·yr
–1
MAI, respectively.
Pinus pinaster / allometric model / stand density management
Résumé – Modèle allométrique pour la gestion de la densité des peuplements de Pinus pinaster Ait., au Portugal. Le modèle allométrique
est très convenable pour des applications pratiques, car il donne une expression quasiment correcte d’un nombre de relations, tels que la densité
des plants (N) et la dimension moyenne des plants (dg), très utiles dans l’aménagement forestier. Les diagrammes de gestion de la densité sont
une procédure simple et efficace pour présenter les relations dimensionnelles complexes du développement des peuplements et de traduire les
objectifs généraux de gestion dans des règles d’éclaircies spécifiques au peuplement. Cette étude présente une approche globale, basée sur un
modèle allométrique, pour la gestion des peuplements réguliers de Pinus pinaster au Portugal, utilisant les données de l’Inventaire Forestier
National de 1998. Le modèle allométrique d’auto-régulation est une relation linéaire limite, entre N et dg. Son calcul demande la sélection des
données de la limite supérieure et correspond à l’usage de la limite supérieure de l’intervalle de confiance pour le coefficient d’interception de
l’espèce (13,634), avec un coefficient de pente de –1,897. Les limites supérieure et inférieure de l’intervalle optimal de croissance-densité
demandent aussi une attention particulière. Dans cette étude l’espacement carré et le diamètre de référence de 10 cm ont été sélectionnés pour
le calcul de ces limites, respectivement, 63 % et 32 %. Deux relations associées (isolignes hauteur dominante et volume) sont développées pour
permettre une évaluation précise des régimes d’éclaircie concernant l’âge, la hauteur et le volume. Trois différents régimes de sylviculture (sans
éclaircies, éclaircies commerciales et précommerciales), visant un diamètre objectif de 30 cm, sont discutés et comparés. La mortalité est
seulement observée dans le régime sans éclaircies, occasionnant une perte totale de production de 46 %. Le diamètre objectif de 30 cm est
obtenu relativement tôt dans les régimes d’éclaircies précommerciales (38 années) et commerciales (45 années), comparés avec le régime sans
éclaircies (54 années) mais aux dépens d’un nombre d’arbres à l’ha résiduels plus réduit, respectivement 350, 544 et 789, produisant un volume
total de 278, 600 et 992 m
3
·ha
–1
et correspondant à 7,3, 13,3 et 18,4 m
3
·ha
–1
·yr
–1
du AMA respectivement.
Pinus pinaster / modèle allométrique / gestion de la densité des peuplements
1. INTRODUCTION
Most animal and vegetal living matter exists in the form of
discrete individuals for which general description depends on
two fundamental entities: their number per unit area and their
mass. Each of these entities belongs to one of the main branches
of ecology, respectively, population ecology and production
ecology [14]. The relationship between these variables linking
together the two branches, belongs to neither of them; it con-
stitutes the core of ecology [43].
* Corresponding author:
808 J.F.S. Luis, T.F. Fonseca
It is widely accepted [2, 14, 16, 20, 34, 37–39] that in the
evolution of monospecific even-aged populations of plants
experiencing complete crown closure, mortality is density-
dependent and is ruled by “the 3/2 power law of self-thinning”
formulated by Yoda et al. [43]. The law, also known as self-
thinning rule, is described [4] by the allometric model between
plant density (N) and average plant size (dg):
(dN / dt) / N = b (ddg / dt) / dg (1)
in which the relative rate of N growth is reciprocal to the relative
rate of dg growth. Integrating both sides yielded:
N = a dg
b
.(2)
The allometric model is very suitable for practical applica-
tions, as it gives an approximately correct expression of a
number of relations [32]. For example, Reineke [33] derived
the following model for different species growing in the United
States west coast conditions:
log N = a – 1.605 log dg. (3)
Oliveira [28], Gadow [15], McCarter and Long [23], Luis
et al. [22], Dean and Baldwin [5], Kumar et al. [18] and Cao
et al. [3], among others, have used this model for species grow-
ing in different environmental conditions and other slopes were
found. Tolerant species tend to show a lower slope [44] and a
higher intercept [14]. Wilson [40] and Drew and Flewelling
[11] further developed this model, expressing the size variable
by the top height and individual tree volume, respectively.
Stand development is a dynamic process in which growth,
mortality and harvesting play an important role. Density man-
agement diagrams are a simple and effective means to display
the complex dimensional stand development relationships and
to translate general management objectives into stand-specific
thinning prescriptions [27]. Their wide application is as a result
of their utility in designing alternative management regimes, in
displaying the results of stand density manipulation, and in
translating general management objectives into practical thin-
ning regimes [21].
For the genus Pinus, more than for any other genus, self-thin-
ning allometric modelling [1, 3, 15, 28, 29, 33, 38, 42] and stand
density diagrams [5, 6, 10, 12, 22, 23, 41] have been developed.
Luis et al. [22] presented a preliminary study about the allo-
metric model application for Pinus pinaster stands management
in Portugal. In this paper, a comprehensive density manage-
ment diagram is developed, using updated information, and its
use is illustrated by examining three possible management
regimes.
2. MATERIALS AND METHODS
2.1. Data base
In 1998, during the Portuguese National Forest Inventory, 501 cir-
cular sample plots were measured in pure Pinus pinaster stands [8].
These 500 m
2
inventory plots were systematically scattered over the
country (36° 57” to 42° 06” N and 6° 14” to 9° 32” W) and different
measurements (tree diameter at breast height (dbh), sample tree height
(h) and, dominant and dominated trees age) were made. The data file
for the sample plots contains the following stand variables: age (t);
number of trees per ha (N), basal area per ha (G) and over bark total
volume per ha (V); dominant diameter (dd) and dominant height (hd).
Quadratic mean diameter (dg) was computed from N and G.
From all the plots, 227 were discarded due to: lack of information
related to dominant trees (54); indirect stand recovery (16); uneven-
aged stands (144), extreme low density (3) and inadequate measure-
ments (9). The remaining 274 inventory plots were considered acceptable
for use (Tab. I). From these, 25 upper boundary plots were identified,
according to Keeney and Raiffa’s [17] boundary point definition,
based on the simplified dominance concept. This concept states that
z’ is a boundary point in relation to z”, when the following conditions
are simultaneously verified:
z’
i
≥ z”
i
for all i variables (4)
z’
i
> z”
i
a t l e a s t f o r o n e i variable (5)
where i is N and/or dg.
The 25 upper boundary plots were used for developing the self-
thinning line. For the development of the associated relationships in
the stand density diagram (V and hd isolines) all 274 acceptable inven-
tory plots were used.
2.2. Model development
Density-dependent mortality is caused by an increase in tree size.
Crown width is the best predictor of tree number in closed stands,
although it cannot be reliably measured due to irregular crown form
and overlap. Therefore, it is natural to use N as the dependent variable
and dg as the independent variable, since it adequately expresses tree
size, it is closely related to the number of trees and crown width and
is also easily accessible for measuring [44].
The exponential allometric model (Eq. (2)) can be easily linearized,
using a logarithmic transformation:
ln N = a + b ln dg. (6)
This model is an average limiting relationship between plant den-
sity and average plant size. Hence, after fitting, it should be moved up
vertically to represent a real limiting line.
The stand density diagram is a density (N) size (dg) relationship,
but other scales are possible, available and useful, such as, the V and
hd isolines. The development of these associated relationships in the
stand density diagram are based on empirical models [5, 18], perhaps
including explicitly the fundamental relationships of forest production.
Table I. Summary characteristics of the 274 inventory plots, used in
this study.
Stand
parameters
Minimum Mean Maximum Standard
deviation
t (years) 7.0 38.0 80.0 17.0
hd (m) 3.2 14.6 29.8 6.2
dg (cm) 3.3 19.7 51.0 9.6
N (trees·ha
–1
) 60.0 913.0 8480.0 1172.0
G (m
2
·ha
–1
) 0.3 17.0 52.9 12.0
V (m
3
·ha
–1
) 0.9 126.9 489.7 112.5
Management of Pinus pinaster in Portugal 809
Dean and Baldwin [5], following McCarter and Long [23]
approach, developed the models:
(7)
. (8)
Combining equations (7) and (8), by the V term and after algebraic
manipulation yielded:
hd = c
1
dg
c2
N
c3
.(9)
Kumar et al.’s [18] diagram isolines were obtained independently
and rely on different conceptual models:
(10)
. (11)
Equations (7), (8), (10) and (11) were fitted and residual analysis
was conducted to examine the model appropriateness. Model selection
was based on the coefficient of determination (r
2
) and on the standard
residual deviation (s
yx
) criteria.
3. RESULTS
3.1. Diagram construction
Stand density diagram construction is a two step process.
First, derive the self-thinning line and second, determine the
limits for the optimum growth-density interval [19, 24] and for
the crown closure line.
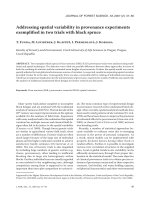
The application of the linearized allometric model (Eq. (6))
to the 25 boundary plots provided:
ln N = 13.052 – 1.897 ln dg (12)
with a r
2
of 0.897 and a s
yx
of 0.340.
Equation (12) is an average relationship between plant den-
sity and average plant size. Fixing the upper limit for the inter-
cept confidence interval at the 95% one tail level [α = 0.05;
t(1–α, n–2 df)], we then obtained the limiting relationship
between these variables or the self-thinning line we were look-
ing for (Fig. 1):
ln N = 13.634 – 1.897 ln dg. (13)
The objectives for setting the upper and lower limits for the
optimum growth-density interval are, respectively, avoiding
density-related mortality and keeping the live-crown ratio above
40%, the recommended minimum for good tree vigor [35],
while maintaining adequate site occupancy [11]. These two
limits for the optimum growth-density interval, along with the
crown closure line, form three lower lines parallel to the self-
thinning line.
In this study, square spacing of the trees was assumed and
10 cm was selected as the reference dbh to compute the number
of trees at different levels (Tab. II). The reference dbh approx-
imates the lower dbh class in our data base and corresponds to
the size for the first thinning operation in Pinus pinaster. Based
on our experience with the species, at the reference dbh, the
spacings 1.5 × 1.0, 2.0 × 1.5 and 2.0 × 2.0 m approximate,
respectively, the upper (6666) and lower (3333) limits for the
optimum growth-density zone and to the crown closure (2500)
situation (Tab. II). They are, respectively, 63.05, 31.53 and
23.64% of the N maximum. Under these circumstances, we
hypothesize that 60 and 35% are adequate values for the upper
and lower limits of the optimum growth-density interval and
25% is the reasonable value for the crown closure situation, for
Pinus pinaster in the Portuguese environment (Fig. 2). The
equations for the three lower parallel lines are, respectively, the
following:
ln N = 13.123 – 1.897 ln dg (14)
ln N = 12.584 – 1.897 ln dg (15)
ln N = 12.248 – 1.897 ln dg. (16)
Va
1
dg
a
2
Nhd
a
3
=
dg b
1
V
b
2
N
b
3
=
Va
1
a
2
N dg
a
3
+=
dg b
1
b
2
b
3
N
b
4
+()hd
b
5
+=
Figure 1. Plant density (N) and average plant size (dg) relationships. ∆ boundary plots, - - - average line, self-thinning line.
810 J.F.S. Luis, T.F. Fonseca
In developing the associated relationships for the stand den-
sity diagram, the models of Dean and Baldwin [5] and Kumar
et al. [18] were tested. Kumar et al.’s [18] models present some
pitfalls in the independent variables selection (Eq. (10)) and,
according to Décourt [7], in the model development assump-
tions (Eq. (11)), leading respectively, to improper model
behavior and/or biased model results. The different models fit-
ting and adjustment criteria, on the 274 inventory plots, led to
the selection Dean and Baldwin’s [5] models:
(17)
dg = 45.851 V
0.365
N
–0.407
. (18)
Equation (17), relating dg, N and hd with V, explained 99.8%
of the variation of the observed volume with a s
yx
of 4.99 m
3
·ha
–1
.
Equation (18), relating V and N with dg, explained 99.1% of
the total variation of dg with a s
yx
of 0.89 cm. Residual analysis
Table II. N (trees·ha
–1
) for different spacings.
Spacing (m, %)
dbh Maximum
1
1.5 × 1.0 2.0 × 1.5 2.0 × 2.0
(cm) (100) (63) (32) (24)
10 10572 6666 3333 2500
15 4899 3089 1545 1159
20 2839 1790 895 671
25 1859 1172 586 440
30 1315 829 415 311
35 982 619 310 232
40 762 481 240 180
45 610 384 192 144
50 499 315 157 118
1
Computed by equation (13).
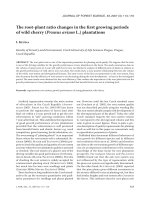
Figure 2. Comprehensive stand density diagram for Pinus pinaster in Portugal. - - - hd isolines,
__ . __
V isolines, density lines.
V 0.063dg
2.096
N
1000
0.978
hd
0.668
=
Management of Pinus pinaster in Portugal 811
did not show any apparent trend and all the models coefficients
were significant.
Solving equation (18) for the V term, substituting it into
equation (17) and solving for hd yielded:
hd = 0.236 dg
0.962
N
0.207
. (19)
Equations (17) and (19) enable drawing the V and hd iso-
lines, respectively, onto the stand density diagram for Pinus
pinaster in Portugal (Fig. 2). V was set at 5 levels: 50, 150, 300,
450 and 600 m
3
·ha
–1
and hd was also set at 5 levels: 10, 15, 20,
25 and 30 m.
The approximate stand age can be obtained from site index
curves, as long as site index (SI) information is available. Using
a Pinus pinaster site index model [8], for an index age of
50 years and solving for t, yielded:
(20)
4. DISCUSSION
4.1. Management applications
Oliveira [28], Hall and Martins [13], Moreira and Fonseca
[25] and Páscoa [30] developed growth and yield models for
Pinus pinaster in Portugal. The first three are average tree mod-
els and the fourth is a diameter distribution model [31], using
the Weibull probability density function.
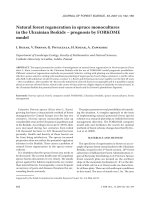
Figure 3 shows the main stand evolution for better (+) and
poorer (o) sites from the first two models. These trends follow
closely the interval between the 35% and 25% lines (i.e., the
lower limit line for the optimum growth-density zone and the
crown closure line), suggesting that the proposed diagram
mimics quite well the main silvicultural systems for the species
in Portugal.
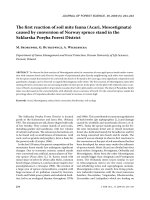
Scheduling of management regimes is the most important
use for the diagram. Three alternatives are discussed: (a) an
unthinned regime, (b) a commercial thinning regime, (c) a
precommercial thinning regime (Fig. 4). The first regime cor-
responds to the research control treatment and is practiced by
the absentee landowners, yielding high mortality and low tim-
ber value. The second regime is focused on maximizing the
stand volume or the tree volume. The third regime is an unusual
and extreme situation, but presented in this study mostly for
comparison purposes.
Let us consider, for example, an initial stand, in a 24 m site
quality class, at an index age of 50 years, with 10 cm for dg and
2500 for N and, for the different management alternatives, a tar-
get dg of 30 cm. Estimates of growth and age can be included
in the analysis [23], using the diagram hd and V lines, and site
index curves, respectively.
In the unthinned alternative (Fig. 4, a), dg increases with
almost no reduction in N, until the stands reaches the self-thin-
ning zone (the 60% line). Further increase in size occurs with
decrease in N and the stand path equilibrium follows the 60%
line (Fig. 4). Mortality starts around 29 years, at an estimated
dg of 16.3 cm and an estimated hd of 17.5 m, involving
1771 trees·ha
–1
and yielding 456 m
3
·ha
–1
. When dg reaches the
target value (30 cm) the hd estimate is 24.7 m, the final harvest
age is 54 years with a MAI of 18.4 m
3
·ha
–1
·yr
–1
(Tab. III).
In the commercial thinning alternative (Fig. 4, b), the stand
path (before and after thinnings) should be between the 60%
t
9.235
0.185 log
10
SI / hd()+
.
=
Figure 3. Yield models evolution in the stand density diagram. + better sites, o poorer sites.
812 J.F.S. Luis, T.F. Fonseca
Figure 4. Alternative density management regimes. a, unthinned; b, commercial; c, precommercial.
Table III. Comparison of three alternative management regimes. Mean Annual Increment (m
3
·ha
–1
·yr
–1
) is based on age at final harvest and
includes yields from mortality, precommercial thinning (PCT), commercial thinnings (CT) and final harvest.
thd N (trees·ha
–1
) dg (cm)V
(years) (m) before after before after (m
3
·ha
–1
)
Unthinned
Mortality 29 17.5 2500 789 16.3 30.0 456
Final harvest 54 24.7 789 30.0 536
Total yield 992
MAI 18.4
Commercial
CT 1 27 16.7 2500 1 166 15.6 18.4 108
CT 2 38 21.0 1166 544 23.3 27.5 138
Final harvest 45 22.9 544 30.0 354
Total yield 600
MAI 13.3
Precommercial
CT 18 10.9 2500 350 10.0 15.3 62
Final harvest 38 20.9 350 30.0 216
Total yield 278
MAI 7.3
Management of Pinus pinaster in Portugal 813
and 35% lines. Although mortality may occur after stand estab-
lishment and before its entry in the eminent competition mor-
tality zone (above the 60% line) and is, mostly, density inde-
pendent and difficult to predict [10], the probability of
occurrence strongly increases in the 60% line neighborhood.
We therefore consider the simplifying assumption that no nat-
ural mortality occurs below the 55% line.
Keeping the stand path in the 35 to 55% interval means that
the site is fully used and the self-thinning is probably avoided.
Total stand volume harvested is maximized, although tree
growth is not at its maximum [36], because it is balanced by
the high number of residual trees. In this study, the thinning
type is from below and to account for the dg increase with this
thinning type, these segments are drawn parallel with the near-
est hd line, on the assumption that this thinning type has no
effect on the hd growth [5]. When dg reaches the target value
(30 cm) the hd estimate is 22.9 m, the final harvest age is
45 years and the MAI is 13.3 m
3
·ha
–1
·yr
–1
(Tab. III).
In the precommercial thinning alternative (Fig. 4, c), a single
heavy precommercial thinning is used to set up the final N har-
vest at 350, cutting 2150 trees·ha
–1
. The dg after thinning is
15.3 cm and when it reaches the target value (30 cm) the hd esti-
mate is 20.9 m, the final harvest age is 38 years and the MAI
is 7.3 m
3
·ha
–1
·yr
–1
(Tab. III).
Mortality is observed only in the unthinned regime, corre-
sponding to a 41% loss in total yield. The target dg (30 cm) is
reached, for the three regimes, at 54, 45 and 38 years, respec-
tively, meaning that the average dg growth is 0.55, 0.66 and
0.79 cm·yr
–1
for the final residual trees. The annual tree volume
growth, at the final harvest age is, respectively, 0.009, 0.020
and 0.026 m
3
·yr
–1
and this expected tree growth increase, as
the thinnings get heavier, does not offset the decrease in the
residual number of trees, resulting in a decreasing trend in final
total yield among the management regimes, from unthinned
(992 m
3
·ha
–1
) to commercially thinned (600 m
3
·ha
–1
) and
precommercially thinned (278 m
3
·ha
–1
).
The individual tree volume, at the final harvest age, is 0.68,
0.65 and 0.61 m
3
, respectively. The unthinned regime individ-
ual tree volume (0.68 m
3
), at the current tree volume rates, is
reached by the commercial regime after 2 additional years (at
47 years), 7 years before the unthinned regime and by the
precommercial regime after 3 additional years (at 41 years),
13 years before the unthinned regime.
Newton [26] and Doruska and Nolen [9] pointed out that
density management diagrams are often difficult to read and
subject to user-induced graphical interpolation error. Following
these authors’ suggestion an algorithm version and a spreadsheet
application was developed enhancing the utility of the stand
density diagram for Pinus pinaster in Portugal. Both algorithm
and spreadsheet are available by the first author upon request.
5. CONCLUSIONS
This study presents a comprehensive approach for Pinus pin-
aster even-aged stand management in Portugal, adapted to the
great majority of situations observed in the country, based on
the 1998 National Forest Inventory data.
The self-thinning allometric model is a linear limiting rela-
tionship, between plant density and average plant size. Its
development requires upper boundary plots selection and the
statistical upper confidence interval calculation for the inter-
cept term. The self-thinning allometric model slope coefficient
(–1.897) lies within the interval observed by other authors.
The upper and lower limits for the optimum growth-density
interval, as well as the crown closure line require attention. In
this study, square spacing and 10 cm reference dbh were
selected to calculate these limits and line, and the resulting val-
ues, respectively 63, 32 and 24%, are also within the interval
observed by other authors.
The associated relationships developed in this study allow
evaluation of thinning regimes in terms of age, height and vol-
ume (Fig. 2). Age is an implicit variable, which can be calcu-
lated from site index curve equations if site index information
is available. Compared to the unthinned regime, a target dg
(30 cm) was reached between 9 (commercial regime) and 16
(precommercial regime) years earlier, but for considerably
lower remaining trees·ha
–1
, 544 (less 245) and 350 (less 439),
respectively. Compared to the unthinned regime, total yield for
the commercial and precommercial regimes are, respectively,
60% and 28% lower. However, the commercial regime per-
forms better than the unthinned regime, which contains
456 m
3
·ha
–1
of mortality. On the other hand, the precommercial
regime clearly underutilizes the site (Tab. III).
This study results confirms the known effects of thinning
regimes intensity on tree and stand variables development. The
heavier the thinnings regimes, the higher the tree variables
(average dg and tree volume growth) and the lower the stand
variables (residual final trees and total yield) become.
Acknowledgements: The authors acknowledge the 1998 National
Forest Inventory data availability, provided by Direcção General das
Florestas, Lisboa.
REFERENCES
[1] Alboreca A.R., Gonzalez G.M., El Pino Sylvestris en la Sierra de
Guadarrama, MAPA, Madrid, 1996.
[2] Broad L.R., Allometry and growth, For. Sci. 44 (1998) 458–464.
[3] Cao Q.V., Dean T.J., Baldwin V.C., Modelling the size-density
relationship in direct-seeded slash pine stands, For. Sci. 46 (2000)
317–321.
[4] Clutter J., Fortson J., Pienaar L., Brister G., Bailey R., Timber
management: A quantitative approach, John Wiley and Sons, New
York, 1983.
[5] Dean T.J., Baldwin V.C., Using a density-management diagram to
develop thinning schedules for Loblolly pine plantations, USDA
For. Serv. Res. Pap. SO-275, 1993.
[6] Dean T.J., Jokela E.J., A density management diagram for slash
pine plantations in the lower Coastal Plain, South. J. Appl. For. 16
(1992) 178–185.
[7] Décourt N., Remarque sur une relation dendrométrique inattendue.
Conséquences méthodologiques pour la construction des tables de
production, Ann. Sci. For. 31 (1974) 47–55.
[8] DGF, Inventário Florestal Nacional. Portugal Continental, MAP,
Lisboa, 2001.
[9] Doruska P.F., Nolen W.R., Use of stand density index to schedule
thinnings in Loblolly pine plantations: a spreadsheet approach,
South. J. Appl. For. 23 (1999) 21–29.
814 J.F.S. Luis, T.F. Fonseca
[10] Drew T.J., Flewelling J.W., Some recent Japanese theories of yield
density relationships and their applications to Monterey pine plan-
tations, For. Sci. 23 (1977) 517–534.
[11] Drew T.J., Flewelling J.W., Stand density management: an alterna-
tive approach and its application to Douglas-fir plantations, For.
Sci. 25 (1979) 518–532.
[12] Flewelling J.W., Drew T.J., A stand density management diagram
for lodgepole pine, in: Baumgarter D.M., Krebill R.G., Arnott J.T.,
Weetman G.F. (Eds.), Lodgepole pine: the species and its manage-
ment, Coop. Ext., Washington State Univ., Pullman, 1985, pp. 239–
244.
[13] Hall A., Martins L., A Previsão do Volume do Povoamento Total.
Um Estudo para o Pinheiro Bravo, SPCF, I Congresso Florestal
Nacional, Comunicações, Lisboa, 1986, pp. 71–77.
[14] Harper J.L., Population biology of plants, Academic Press, New
York, 1977.
[15] Gadow K., Observations on self-thinning in pine plantations, S.
Afr. J. Sci. 82 (1986) 364–368.
[16] Hozumi K., Shinozak K., Tadaky Y., Studies on the frequency dis-
tribution of the weight of individual trees in a forest stand. A new
approach towards the analysis of the distribution function and the -
3/2th power distribution, J. Ecol. 18 (1968) 10–20.
[17] Keeney R., Raiffa H., Decisions with multiple objectives: preferen-
ces and value tradeoffs, John Wiley and Sons, New York, 1976.
[18] Kumar B.M., Long J., Kumar P., A density management diagram
for teak plantations of Kerala in Peninsular India, For. Ecol.
Manage. 74 (1995) 125–131.
[19] Langsaeter A., Om tynning I enaldret gran-og furuskog. Meddel. f.
d., Nor. Skogforsoksvesen 8 (1941) 131–216.
[20] Lloyd F.T., Harms W.R., An individual stand growth model for
mean plant size based on the rule of self-thinning, Ann. Bot. 57
(1986) 681–688.
[21] Long J., A practical approach to density management, For. Chron.
61 (1985) 23–27.
[22] Luis J.F.S., Bento J.S., Oliveira A.C., A Relação Alométrica na
Condução de Povoamentos Florestais. O caso do Pinus pinaster em
Portugal, in: Páscoa F., Martinho A., Santos H., Ribeiro T. (Eds.),
Pinhal Bravo, Material Lenhoso e Resina, Comunicações do
Encontro da SPCF, ESAC, Coimbra, 1991, pp. 149–157.
[23] McCarter J.B., Long J., A Lodgepole pine density management dia-
gram, West. J. Appl. For. 1 (1986) 6–11.
[24] Moller C., The effect of thinning, age, and site on foliage, incre-
ment, and loss of dry matter, J. For. 45 (1947) 393–404.
[25] Moreira A.M., Fonseca T.F., Tabela de Produção para o Pinhal do
Vale do Tâmega, Silva Lusitana 10 (2002) 63–71.
[26] Newton F.P., Stand density management diagrams: Review of their
development and utility in stand-level management planning, For.
Ecol. Manage. 98 (1997) 251–265.
[27] Newton F.P., Weetman G.F., Stand density diagrams for managed
black spruce stands, For. Chron. 70 (1994) 65–74.
[28] Oliveira A.C., Tabela de Produção Geral para o Pinheiro Bravo das
Regiões Montanas e Submontanas, DGF, CEF, Lisboa, 1985.
[29] Palahí M., Pukkala T., Optimising the management of Scots pine
(Pinus sylvestris L.) stands in Spain based on individual-tree
models, Ann. For. Sci. 60 (2003) 105–114.
[30] Páscoa F., Estrutura Crescimento e Produção em Povoamentos de
Pinheiro Bravo. Um Modelo de Simulação, Tese de Doutoramento,
ISA, UTL, Lisboa, 1987.
[31] Porté A., Bartelink H.H., Modelling mixed forest growth: a review
of models for forest manage. For. Ecol. Manage. 150 (2002) 141–
188.
[32] Prodan M., Forest biometrics, Pergamon Press, Oxford, 1968.
[33] Reineke L.H., Perfecting a stand-density index for even aged
forests, J. Agric. Res. 46 (1933) 627–639.
[34] Smith N.J., Hann D.W., A growth model based on the self-thinning
rule, Can. J. For. Res. 16 (1986) 330–334.
[35] Smith D.M., Larson B.C., Kelty M.J., Ashton P., The Practice of
silviculture. Applied forest ecology, John Wiley and Sons, New
York, 1996.
[36] Staebler G.R., Optimum levels of growing stock for managed
stands, Proceedings SAF meeting 23 (1959) 110–113.
[37] Wetsbody M., Howell J., Influence of population structure on self-
thinning of plant populations, J. Ecol. 74 (1986) 343–359.
[38] White J., The allometric interpretation of the self-thinning rule, J.
Theor. Biol. 89 (1981) 475–500.
[39] White J., Harper J., Correlated changes in plant size and number in
plant populations, J. Ecol. 63 (1970) 467–485.
[40] Wilson F.G., Numerical expression of stocking in terms of height,
J. For. 44 (1946) 758–761.
[41]Wilson F.G., Thinning as an orderly discipline: A graphic spacing
schedule for red pine, J. For. 77 (1979) 483–486.
[42] Xue L., Ogawa K., Hagihara A., Liang S., Bai J., Self-thinning
exponents based on the allometric model in Chinese pine (Pinus
tabulaeformis Carr.) and Prince Rupprecht’s larch (Larix principis-
rupprechtti Mayr) stands, For. Ecol. Manage. 117 (1999) 87–93.
[43] Yoda K., Kira T., Ogawa H., Hozumi K., Self-thinning in over-
crowded pure stands under cultivated and natural conditions, J.
Biol. 14 (1963) 107–129.
[44] Zeide B., Analysis of the 3/2 power law of self-thinning, For. Sci.
33 (1987) 517–537.
To access this journal online:
www.edpsciences.org