Báo cáo lâm nghiệp: "Yellow-cedar and western redcedar ecophysiological response to fall, winter and early spring temperature conditions" pdf
Bạn đang xem bản rút gọn của tài liệu. Xem và tải ngay bản đầy đủ của tài liệu tại đây (858.71 KB, 8 trang )
1
Ann. For. Sci. 63 (2006) 1–8
© INRA, EDP Sciences, 2006
DOI: 10.1051/forest:2005092
Original article
Yellow-cedar and western redcedar ecophysiological response to fall,
winter and early spring temperature conditions
Steven C. Grossnickle
a
*, John H. Russell
b
a
CellFor Inc., PO Box 133, Brentwood Bay, B.C., Canada V8M 1R3
b
British Columbia Ministry of Forests, Cowichan Lake Research Station, Box 335, Mesachie Lake, B.C., Canada, V0R 2N0
(Received 17 January 2005; accepted 23 September 2005)
Abstract – Western redcedar (Thuja plicata Donn) and yellow-cedar (Chamaecyparis nootkatensis (D. Don) Spach) populations originating
from an elevation zone where these two species naturally coexist were monitored to define their performance patterns in response to seasonal
temperature conditions within the fall, winter and early spring field conditions of the Pacific Northwest coastal forest region. Western redcedar
and yellow-cedar populations were measured for changes in growth rhythms, photosynthetic patterns and freezing tolerance. Net photosynthesis
(P
n
) for both species was directly related to minimum air temperature that occurred during the prior evening, though no population differences
were detected within each species. Photosynthesis was greater in western redcedar, than yellow-cedar when minimum air temperature was
above freezing. Freezing temperatures from ~0 to –5 °C caused a greater reduction in photosynthesis for western redcedar, though not a
complete cessation of photosynthetic capability in either species. Freezing tolerance increased at a moderate rate in the fall as mean air
temperature declined for both species when their shoot systems were still active, with freezing tolerance increasing at a rapid rate when shoot
systems showed no mitotic activity. No shoot growth or mitotic activity was detected in shoot tips of both western redcedar and yellow-cedar
when mean air temperature decreased to 4 °C for the previous week. No population differences, within each species, were detected in the
development of fall freezing tolerance. Yellow-cedar obtained a slightly greater level of freezing tolerance when fall temperatures were < 4 °C.
Both species had a loss of freezing tolerance as mean air temperature increased in late winter. Shoot growth resumed in both species in late
winter when mean air temperature increased to 6 to 6.5 °C. The resumption of shoot growth resulted in a faster loss of freezing tolerance for
western redcedar compared to yellow-cedar.
Thuja plicata / Chamaecyparis nootkatensis / ecophysiological response / temperature
Résumé – Réponses écophysiologiques de Thuja plicata Donn et de Chamaecyparis nootkatensis (D. Don) Spach aux conditions
thermiques automnales, hivernales et printanières. Des populations de Thuja plicata Donn et de Chamaecyparis nootkatensis (D. Don) Spach
provenant d’une zone d’altitude où ces deux espèces coexistent ont été suivies pour définir leurs types de performances en réponse aux
conditions thermiques saisonnières de l’automne, de l’hiver et du début du printemps dans la région forestière côtière du Nord Ouest Pacifique. Les
populations de Thuja plicata et de Chamaecyparis nootkatensis ont été mesurées pour étudier les variations dans les rythmes de croissance,
les types d’activité photosynthétique et la tolérance au gel. Pour les deux espèces, la photosynthèse nette (Pn) était directement liée au minimum
de température du soir précédent, bien que des différences n’aient pas été mises en évidence entre populations dans chacune des espèces. La
photosynthèse était plus élevée chez Thuja plicata que chez Chamaecyparis nootkatensis lorsque la température minimum était au-dessus de
zéro degré. Les températures glaciales de –0 à –5 °C induisent la réduction la plus importante de la photosynthèse chez Thuja plicata,
quoiqu’il n’y ait pas un complet arrêt de la capacité photosynthétique chez l’une ou l’autre des espèces. Pour les deux espè
ces, la tolérance
au gel s’accroît en automne : modérément avec l’abaissement de la température moyenne de l’air quand leurs systèmes de pousse étaient encore
actifs, rapidement lorsque leurs systèmes de pousses ne présentent plus d’activité mitotique. Aucune croissance des pousses ou activité
mitotique n’a été notée chez Thuja plicata et Chamaecyparis nootkatensis lorsque la température moyenne de l’air baisse de 4 °C pendant le jour
précédent. Aucune différence n’a été mise en évidence entre populations pour chacune des espèces, pour ce qui concerne le développement de
la tolérance au gel. Thuja plicata a présenté un niveau de tolérance au gel légèrement plus grand quand en automne, les températures étaient
< 4 °C. Les deux espèces avaient une perte de tolérance au gel avec l’accroissement de la température de l’air en fin d’hiver. La croissance
des pousses a repris en fin d’hiver lorsque la température moyenne augmentait jusqu’à 6 à 6,5 °C. La reprise de la croissance des pousses a
été le résultat d’une perte plus rapide de la tolérance au gel chez Thuja plicata par comparaison avec Chamaecyparis nootkatensis.
Thuja plicata / Chamaecyparis nootkatensis / réponse écophysiologique / température
1. INTRODUCTION
The Pacific Northwest coastal region is dominated by conif-
erous forests that extend from southwestern Alaska, through
British Columbia, and south into northern California. Western red-
cedar (Thuja plicata Donn) and yellow-cedar (Chamaecyparis
nootkatensis (D. Don) Spach) are both members of the Cupres-
saceae, or cypress, family and are found within this forested
* Corresponding author:
Article published by EDP Sciences and available at or />2 S.C. Grossnickle, J.H. Russell
region. These forests exist in a region that is typically exposed
to wet and mild winters. Western redcedar is usually confined
to lower elevation (i.e., below 1400 m) forests where freezing
temperatures occasionally occur, but rarely below –5 °C during
the winter months [10, 17]. Yellow-cedar is found near sea level
in Alaska and at mid to high elevations (i.e., 600 to 2300 m) in
the southern half of its range where air temperatures do not typ-
ically fall below –30 °C during the winter [10, 17]. Thus, there
are portions of this coastal region where western redcedar and
yellow-cedar coexist in the same forests.
The wet and mild fall-winter temperature condition of the
Pacific Northwest coastal forests allows some conifer species
to have unique seasonal morphological development and phys-
iological patterns. For example, western redcedar and yellow-
cedar do not have a fixed fall-winter shoot growth pattern.
These species typically have inactive shoot growth during the
fall and winter season, though they have an opportunistic form
of growth that responds to seasonal temperature conditions
[35]. Conifer species, such as western redcedar and yellow-
cedar, are believed to have a distinct advantage under the cur-
rent climatic conditions of this region because photosynthesis
is responsive to temperature changes during the fall and winter
months [53]. In addition, mild winter temperature conditions
found in coastal forest regions allow species lacking a special-
ized resting bud to attain only a moderate level of freezing tol-
erance in direct response to temperature changes [41]. By
defining the physiological response of a species to specific site
environmental conditions, one provides a means to understand
the biological basis for adaptability of a species to site [7]. Thus,
it is hypothesized that seasonal temperature conditions found
within these coastal coniferous forests can have a strong effect
on the ecophysiological response of western redcedar and yel-
low-cedar during the fall, winter and early spring period.
This study determined the shoot growth pattern, plus pho-
tosynthetic and freezing tolerance patterns of western redcedar
and yellow-cedar populations during fall, winter and early
spring. The experimental objective was to determine whether
western redcedar and yellow-cedar populations originating
from the same elevation zone differ in their fall, winter and
spring acclimation process in response to seasonal temperature
conditions. Knowing how fall-winter-early spring climatic
conditions affect the performance of western redcedar and yel-
low-cedar will improve the understanding of these species
niche within the Pacific Northwest coastal forests. This infor-
mation can enable practitioners to develop effective adaptive
forest management practices and the scientific community to
have a better appreciation of western redcedar and yellow-
cedar responses when modeling for potential climate change.
2. MATERIALS AND METHODS
2.1. Plant material
Western redcedar (Thuja plicata Donn) and yellow-cedar
(Chamaecyparis nootkatensis (D. Don) Spach) experimental material
originated from two elevational locations (western redcedar: 570 and
900 m; yellow-cedar: 570 and 1100 m) on Mt. Washington, British
Columbia, Canada (49° 6’ N, 125° 3’ W). Cuttings were collected from
the lower crown from six young natural trees of each species at each
elevation in September of 1993 and rooted at Cowichan Lake Research
Station under standard cultural practices [40]. Five random rooted cut-
tings from each clone were transplanted into 1 gallon pots and grown
under a standard greenhouse regime during the 1994 season. All donor
plants were hedged during the growing season. Cuttings were then
retaken in the fall of 1994 from each of the five donor plants per clone
and rooted under standard cultural practices in Spencer LeMaire
Hilson’s™ containers using a completely randomized block design
with three replications of up to 63 cuttings per clone per block. Rooted
cuttings were cultured as 1+0 container-grown plants throughout the
1995 growing season. The above procedure assisted in minimizing
maturation-related effects and both “C-effects” (between clone com-
mon environments) and “c-effects” (within clone common environ-
ments) that can influence rooting, stock quality and growth [40].
2.2. Field design
Rooted cuttings were placed on two coastal sites (49° 2’ N, 123° 7’ W
at 50 m and 1000 m) in late summer. Each test population was com-
prised of one-year-old rooted cuttings with an even distribution from
six clones for each population of each species. Rooted cuttings were
transferred into 415D Styroblock™ (Beaver Plastics) at 160 mL vol-
ume with a completely randomized experimental design with
20 rooted cuttings from each of six clones for each of the two source
locations within each species (i.e., a total of 480 potted plants). The
exact same experimental design was located on two field sites with
plants on both sites monitored for shoot growth and freezing tolerance
patterns, in the fall (until snow covered the high elevation site), while
photosynthesis, shoot growth and freezing tolerance were monitored
throughout winter and spring on the low elevation site. Within this
experimental population, rooted cuttings were randomly selected for
morphological and physiological measurements. The same randomly
selected rooted cuttings were repeatedly measured for morphological
and gas exchange measurements. Freezing tolerance measurements
were taken on a rotating population of rooted cuttings with an equal
representation from each clone across sample populations. Styrob-
locks™ of edge seedlings were placed around the test population.
Total size of field trials were ~16 m
2
. This small field trial size min-
imized any rooted cuttings exposure to microclimatic differences
throughout the trial.
Containers were covered with 2.5 to 5.0 cm of bark mulch to min-
imize any root damage due to seasonal freezing or drought events.
Rooted cuttings were watered weekly during the fall to minimize expo-
sure to drought conditions. Rooted cuttings were exposed to the normal
seasonal decline in fall photoperiod and temperature on both field
sites, while the low elevation site was exposed to winter through early
spring seasonal photoperiod and temperature patterns. The high ele-
vation site was covered with snow after Julian day 320 and was under
snow throughout the remainder of the study. Air (at 25 cm) tempera-
ture was monitored continuously on field sites. Rooted cuttings were
allowed to acclimate for two weeks prior to the start of any measure-
ments.
At time of field establishment, the western redcedar populations
had an overall height and diameter of 31.4 cm and 3.8 mm, respec-
tively and the yellow-cedar populations had an overall height and
diameter of 28.6 cm and 3.7 mm, respectively
2.3. Shoot growth
The point at which shoot growth ceased was measured by mitotic
activity for both species from late September through early November
1995, every other week. Shoot growth assessments were repeated on
the same rooted cuttings throughout the fall. Resumption of shoot
growth in the spring was determined by measuring changes in shoot
length from mid February through March, 1996. Each elevational
Yellow-cedar and western redcedar winter ecophysiological response 3
population for each species had 12 rooted cuttings (i.e., 2 rooted cut-
tings from each of 6 clones were measured to provide equal represen-
tation across the sample population) randomly selected and then
marked for shoot growth measurements. At the beginning of the exper-
iment, a selected location on the shoot leader was marked with a non-
toxic compound to facilitate consistent measurement of new terminal
shoot development.
Mitotic activity determined fall cessation of shoot growth and was
measured on lateral shoot tips from the upper portion of rooted cuttings
[27]. Shoot tips were collected and fixed immediately in McClintock’s
solution [25]. Shoot apices were hydrolyzed in 1 M HCL overnight
and then stained with Schiff’s reagent (Feulgen reaction). These shoot
tips were squashed on a microscope slide, underneath a cover-slip, and
then mitotic activity was determined (i.e., whether or not cells were
in the interphase).
2.4. Gas exchange
Photosynthetic response was assessed on a weekly basis starting
in early September, 1995, and continued until mid April, 1996. Net
photosynthesis (P
n
) was measured on rooted cuttings of both species
at the low elevation field site. Net photosynthesis was measured with
a LI-6200 (LI-COR Inc.) gas exchange system and a ¼ L (LI-6200-13)
sample chamber cuvette. Additional gas exchange measurements were
taken, when possible, after all natural freezing events. Gas exchange
measurements were taken at 9:00 AM under a shelter at the field site.
During measurements, rooted cuttings were exposed to ambient tem-
perature, humidity and CO
2
conditions under a point light source of
1000 μmol m
–2
s
–1
photosynthetically active radiation to produce a
maximum P
n
reading. Each measurement was 30 s in length to reduce
variation between ambient and chamber environments. Gas exchange
measurements were taken from two to four hours after sunrise. There
were six gas exchange replicates per population for each species (i.e.,
1 plant from each of 6 clones from each of two populations for each
species resulted the measurement of 24 rooted cuttings).
2.5. Freezing tolerance
Freezing tolerance was measured on a bi-weekly basis from early
September, 1995, through mid April, 1996. Freezing tolerance of foli-
age was determined by the freeze-induced electrolyte leakage (FIEL)
procedure [4]. Foliage was removed from branches on the middle third
of the stem from two rooted cuttings from each of six clones for each
population of each species to provide equal representation across the
sample population. Samples were collected from tertiary lateral
branch foliage; foliage segments were cut at both ends into 0.5 cm
lengths, washed in de-ionized water and pooled from both rooted cut-
tings for each clone. These foliage segments were transferred, in ran-
dom groups of 12, to glass culture tubes containing 0.5 mL de-ionized
water. One tube from each clone was stoppered and placed in ice water
as a control at 1 °C. Four tubes from each clone were placed in an eth-
anol bath at –2 °C, cooled by a refrigeration system (Forma Scientific
MC-8-80). Water in all tubes in the ethanol bath was nucleated simul-
taneously with ice crystals after 0.5 h, and tubes were stoppered. The
ethanol bath was then cooled at 5 °C h
–1
.
Four temperatures were selected to bracket the anticipated 50% tis-
sue electrolyte leakage value. When one of the selected temperatures
was reached, tubes for each species were removed and contents were
allowed to thaw in ice water. After contents of all tubes had thawed,
5.5 mL of de-ionized water was added to each tube. Tubes were then
stoppered and placed on a 100 rpm shaker at 24 °C for 20–24 h. Con-
ductivity of the solution in each tube was measured after incubation.
Tubes were then placed in a 90 °C water bath for 15 min to induce
maximum tissue injury and conductivity was re-measured after an
additional 20 h on a 100 rpm shaker at 24 °C.
Measured FIEL values were interpreted as an index of injury (II)
[6, 8] with modifications made by [4]. Test results were reported as
percent II calculated by the following formula:
where T
1
and T
2
are the conductivity of treatment tubes after freezing
and after boiling, respectively, and C
1
and C
2
are the conductivity of
control tubes before and after boiling, respectively. Temperature at
which 50% foliage electrolyte leakage occurred (i.e., LT
50
) was then
calculated for each species using a linear regression equation derived
from injury indices measured at four subzero temperatures.
2.6. Data analysis
Physiological and shoot growth parameters measured across sea-
sons were related to the following site temperature parameters: (1) P
n
readings were related to minimum air temperature from the previous
night period, (2) cessation and the resumption of shoot growth were
related to mean air temperature for the previous seven day period, and
(3) freezing tolerance readings were related to mean air temperature
for the previous seven day period. Freezing tolerance measurements
taken in the fall on the high elevation site were combined with low
elevation site data to capture species response to temperature condi-
tions down to 0 °C. The dynamic nature of gas exchange and freezing
tolerance patterns to seasonal temperature conditions requires a phe-
nomenological (i.e., descriptive) modeling approach to capture a rep-
resentative response pattern to the seasonal temperature range. One
can increase the predictive power of performance assessment; in this
case species variation of gas exchange [16] and freezing tolerance [49]
patterns, by developing phenomenological models with the most lim-
iting seasonal environmental parameter (i.e., temperature). Regression
models were developed to relate physiological response to these var-
ious temperature parameters [26]. Models with all components (i.e.,
transformations of various temperature parameters) significantly con-
tributing (p = 0.05), and with the highest r
2
values, were considered
to have the best fit. Models for each physiological parameter, for each
population within each species, and differences between species, in
response to various temperature parameters are specified in the cor-
responding figure. These models qualitatively describe the range of
variation between sampled populations physiological response as
absolute values.
Physiological response to various temperature parameters were
analyzed by either an analysis of variance or covariance analysis for
population differences for each species, and population differences
between species. No analysis was conducted on cessation and resump-
tion of shoot growth because it occurred at the same time for both spe-
cies and for populations within each species. When relationships
between physiological parameters with temperature parameters were
nonlinear, these parameters were transformed in logarithmic fashion
to obtain a linear relationship with the covariant (temperature param-
eter). Data transformation remedies not only deviations from linearity,
but also tends to simultaneously remove non-normality and heder-
oscedasticity to allow a test of significance on nonlinear data [24]. The
general statistical model used for covariance analysis was:
Y
ijk
= μ + C
i
+ W
j
+ CW
ij
+
ε
ijk
where Y
ijk
is the physiological measurement, μ the population mean
(2 species × 2 elevations), C
i
is the effect of ith population, W
j
is the
effect of the jth covariant (temperature parameter), CW
ij
is the inter-
action of the ith population with the jth covariant,
ε
ijk
is the random
effect. This model was first run using the general linear model proce-
dure to test slope homogeneity before an analysis of covariance was
II 1
1 T
1
/T
2
–
1 C
1
/C
2
–
⎝⎠
⎛⎞
–
⎩⎭
⎨⎬
⎧⎫
100×=
4 S.C. Grossnickle, J.H. Russell
performed using an ANCOVA procedure. Population differences
within a species along with population differences between species for
various physiological parameters were then determined using a
Tukey’s HSD multiple comparison analysis procedure. All statistical
analyses procedures used the Statistics, Systat
®
for Windows™ pro-
grams (Version 5.0) [55].
3. RESULTS AND DISCUSSION
3.1. Net photosynthesis
Net photosynthesis (P
n
) had a general seasonal pattern of
declining P
n
rates during the fall for both western redcedar and
yellow-cedar, with consistently low P
n
rates during mid winter,
followed by increasing P
n
rates in late winter and early spring
(data not shown). This seasonal pattern of P
n
for western red-
cedar and yellow-cedar is attributable, in part, to the influence
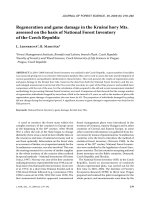
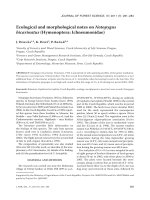
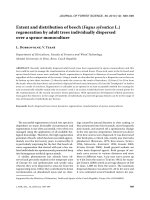
of minimum air temperature. The P
n
rates of both western red-
cedar and yellow-cedar decreased with a decline in the previous
night minimum air temperature, though change was more rapid in
western redcedar than yellow-cedar (0.19 and 0.13 μmol m
–2
s
–1
change in P
n
of western redcedar and yellow-cedar, respec-
tively, for every 1 °C change in minimum air temperature)
(Fig. 1). Western redcedar had higher (P < 0.05) P
n
rates than
yellow-cedar when minimum air temperature was above freez-
ing. Field and laboratory studies have found low, but above
freezing, air temperature can limit the photosynthetic process
of conifers [31, 33, 34, 44, 47].
Freezing temperatures from ~0 to –5 °C caused a further
reduction, though not a complete stoppage, of photosynthetic
capability in western redcedar and yellow-cedar (Fig. 1). The
minimum air temperature at which P
n
declined to zero was esti-
mated to be –9.3 °C for western redcedar and –12.2 °C for yel-
low-cedar. Western redcedar quickly recovers its photosynthetic
capability after exposure to freezing temperatures as low as
–15 °C when measured during January [23]. Winter season tol-
erance of photosynthetic capability is attributed to “hardening”
characteristics of tree species growing in low-temperature cli-
mates [50]. Western redcedar and yellow-cedar have a high
level of stress resistance (i.e., tolerance to both drought (west-
ern redcedar: [13], yellow-cedar: [15]) and freezing tolerance,
see below) during the winter. These species photosynthetic sys-
tems have developed the capability to withstand mild freezing
events during the winter, thereby replenishing carbon stores
and offsetting the metabolic cost of retaining foliage through-
out the winter.
In some instances during the late fall, winter and early
spring, P
n
rates in western redcedar and yellow-cedar (data not
shown) can reach levels comparable to those measured during
active growth (western redcedar: [32]; yellow-cedar: [14]).
High P
n
rates occurred when air temperatures reached unsea-
sonably high values (e.g., minimum air temperature > 5.0 °C:
Fig. 1). Mid winter increases the photosynthetic rates of conif-
erous species occur when there are warm air temperature events
[42, 43, 48, 50].
There was no difference in the P
n
response of populations
for either western redcedar or yellow-cedar (Fig. 1). No com-
parable published work describes within species population
response of P
n
to fall, winter and early spring temperature con-
ditions for these species. Studies on tree species have found that
higher elevation seed-sources can have a higher P
n
response to
lower temperature conditions [11, 29, 46, 51]. The lack of pop-
ulation differences in western redcedar and yellow-cedar is
most likely attributed to only a 300 to 500 m elevation separa-
tion for sample populations.
3.2. Shoot growth
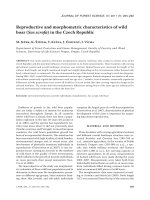
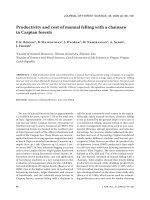
Shoot growth had ceased in all populations of western red-
cedar and yellow-cedar by Julian day 308, and this corre-
sponded to a decrease in mean air temperature to 4 °C (Fig. 2).
Figure 1. Changes in maximum net photosynthesis (P
n
) of western
redcedar (low at 570 m and high at 900 m) and yellow-cedar (low at
570 m and high at 1100 m) populations to the previous night minimum
air temperature throughout the fall, winter and early spring. The last
figure shows the response of western red cedar (dashed lines) and yel-
low-cedar (solid lines).
Yellow-cedar and western redcedar winter ecophysiological response 5
No mitotic activity was detected in shoot tips of western redc-
edar and yellow-cedar at this point in time. Western redcedar
is considered dormant when mitotic activity declines to zero
[27]. Western redcedar and yellow-cedar have no fixed shoot
growth periodicity and are adapted to an opportunistic form of
growth [35]. These species have a growing season that can
extend into late fall as long as growing conditions are favorable
[45]. Thus, it was assumed that western redcedar and yellow-
cedar had reached their seasonal period of inactive shoot
growth after mean air temperature decreased to 4 °C in the fall.
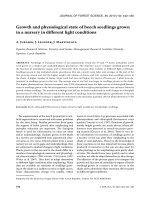
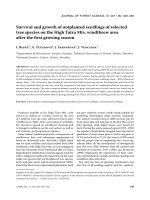
Measurable shoot growth was detected in late winter by
Julian day 72 after exposure to a mean air temperature of 6.0
to 6.5 °C (Fig. 3). Both species and both populations for each
species, resumed shoot growth at the same period of time. Con-
ifers with buds become active primarily in response to rising
temperatures in late winter and early spring [36].
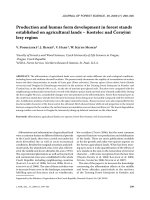
Figure 2. Changes in freezing tolerance (LT
50
is the freezing tempe-
rature resulting in 50% foliage electrolyte leakage) of western redce-
dar (low at 570 m and high at 900 m) and yellow-cedar (low at 570 m
and high at 1100 m) populations to mean air temperature (previous
seven day average) in the fall. Arrows on the figure indicate the date
when shoot growth cessation occurred in the fall for both species. The
last figure shows the response of western red cedar (dashed lines) and
yellow-cedar (solid lines).
Figure 3. Changes in freezing tolerance (LT
50
is the freezing tempe-
rature resulting in 50% foliage electrolyte leakage) of western redce-
dar (low at 570 m and high at 900 m) and yellow-cedar (low at 570 m
and high at 1100 m) populations to mean air temperature (previous
seven day average) in the winter and early spring. Arrows on the figure
indicate the date when shoot growth resumed in the late winter for
both species. The last figure shows the response of western redcedar
(dashed lines) and yellow-cedar (solid lines).
6 S.C. Grossnickle, J.H. Russell
3.3. Freezing tolerance
Freezing tolerance decreased during the fall, with a consist-
ently high level of freezing tolerance during mid winter, fol-
lowed by decreasing freezing tolerance in late winter and early
spring (data not shown). This is the typical seasonal freezing
tolerance pattern for both western redcedar [9, 13, 21] and yel-
low-cedar [5, 22] in coastal forests of the Pacific Northwest.
Western redcedar and yellow-cedar both displayed a com-
parable fall decline in freezing tolerance. The LT
50
values (i.e.,
freezing temperature at which 50% foliage electrolyte leakage
occurred) of both western redcedar and yellow-cedar decreased
as mean air temperature declined (Fig. 2). There was no differ-
ence in the LT
50
response of populations for either species. In
addition, both species had a similar decrease in LT
50
values
during the fall decline in air temperature.
Development of freezing tolerance in conifers normally is
initiated in late summer and fall during acclimation to seasonal
changes in photoperiod and temperature [41]. Freezing toler-
ance in western redcedar [9, 45] and yellow-cedar [37, 45] can
be initiated by a decrease in photoperiod. The first stage of cold
acclimation appears to result from exposure to short days while
air temperature remains fairly high (> 10 °C). In early fall, both
western redcedar and yellow-cedar developed moderate levels
of freezing tolerance when their shoot systems were still active
which was related to a gradual decrease in mean air temperature
(1.2 and 2.4 °C decrease in LT
50
of western redcedar and yel-
low-cedar, respectively, for every 1 °C decline in mean air tem-
peratures above 10 °C) (Fig. 2). In conifers that develop a bud,
the cessation of shoot elongation and development of over win-
ter buds is an indication of vegetative maturity [3] and is con-
sidered the first stage of fall acclimation to low temperatures
[30, 54]. At this point plants accumulate stored reserves to serve
as an energy source for metabolic changes during the second
stage of acclimation [41]. The second stage of acclimation
occurs when plants are exposed to low fall temperatures, with
freezing tolerance increasing rapidly and reaching a maximum
level [3]. Both western redcedar and yellow-cedar are consid-
ered in a dormant state when growth has ceased and there is no
detectable mitotic activity [27, 35]. Freezing tolerance
increased at a greater rate in yellow-cedar than western redce-
dar when they were in an inactive state with the fall decrease
in mean air temperature (4.1 and 5.3 °C increase in freezing tol-
erance for western redcedar and yellow-cedar, respectively, for
every 1
o
C decline in mean air temperature below 4 °C). Find-
ings corroborate work showing that freezing tolerance devel-
ops rapidly in western redcedar [13, 45] and yellow-cedar [5,
20, 21] exposed to lower winter air temperatures.
As air temperature increases in late winter and early spring,
freezing tolerance decreases in both western redcedar and yel-
low-cedar. There was no difference in the LT
50
response of
populations for yellow-cedar, while the low population lost
freezing tolerance at a faster rate (P < 0.05) than the high pop-
ulation for western red cedar (Fig. 3). Western redcedar low
population lost freezing tolerance at a faster rate (P < 0.05)
compared to yellow-cedar (4.2 °C and 3.5 °C increase in LT
50
for western redcedar and yellow-cedar, respectively, for every
1 °C increase in mean air temperature) in late winter and early
spring. Temperature is considered the primary environmental
variable controlling the loss of freezing tolerance in late winter
and early spring in yellow-cedar [20] and in conifer species, in
general [2, 12, 49, 52].
Western redcedar had lower levels of freezing tolerance than
yellow-cedar after the initiation of shoot growth, though the
rate of loss was not affected by when their shoots had resumed
growth. Increasing air temperature, along with an increasing
photoperiod, interact to allow for the earliest possible bud activ-
ity that is compatible with the risk of damage due to frost [28].
It was recognized that both increasing temperature and pho-
toperiod occurred during the late winter and early spring rapid
loss of freezing tolerance, though their separate effects cannot
be discerned in this field trial. A rapid loss of freezing tolerance
occurs in yellow-cedar under the combination of increasing
temperature and photoperiod [18, 19].
Freezing tolerance related traits are thought to be under rel-
atively strong selection pressure, and that these traits are adap-
tive and under differential selection in different environments
[1]. In this study, freezing tolerance was fairly similar for pop-
ulations from within the elevational gradient where both spe-
cies coexist. Reported work has found a weak elevational cline
in seasonal freezing tolerance patterns of western redcedar [38]
and yellow-cedar populations [21]. Other work on another
indeterminate conifer species (Cupressus arizonica Greene)
has also shown little variation along elevational cline in sea-
sonal freezing tolerance [39]. The lack of difference among
populations within species is most likely attributable to popu-
lations being separated by only 300 m to 500 m with the result-
ant gene flow decreasing potential selection effects on gene
frequencies. As well, both species typically display less adap-
tive variation as compared to its sympatrics [20, 38].
4. CONCLUSIONS
Western redcedar and yellow-cedar were exposed to chang-
ing seasonal temperatures that are typically found under field
conditions in coastal forests of the Pacific Northwest during the
fall, winter and early spring period. Both western redcedar and
yellow-cedar photosynthetic patterns during fall, winter and
early spring were directly affected by minimum air tempera-
tures. It appears that yellow-cedar retains a greater capacity for
photosynthesis at low temperatures, while western redcedar has
greater photosynthetic capacity at above freezing temperatures.
Freezing tolerance patterns in the fall, winter and early spring
are directly affected by changes in mean air temperature. Fall
development of freezing tolerance was gradual prior to the ces-
sation of shoot growth and more rapid after the cessation of
shoot growth in both species. Both species acquire freezing tol-
erance in the fall at a very similar rate. Western redcedar loses
freezing tolerance in the late winter and early spring at a more
rapid rate than yellow-cedar. Furthermore, low elevation west-
ern redcedar appears to lose freezing tolerance much more rap-
idly in the spring than yellow-cedar. Populations from where
both species coexist had fairly similar patterns of shoot growth,
photosynthetic capability and freezing tolerance throughout the
fall, winter and early spring period. The similarity in perform-
ance of western redcedar and yellow-cedar, and populations
with each species, corroborates the generalist classification that
has been given to these species.
Yellow-cedar and western redcedar winter ecophysiological response 7
Acknowledgments: Support for this study came from a Forest
Renewal B.C. program (No. HQ96440-RE) to John Russell with the
British Columbia Ministry of Forests.
REFERENCES
[1] Aitken S.N., Hannerz M., Genecology and gene resource manage-
ment strategies for conifer cold hardiness, in: Bigras F.J., Colombo
S.J. (Eds.), Conifer Cold Hardiness, Kluwer Academic Publishers,
The Netherlands, 2001, pp. 23–53.
[2] Aronsson A., Influence of photo- and thermoperiod on the initial
stages of frost hardening and dehardening of phytotron-grown see-
dlings of Scots pine (Pinus silvestris L.) and Norway spruce (Picea
abies (L.) Karst.), Stud. For. Suec. 128 (1975) 5–20.
[3] Burr K.E., The target seedling concept: bud dormancy and cold-
hardiness, in: Rose R., Campbell S.J., Landis T.D. (Eds.), Target
Seedling Symposium: Proceedings of the Western Forest Nursery
Associations, USDA For. Serv. Gen. Tech. Rep. RM-200, pp. 79–90.
[4] Bur K.E., Tinus R.W., Wallner S.J., King R.M., Comparison of
three cold hardiness tests for conifer seedlings, Tree Physiol. 6
(1990) 351–369.
[5] Davradou M., Hawkins B.J., Effects of plantation location and popula-
tion on the seasonal freezing tolerance of yellow-cedar (Chamaecy-
paris nootkatensis) stecklings, New For. 15 (1998) 77–88.
[6] Dexter S.T., Tottingham W.E., Graber L.F., Preliminary results in
measuring the hardiness of plants, Plant Physiol. 5 (1930) 215–223.
[7] Dickmann D., Role of physiology in forest tree improvement,
Silva. Fenn. 25 (1992) 248–256.
[8] Flint H.L., Boyce B.R., Beattie D.J., Index of injury – a useful
expression of freezing injury to plant tissues as determined by the
electrolytic method, Can. J. Plant Sci. 47 (1967) 229–230.
[9] Folk R.S., Grossnickle S.C., Major J.E., Arnott J.T., Influence of
nursery culture on western redcedar. II. Freezing tolerance of fall-
planted seedlings and morphological development of fall- and
spring-planted seedlings, New For. 8 (1994) 231–247.
[10] Fowells H.A. (Ed.), Silvics of forest trees of the United States,
USDA For. Serv. Ag. handbook, No. 271, 1965.
[11] Fryer J.H., Ledig F.T., Microevolution of the photosynthetic tem-
perature optimum in relation to the elevational complex gradient,
Can. J. Bot. 50 (1972) 1231–1235.
[12] Greer D.H., Stanley C.J., Regulation of the loss of frost hardiness
in Pinus radiata by photoperiod and temperature, Plant Cell Envi-
ron. 8 (1985) 111–116.
[13] Grossnickle S.C., Relationship between freezing tolerance and
shoot water relations of western redcedar, Tree Physiol. 11 (1992)
229–240.
[14] Grossnickle S.C., Russell J.H., Gas exchange processes of yellow-
cedar (Chamaecyparis nootkatensis (D. Don) Spach) in response to
environmental variables, Can. J. Bot. 69 (1991) 2684–2691.
[15] Grossnickle S.C., Russell J.H., Changes in shoot water relations
parameters of yellow-cedar (Chamaecyparis nootkatensis (D. Don)
Spach) in response to environmental conditions, Can. J. Bot. 74
(1996) 31–39.
[16] Hall A.E., Mathematical models of plant water loss and plant water
relations, in: Lange O.L., Nobel P.S., Osmond C.B., Ziegler H. (Eds.),
Physiological Plant Ecology. II. Water Relations and Carbon Assi-
milation, Springer-Verlag, New York, NY, 1982, pp. 231–262.
[17] Harlow W.M., Harrar E.S., Textbook of dendrology, 5th ed.
McGraw-Hill, 1969, 512 p.
[18] Hawkins B.J., Photoperiod and night frost influence the frost hardi-
ness of Chamaecyparis nootkatensis clones, Can. J. For. Res. 23
(1993) 1408–1414.
[19] Hawkins B.J., McDonald S.E., Photoperiod influences dehardening
of Chamaecyparis nootkatensis seedlings, Can. J. For. Res. 23
(1993) 2452–2454.
[20] Hawkins B.J., Russell J., Arnott J.T., Cold hardiness of yellow-
cedar (Chamaecyparis nootkatensis (D. Don) Spach), in: Bigras
F.J., Colombo S.J. (Eds.), Conifer Cold Hardiness, Kluwer Acade-
mic Publishers, The Netherlands, 2001, pp. 531–554.
[21] Hawkins B.J., Russell J., Shortt R., Effect of population, environ-
ment, and maturation on frost hardiness of yellow-cedar (Chamae-
cyparis nootkatensis), Can. J. For. Res. 24 (1994) 945–953.
[22] Hawkins B.J., Henry G., Whittington J., Frost hardiness of Thuja
plicata and Pseudotsuga menziesii seedlings when nutrient supply
varies with season, Can. J. For Res. 25 (1995) 1509–1513.
[23] Hawkins B.J., Davradou M., Pier D., Shortt R., Frost hardiness and
winter photosynthesis of Thuja plicata and Pseudotsuga menziesii
seedlings grown at three rates of nitrogen and phosphorus supply,
Can. J. For. Res. 24 (1994) 18–28.
[24] Huitema B.E., The Analysis of Covariance and Alternatives, John
Wiley & Sons, New York, 1980.
[25] Johansen D.A., Plant Microtechnique, McGraw-Hill, 1940.
[26] Kleinbaum D.G., Kupper L.L., Muller K.E., Applied regression
analysis and other multivariable methods, 2nd ed., PWS-Kent
Publishing Co. Boston, 1998.
[27] Krasowski M.J., Owens J.N., Growth and morphology of western
redcedar seedlings as affected by photoperiod and moisture stress,
Can J. For. Res. 21 (1991) 340–352.
[28] Lavender D.P., Sweet G.B., Zaerr J.B., Hermann R.K., Spring
shoot growth in Douglas-fir may be initiated by gibberellins expor-
ted from the roots, Science, 182 (1973) 838–839.
[29] Ledig F.T., Korbobo D.R., Adaptation of sugar maple populations
along altitudinal gradients: photosynthesis, respiration, and specific
leaf weight, Am. J. Bot. 70 (1983) 256–265.
[30] Levitt J., Response of Plants to Environmental Stress. Vol. I. Chil-
ling, Freezing and High Temperature Stress, Academic Press, New
York, 1980.
[31] Ludlow M.M., Jarvis P.G., Photosynthesis in Sitka spruce (Picea
sitchensis (Bong.) Carr.), J. Appl. Ecol. 8 (1971) 925–954.
[32] Major J.E., Grossnickle S.C., Folk R.S., Arnott J.T., Influence of
nursery culture on western redcedar. I. Measurement of seedling
attributes before fall and spring planting, New For. 8 (1994) 211–
229.
[33] Neilson R.E., Jarvis P.G., Photosynthesis in Sitka spruce (Picea sit-
chensis (Bong.) Carr). VI. Response of stomata to temperature, J.
Appl. Ecol. 12 (1976) 879–891.
[34] Öquist G., Effects of low temperature on photosynthesis, Plant Cell
Environ. 6 (1983) 281–300.
[35] Owens J.N., Moder M., Reproductive cycles of western redcedar
and yellow-cedar, Information Services Branch, British Columbia
Ministry of Forests, Mesachie Lake, B.C., 1984.
[36] Perry T.O., Dormancy of trees in winter, Science 171 (1971) 29–36.
[37] Puttonen P., Arnott J.T., Influence of photoperiod and temperature
on growth, gas exchange, and cold hardiness of yellow cypress
(Chamaecyparis nootkatensis (D. Don) Spach) stecklings, Can. J.
For. Res. 24 (1994) 1608–1616.
[38] Rehfeldt G.E., Genetic structure of western red cedar populations
in the Interior West, Can. J. For. Res. 24 (1994) 670–680.
[39] Rehfeldt G.E., Quantitative analyses of the genetic structure of clo-
sely related conifers with disparate distributions and demographics:
the Cupressus arizonica complex, Am. J. Bot. 84 (1997) 190–200.
[40] Russell J.H., Grossnickle S.C., Ferguson C., Carson D.W., Yellow-
cedar stecklings: Nursery production and field performance, FRDA
Rep. 148, 1990, 20 p.
8 S.C. Grossnickle, J.H. Russell
[41] Sakai A., Larcher W., Frost Survival of Plants, Ecological Studies
Vol. 62, Springer-Verlag, New York, 1987.
[42] Schaberg P.G., Wilkinson R.C., Shane J.B., Donnelly J.R., Cali
P.F., Winter photosynthesis of red spruce from three Vermont seed
sources, Tree Physiol. 15 (1995) 345–350.
[43] Schaberg P.G., Shane J.B., Hawley G.J., Strimbeck G.R., DeHayes
D.H., Cali P.F., Donnelly J.R., Physiological changes in red spruce
during a simulated winter thaw, Tree Physiol. 16 (1996) 567–574.
[44] Schwarz P.A., Fahey T.J., Dawson T.E., Seasonal air and soil tem-
perature effects on photosynthesis in red spruce (Picea rubens)
saplings, Tree Physiol. 17 (1997) 187–194.
[45] Silim N., Lavender D.P., Seasonal patterns and environmental
regulation of frost hardiness in shoots of seedlings of Thuja plicata,
Chamaecyparis nootkatensis, and Picea glauca, Can. J. Bot. 72
(1994) 309–316.
[46] Slatyer R.O., Ferrar P.J., Altitudinal variation in the photosynthesis
characteristics of snow gum, Eucalyptus pauciflora Sieb. Ex
Spreng. II. Effects of growth temperature under controlled condi-
tions, Aust. J. Plant Physiol. 4 (1977) 289–299.
[47] Strand M., Lundmark T., Söderbergh I., Mellander P.E., Impacts of
seasonal air and soil temperatures on photosynthesis in Scots pine
trees, Tree Physiol. 22 (2002) 839–847.
[48] Strimbeck G.R., Schaberg P.G., DeHayes D.H., Shane J.B.,
Hawley G.J., Midwinter dehardening of montane red spruce during
a natural thaw, Can. J. For. Res. 25 (1995) 2040–2044.
[49] Timmis R., Flewelling J., Talbert C., Frost injury prediction model
for Douglas-fir seedlings in the Pacific Northwest, Tree Physiol. 14
(1994) 855–869.
[50] Tranquillini W., Physiological Ecology of the Alpine Timberline,
Springer-Verlag, N.Y., 1979.
[51] Tranquillini W., Havranek W.M., Influence of temperature on pho-
tosynthesis in spruce provenances from different altitudes, in: Turner
H., Tranquillini W. (Eds.), Establishment and Tending of Subalpine
Forest: Research and Management, Proc. 3rd IUFRO Workshop
P 1.07-00 Eidg. Anstl. Forstl. Versuchswes. Ber. 270, 1984, pp. 41–51.
[52] Van den Driessche R., Influence of moisture supply, temperature
and light on frost-hardiness changes in Douglas-fir seedlings, Can.
J. Bot. 47 (1969) 1765–1772.
[53] Waring R.H., Franklin J.F., Evergreen coniferous forests of the
Pacific Northwest, Science, 204 (1979) 1380–1386.
[54] Weiser C.J., Cold resistance and injury in woody plants, Science,
169 (1970) 1269–1277.
[55] Wilkinson L., Hill M., Welna J.P., Birkenbeuel G.K., Systat
®
for
windows (Version 5.0): Statistics, SPSS, Inc., Chicago, 1992.
To access this journal online:
www.edpsciences.org