POWER QUALITY phần 6 potx
Bạn đang xem bản rút gọn của tài liệu. Xem và tải ngay bản đầy đủ của tài liệu tại đây (3.46 MB, 20 trang )
© 2002 by CRC Press LLC
4.8.1 TRANSFORMERS
Harmonics can affect transformers primarily in two ways. Voltage harmonics pro-
duce additional losses in the transformer core as the higher frequency harmonic
voltages set up hysteresis loops, which superimpose on the fundamental loop. Each
loop represents higher magnetization power requirements and higher core losses. A
second and a more serious effect of harmonics is due to harmonic frequency currents
in the transformer windings. The harmonic currents increase the net RMS current
flowing in the transformer windings which results in additional I
2
R losses. Winding
eddy current losses are also increased. Winding eddy currents are circulating currents
induced in the conductors by the leakage magnetic flux. Eddy current concentrations
are higher at the ends of the windings due to the crowding effect of the leakage
magnetic field at the coil extremities. The winding eddy current losses increase as
the square of the harmonic current and the square of the frequency of the current.
Thus, the eddy loss (EC) is proportional to I
h
2
× h
2
, where I
h
is the RMS value of
the harmonic current of order h, and h is the harmonic frequency order or number.
Eddy currents due to harmonics can significantly increase the transformer winding
temperature. Transformers that are required to supply large nonlinear loads must be
derated to handle the harmonics. This derating factor is based on the percentage of
the harmonic currents in the load and the rated winding eddy current losses.
One method by which transformers may be rated for suitability to handle har-
monic loads is by k factor ratings. The k factor is equal to the sum of the square of
the harmonic frequency currents (expressed as a ratio of the total RMS current)
multiplied by the square of the harmonic frequency numbers:
(4.25)
where
I
1
is the ratio between the fundamental current and the total RMS current.
I
2
is the ratio between the second harmonic current and the total RMS current.
I
3
is the ratio between the third harmonic current and the total RMS current.
Equation (4.25) can be rewritten as:
(4.26)
Example: Determine the k rating of a transformer required to carry a load
consisting of 500 A of fundamental, 200 A of third harmonics, 120 A of fifth
harmonics, and 90 A of seventh harmonics:
Total RMS current (I) = = 559 A
I
1
= 500/559 = 0.894
kI
1
2
1()
2
I
2
2
2()
2
I
3
2
3()
2
I
4
2
4()
2
… I
n
2
n()
2
+++++=
k Σ I
n
2
h
2
h = 123… n,,, ,()=
500
2
200
2
120
2
90
2
+++()
© 2002 by CRC Press LLC
I
3
= 200/559 = 0.358
I
5
= 120/559 = 0.215
I
7
= 90/559 = 0.161
k = (0.894)
2
1
2
+ (0.358)
2
3
2
+ (0.215)
2
5
2
+ (0.161)
2
7
2
= 4.378
The transformer specified should be capable of handling 559 A of total RMS current
with a k factor of not less than 4.378. Typically, transformers are marked with k
ratings of 4, 9, 13, 20, 30, 40, and 50, so a transformer with a k rating of 9 should
be chosen. Such a transformer would have the capability to carry the full RMS load
current and handle winding eddy current losses equal to k times the normal rated
eddy current losses.
The k factor concept is derived from the ANSI/IEEE C57.110 standard, Recom-
mended Practices for Establishing Transformer Capability When Supplying Non-
Sinusoidal Load Currents, which provides the following expression for derating a
transformer when supplying harmonic loads:
I max.(pu) = [P
LL–R(pu)
/1 + (Σf
h
2
h
2
/Σf
h
2
)P
EC–R(pu)
]
1/2
(4.27)
where
I max.(pu) = ratio of the maximum nonlinear current of a specified harmonic
makeup that the transformer can handle to the transformer rated current.
P
LL–R(pu)
= load loss density under rated conditions (per unit of rated load I
2
R
loss density.
P
EC–R(pu)
= winding eddy current loss under rated conditions (per unit of rated
I
2
R loss).
f
h
= harmonic current distribution factor for harmonic h (equal to harmonic h
current divided by the fundamental frequency current for any given load
level).
h = harmonic number or order.
As difficult as this formula might seem, the underlying principle is to account for
the increased winding eddy current losses due to the harmonics. The following
example might help clarify the IEEE expression for derating a transformer.
Example: A transformer with a full load current rating of 1000 A is subjected
to a load with the following nonlinear characteristics. The transformer has a rated
winding eddy current loss density of 10.0% (0.10 pu). Find the transformer
derating factor.
Harmonic number (h) f
h
(pu)
11
3 0.35
5 0.17
7 0.09
© 2002 by CRC Press LLC
Maximum load loss density, P
LL–R(pu)
= 1 + 0.1 = 1.1
Maximum rated eddy current loss density, P
EC–R(pu)
= 0.1
Σf
h
2
h
2
= 1
2
+ (0.35)
2
3
2
+ (0.17)
2
5
2
+ (0.09)
2
7
2
= 3.22
Σf
h
2
= 1
2
+ 0.35
2
+ 0.17
2
+ 0.09
2
= 1.16
I max.(pu) = [1.1/1 + (3.22 × 0.1/1.16)]
1/2
= 0.928
The transformer derating factor is 0.928; that is, the maximum nonlinear current of
the specified harmonic makeup that the transformer can handle is 928 A.
The ANSI/IEEE derating method is very useful when it is necessary to calculate
the allowable maximum currents when the harmonic makeup of the load is known.
For example, the load harmonic conditions might change on an existing transformer
depending on the characteristics of new or replacement equipment. In such cases,
the transformer may require derating. Also, transformers that supply large third
harmonic generating loads should have the neutrals oversized. This is because, as
we saw earlier, the third harmonic currents of the three phases are in phase and
therefore tend to add in the neutral circuit. In theory, the neutral current can be as
high as 173% of the phase currents. Transformers for such applications should have
a neutral bus that is twice as large as the phase bus.
4.8.2 AC MOTORS
Application of distorted voltage to a motor results in additional losses in the magnetic
core of the motor. Hysteresis and eddy current losses in the core increase as higher
frequency harmonic voltages are impressed on the motor windings. Hysteresis losses
increase with frequency and eddy current losses increase as the square of the
frequency. Also, harmonic currents produce additional I
2
R losses in the motor wind-
ings which must be accounted for.
Another effect, and perhaps a more serious one, is torsional oscillations due to
harmonics. Table 4.1 classified harmonics into one of three categories. Two of the
more prominent harmonics found in a typical power system are the fifth and seventh
harmonics. The fifth harmonic is a negative sequence harmonic, and the resulting
magnetic field revolves in a direction opposite to that of the fundamental field at a
speed five times the fundamental. The seventh harmonic is a positive sequence
harmonic with a resulting magnetic field revolving in the same direction as the
fundamental field at a speed seven times the fundamental. The net effect is a magnetic
field that revolves at a relative speed of six times the speed of the rotor. This induces
currents in the rotor bars at a frequency of six times the fundamental frequency. The
resulting interaction between the magnetic fields and the rotor-induced currents
produces torsional oscillations of the motor shaft. If the frequency of the oscillation
coincides with the natural frequency of the motor rotating members, severe damage
to the motor can result. Excessive vibration and noise in a motor operating in a
harmonic environment should be investigated to prevent failures.
© 2002 by CRC Press LLC
Motors intended for operation in a severe harmonic environment must be spe-
cially designed for the application. Motor manufacturers provide motors for opera-
tion with ASD units. If the harmonic levels become excessive, filters may be applied
at the motor terminals to keep the harmonic currents from the motor windings. Large
motors supplied from ASDs are usually provided with harmonic filters to prevent
motor damage due to harmonics.
4.8.3 CAPACITOR BANKS
Capacitor banks are commonly found in commercial and industrial power systems
to correct for low power factor conditions. Capacitor banks are designed to operate
at a maximum voltage of 110% of their rated voltages and at 135% of their rated
kVARS. When large levels of voltage and current harmonics are present, the ratings
are quite often exceeded, resulting in failures. Because the reactance of a capacitor
bank is inversely proportional to frequency, harmonic currents can find their way
into a capacitor bank. The capacitor bank acts as a sink, absorbing stray harmonic
currents and causing overloads and subsequent failure of the bank.
A more serious condition with potential for substantial damage occurs due to a
phenomenon called harmonic resonance. Resonance conditions are created when
the inductive and capacitive reactances become equal at one of the harmonic fre-
quencies. The two types of resonances are series and parallel. In general, series
resonance produces voltage amplification and parallel resonance results in current
multiplication. Resonance will not be analyzed in this book, but many textbooks on
electrical circuit theory are available that can be consulted for further explanation.
In a harmonic-rich environment, both series and parallel resonance may be present.
If a high level of harmonic voltage or current corresponding to the resonance
frequency exists in a power system, considerable damage to the capacitor bank as
well as other power system devices can result. The following example might help
to illustrate power system resonance due to capacitor banks.
Example: Figure 4.17 shows a 2000-kVA, 13.8-kV to 480/277-V transformer
with a leakage reactance of 6.0% feeding a bus containing two 500-hp adjustable
speed drives. A 750-kVAR Y-connected capacitor bank is installed on the 480-V bus
for power factor correction. Perform an analysis to determine the conditions for
resonance (consult Figure 4.18 for the transformer and capacitor connections and
their respective voltages and currents):
Transformer secondary current (I) = 2000 × 10
3
/ = 2406 A
Transformer secondary volts = (V) = 277
Transformer reactance = I × X
L
× 100/V = 6.0
Transformer leakage reactance (X
L
) = 0.06 × 277/2406 = 0.0069 Ω
X
L
= 2πfL, where L = 0.0069/377 = 0.183 × 10
–4
H
3 480×
© 2002 by CRC Press LLC
FIGURE 4.17 Schematic representation of an adjustable speed drive and a capacitor bank
supplied from a 2000-kVA power transformer.
FIGURE 4.18 Transformer and capacitor bank configuration.
2000 KVA, 13.8 KV-480/277
6% REACTANCE
TRANSFORMER
750 KVAR
CAPACITOR BANK
500 HP, ASD500 HP, ASD
IH
C
13.8 KV SOURCE
480 V
277 VOLTS
2406 A
480 VOLTS
277 VOLTS
902 A
TRANSFORMER CAPACITOR BANK
L=0.0000183 H
C=0.0086 F
© 2002 by CRC Press LLC
For the capacitor bank,
× I
C
= 750 × 10
3
, where I
C
= 902 A
Capacitive reactance (X
C
) = V/I
C
= 277/902 = 0.307 Ω
X
C
= 1/2πfC, where C = 1/(377 × 0.307) = 86 × 10
–4
F
For resonance, X
L
= X
C
; therefore,
2πf
R
L = 1/2πf
R
C
where f
R
is the resonance frequency
f
R
= 1/2π ≅ 401 Hz
The resonance frequency is 401 Hz or the 6.7th (401/60) harmonic frequency. The
resonance frequency is close to the seventh harmonic frequency, which is one of the
more common harmonic frequency components found in power systems. This con-
dition can have very serious effects.
The following expression presents a different way to find the harmonic resonance
frequency:
Resonance frequency order = R
n
= (4.28)
where MVA
SC
is the available symmetrical fault MVA at the point of connection of
the capacitor in the power system, and MVAR
C
is the rating of the capacitor bank
in MVAR. In the above example, neglecting the source impedance, the available fault
current = 2406 ÷ 0.06 ≅ 40,100 A.
Available fault MVA = = 33.34
Capacitor MVAR = 0.75
Therefore, the resonance frequency number = = 6.67, and the har-
monic frequency = 6.67 × 60 = 400.2. This proves that similar results are obtained
by using Eq. (4.28). The expression in Eq. (4.28) is derived as follows: The available
three-phase fault current at the common bus is given by I
SC
= V ÷ X, where V is the
phase voltage in kilovolts and X is the total reactance of the power system at the
bus. I
SC
is in units of kiloamperes.
I
SC
= V ÷ 2πf
1
L, where f
1
is the fundamental frequency
Short circuit MVA = MVA
SC
= 3 × V × I
SC
= 3V
2
÷ 2πf
1
L
3 480×
LC
MV A
SC
÷ MVAR
C
()
3 480× 40 100 10
6–
×,×
33.34 ÷ 0.75
© 2002 by CRC Press LLC
From this,
L = 3V
2
÷ 2πf
1
(MVA
SC
)
At resonance,
X
LR
= 2πf
R
L = 3V
2
f
R
÷ f
1
(MVA
SC
)
Because f
R
÷ f
1
= resonance frequency order, R
n
, then
X
LR
= 3V
2
R
n
÷ (MVA
SC
)
For the capacitor bank, I
C
= V ÷ X
C
, and capacitor reactive power MVAR
C
=
3 × V × I
C
= 3V
2
(2πf
1
C). We can derive an expression for the capacitive reactance
at resonance X
CR
= 3V
2
÷ R
n
(MVAR
C
). Equating X
LR
and X
CR
, the harmonic order at
resonance is the expression given by Eq. (4.28).
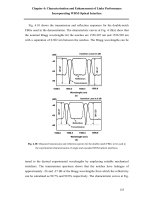
The capacitor bank and the transformer form a parallel resonant circuit with the
seventh harmonic current from the ASDs acting as the harmonic source. This con-
dition is represented in Figure 4.19. Two adjustable speed drives typically draw a
current of 550 A each, for a total load of 1100 A. If the seventh harmonic current
is 5.0% of the fundamental (which is typical in drive applications), the seventh
harmonic current seen by the parallel resonant circuit is 55 A = I
7
.
If the resistance of the transformer and the associated cable, bus, etc. is 1.0%,
then R ≅ 0.0012 Ω.
The quality factor, Q, of an electrical system is a measure of the energy stored
in the inductance and the capacitance of the system. The current amplification factor
(CAF) of a parallel resonance circuit is approximately equal to the Q of the circuit:
Q = 2π(maximum energy stored)/ energy dissipated per cycle
Q = (2π)(1/2)LI
m
2
÷ (I
2
R)/f, where I
m
=
Q = X/R
FIGURE 4.19 Parallel resonance circuit formed by transformer inductance and capacitor
bank capacitance at harmonic frequency f
H
.
2I
I
(CAF)I
H
H
C
L
I
H=HARMONIC CURRENT FROM ASD(S)
© 2002 by CRC Press LLC
For the seventh harmonic frequency, CAF = X
7
/R = 7 × 0.0069/0.0012 = 40.25.
Therefore, current I
R
= 40.25 × 55 = 2214 A. The net current through the capacitor
bank = = 2390 A. It is easy to see that the capacitor bank is severely
overloaded. If the capacitor protective device does not operate to isolate the bank,
the capacitor bank will be damaged.
In the above example, by changing the capacitor bank to a 500-kVAR unit, the
resonance frequency is increased to 490 Hz, or the 8.2 harmonic. This frequency is
potentially less troublesome. (The reader is encouraged to work out the calculations.)
In addition, the transformer and the capacitor bank may also form a series resonance
circuit as viewed from the power source. This condition can cause a large voltage
rise on the 480-V bus with unwanted results. Prior to installing a capacitor bank, it
is important to perform a harmonic analysis to ensure that resonance frequencies do
not coincide with any of the characteristic harmonic frequencies of the power system.
4.8.4 CABLES
Current flowing in a cable produces I
2
R losses. When the load current contains
harmonic content, additional losses are introduced. To compound the problem, the
effective resistance of the cable increases with frequency because of the phenomenon
known as skin effect. Skin effect is due to unequal flux linkage across the cross
section of the conductor which causes AC currents to flow only on the outer periphery
of the conductor. This has the effect of increasing the resistance of the conductor
for AC currents. The higher the frequency of the current, the greater the tendency
of the current to crowd at the outer periphery of the conductor and the greater the
effective resistance for that frequency.
The capacity of a cable to carry nonlinear loads may be determined as follows.
The skin effect factor is calculated first. The skin effect factor depends on the skin
depth, which is an indicator of the penetration of the current in a conductor. Skin
depth (δ) is inversely proportional to the square root of the frequency:
δ = S ÷
where S is a proportionality constant based on the physical characteristics of the
cable and its magnetic permeability and f is the frequency of the current.
If R
dc
is the DC resistance of the cable, then the AC resistance at frequency f,
(R
f
) = K × R
dc
. The value of K is determined from Table 4.9 according to the value
of X, which is calculated as:
X = 0.0636 (4.29)
where 0.0636 is a constant for copper conductors, f is the frequency, µ is the magnetic
permeability of the conductor material, and R
dc
is the DC resistance per mile of the
conductor. The magnetic permeability of a nonmagnetic material such as copper is
approximately equal to 1.0. Tables or graphs containing values of X and K are
available from cable manufacturers.
I
C
2
I
R
2
+()
f
fµ ÷ R
dc
© 2002 by CRC Press LLC
Example: Find the 60-Hz and 420-Hz resistance of a 4/0 copper cable with a
DC resistance of 0.276 Ω per mile. Using Eq. (4.29),
X
60
= 0.0636 = 0.938
From Table 4.2, K ≅ 1.004, and R
60
= 1.004 × 0.276 = 0.277 Ω per mile. Also,
X
420
= 0.0636 = 2.48
From Table 4.2, K ≅ 1.154, and R
420
= 1.154 × 0.276 = 0.319 Ω per mile.
The ratio of the resistance of the cable at a given frequency to its resistance at
60 Hz is defined as the skin effect ratio, E. According to this definition,
E
2
= resistance at second harmonic frequency ÷ resistance at the fundamental
frequency = R
120
÷ R
60
E
3
= resistance at third harmonic frequency ÷ resistance at the fundamental
frequency = R
180
÷ R
60
Also, remember that the general form expression for the individual harmonic
distortions states that I
n
is equal to the RMS value of the nth harmonic current
divided by the RMS value of the fundamental current, thus an expression for the
current rating factor for cables can be formulated. The current rating factor (q) is
the equivalent fundamental frequency current at which the cable should be rated for
carrying nonlinear loads containing harmonic frequency components:
(4.30)
TABLE 4.9
Cable Skin Effect Factor
XKXKXK
0 1 1.4 1.01969 2.7 1.22753
0.1 1 1.5 1.02558 2.8 1.2662
0.2 1 1.6 1.03323 2.9 1.28644
0.3 1.00004 1.7 1.04205 3.0 1.31809
0.5 1.00032 1.8 1.0524 3.1 1.35102
0.6 1.00067 1.9 1.0644 3.1 1.38504
0.7 1.00124 2.0 1.07816 3.3 1.41999
0.8 1.00212 2.1 1.09375 3.4 1.4577
0.9 1.0034 2.1 1.11126 3.5 1.49202
1.0 1.00519 2.3 1.13069 3.6 1.52879
1.1 1.00758 2.4 1.15207 3.7 1.56587
1.2 1.01071 2.5 1.17538 3.8 1.60312
1.3 1.0147 2.6 1.20056 3.9 1.64051
60 1 ÷ 0.276×()
420 1÷ 0.276×()
qI
1
2
E
1
I
2
2
E
2
I
3
2
E
3
… I
n
2
E
n
++++=
© 2002 by CRC Press LLC
where I
1
, I
2
, I
3
are the ratios of the harmonic frequency currents to the fundamental
current, and E
1
, E
2
, E
3
are the skin effect ratios.
Example: Determine the current rating factor for a 300-kcmil copper conductor
required to carry a nonlinear load with the following harmonic frequency content:
Fundamental = 250 A
3rd harmonic = 25 A
5th harmonic = 60 A
7th harmonic = 45 A
11th harmonic = 20 A
The DC resistance of 300-kcmil cable = 0.17 Ω per mile. Using Eq. (4.29),
X
60
= 0.0636 = 1.195, K ≅ 1.0106
X
180
= 0.0636 = 2.069, K ≅ 1.089
X
300
= 0.0636 = 2.672, K ≅ 1.220
X
420
= 0.0636 = 3.161, K ≅ 1.372
X
660
= 0,0636 = 3.963, K ≅ 1.664
R
60
= 1.0106 × 0.17 = 0.1718 Ω/mile
R
180
= 1.089 × 0.17 = 0.1851 Ω/mile
R
300
= 1.220 × 0.17 = 0.2074 Ω/mile
R
420
= 1.372 × 0.17 = 0.2332 Ω/mile
R
660
= 1.664 × 0.17 = 0.2829 Ω/mile
Skin effect ratios are:
E
1
= 1, E
3
= 1.077, E
5
= 1.207, E
7
= 1.357, E
11
= 1.647
The individual harmonic distortion factors are:
I
1
= 1.0, I
3
= 25/250 = 0.1, I
5
= 60/250 = 0.24, I
7
= 0.18, I
11
= 20/250 = 0.08
The current rating factor from Eq. (4.30) is given by:
q = 1 + (0.1)
2
(1.077) + (0.24)
2
(1.207) + (0.18)
2
(1.357) + (0.08)
2
(1.647) = 1.135
60 1 ÷ 0.17×()
180 1 ÷ 0.17×()
300 1 ÷ 0.17×()
420 1 ÷ 0.17×()
660 1 ÷ 0.17×()
© 2002 by CRC Press LLC
The cable should be capable of handling a 60-Hz equivalent current of 1.135 × 250
≅ 284 A.
4.8.5 BUSWAYS
Most commercial multistory installations contain busways that serve as the primary
source of electrical power to various floors. Busways that incorporate sandwiched
busbars are susceptible to nonlinear loading, especially if the neutral bus carries
large levels of triplen harmonic currents (third, ninth, etc.). Under the worst possible
conditions, the neutral bus may be forced to carry a current equal to 173% of the
phase currents. In cases where substantial neutral currents are expected, the busways
must be suitably derated. Table 4.10 indicates the amount of nonlinear loads that
may be allowed to flow in the phase busbars for different neutral currents. The data
are shown for busways with neutral busbars that are 100 and 200% in size.
4.8.6 PROTECTIVE DEVICES
Harmonic currents influence the operation of protective devices. Fuses and motor
thermal overload devices are prone to nuisance operation when subjected to nonlin-
ear currents. This factor should be given due consideration when sizing protective
devices for use in a harmonic environment. Electromechanical relays are also
affected by harmonics. Depending on the design, an electromechanical relay may
operate faster or slower than the expected times for operation at the fundamental
frequency alone. Such factors should be carefully considered prior to placing the
relays in service.
TABLE 4.10
Bus Duct Derating Factor
for Harmonic Loading
I
N
/I
∅H
I
∅H
/I
∅
100% N 200% N
0 1.000 1.000
0.25 0.99 0.995
0.50 0.961 0.98
0.75 0.918 0.956
1.00 0.866 0.926
1.25 0.811 0.891
1.50 0.756 0.853
1.75 0.703 0.814
2.00 0.655 0.775
Note: I
N
is the neutral current, I
∅H
is the harmonic
current component in each phase, and I
∅
is the
total phase current. N = size of neutral bus bar in
relation to phase bus bar.
© 2002 by CRC Press LLC
4.9 GUIDELINES FOR HARMONIC VOLTAGE AND
CURRENT LIMITATION
So far we have discussed the adverse effects of harmonics on power system opera-
tion. It is important, therefore, that attempts be made to limit the harmonic distortion
that a facility might produce. There are two reasons for this. First, the lower the
harmonic currents produced in an electrical system, the better the equipment within
the confinement of the system will perform. Also, lower harmonic currents produce
less of an impact on other power users sharing the same power lines of the harmonic
generating power system. The IEEE 519 standard provides guidelines for harmonic
current limits at the point of common coupling (PCC) between the facility and the
utility. The rationale behind the use of the PCC as the reference location is simple.
It is a given fact that within a particular power use environment, harmonic currents
will be generated and propagated. Harmonic current injection at the PCC determines
how one facility might affect other power users and the utility that supplies the
power. Table 4.11 (per IEEE 519) lists harmonic current limits based on the size of
the power user. As the ratio between the maximum available short circuit current at
the PCC and the maximum demand load current increases, the percentage of the
harmonic currents that are allowed also increases. This means that larger power
users are allowed to inject into the system only a minimal amount of harmonic
current (as a percentage of the fundamental current). Such a scheme tends to equalize
the amounts of harmonic currents that large and small users of power are allowed
to inject into the power system at the PCC.
IEEE 519 also provides guidelines for maximum voltage distortion at the PCC
(see Table 4.12). Limiting the voltage distortion at the PCC is the concern of the
utility. It can be expected that as long as a facility’s harmonic current contribution
is within the IEEE 519 limits the voltage distortion at the PCC will also be within
the specified limits.
TABLE 4.11
Harmonic Current Limits for General Distribution Systems (120–69,000 V)
I
SC
/I
L
h < 11 11 ≤ h < 17 17 ≤ h < 23 23 ≤ h < 35 35 ≤ h THD
<20 4.0 2.0 1.5 0.6 0.3 5.0
20–50 7.0 3.5 2.5 1.0 0.5 8.0
50–100 10.0 4.5 4.0 1.5 0.7 12.0
100–1000 12.0 5.5 5.0 2.0 1.0 15.0
>1000 15.0 7.0 6.0 2.5 1.4 20.0
Note: I
SC
= maximum short-circuit current at PCC; I
L
= maximum fundamental frequency demand
load current at PCC (average current of the maximum demand for the preceding 12 months); h =
individual harmonic order; THD = total harmonic distortion. based on the maximum demand load
current. The table applies to odd harmonics; even harmonics are limited to 25% of the odd harmonic
limits shown above.
© 2002 by CRC Press LLC
When the IEEE 519 harmonic limits are used as guidelines within a facility, the
PCC is the common junction between the harmonic generating loads and other
electrical equipment in the power system. It is expected that applying IEEE guide-
lines renders power system operation more reliable. In the future, more and more
utilities might require facilities to limit their harmonic current injection to levels
stipulated by IEEE 519. The following section contains information on how har-
monic mitigation might be achieved.
4.10 HARMONIC CURRENT MITIGATION
4.10.1 E
QUIPMENT DESIGN
The use of electronic power devices is steadily increasing. It is estimated that more
than 70% of the loading of a facility by year 2010 will be due to nonlinear loads,
thus demand is increasing for product manufacturers to produce devices that generate
lower distortion. The importance of equipment design in minimizing harmonic
current production has taken on greater importance, as reflected by technological
improvements in fluorescent lamp ballasts, adjustable speed drives, battery chargers,
and uninterruptible power source (UPS) units. Computers and similar data-process-
ing devices contain switching mode power supplies that generate a substantial
amount of harmonic currents, as seen earlier. Designing power supplies for electronic
equipment adds considerably to the cost of the units and can also make the equipment
heavier. At this time, when computer prices are extremely competitive, attempts to
engineer power supplies that draw low harmonic currents are not a priority.
Adjustable speed drive (ASD) technology is evolving steadily, with greater
emphasis being placed on a reduction in harmonic currents. Older generation ASDs
using current source inverter (CSI) and voltage source inverter (VSI) technologies
produced considerable harmonic frequency currents. The significant harmonic fre-
quency currents generated in power conversion equipment can be stated as:
n = kq ± 1
where n is the significant harmonic frequency, k is any positive integer (1, 2, 3, etc.),
and q is the pulse number of the power conversion equipment which is the number
TABLE 4.12
Voltage Harmonic Distortion Limits
Bus Voltage at PCC
Individual Voltage
Distortion (%)
Total Voltage
Distortion THD (%)
69 kV and below 3.0 5.0
69.001 kV through 161 kV 1.5 2.5
161.001 kV and above 1.0 1.5
Note: PCC = point of common coupling; THD = total harmonic distortion.
© 2002 by CRC Press LLC
of power pulses that are in one complete sequence of power conversion. For example,
a three-phase full wave bridge rectifier has six power pulses and therefore has a
pulse number of 6. With six-pulse-power conversion equipment, the following sig-
nificant harmonics may be generated:
For k =1, n = (1 × 6) ± 1 = 5th and 7th harmonics.
For k =2, n = (2 × 6) ± 1 = 11th and 13th harmonics.
With six-pulse-power conversion equipment, harmonics below the 5th harmonic are
insignificant. Also, as the harmonic number increases, the individual harmonic
distortions become lower due to increasing impedance presented to higher frequency
components by the power system inductive reactance. So, typically, for six-pulse-
power conversion equipment, the 5th harmonic current would be the highest, the
7th would be lower than the 5th, the 11th would be lower than the 7th, and so on,
as shown below:
I
13
< I
11
< I
7
< I
5
We can deduce that, when using 12-pulse-power conversion equipment, harmon-
ics below the 11th harmonic can be made insignificant. The total harmonic distortion
is also considerably reduced. Twelve-pulse-power conversion equipment costs more
than six-pulse-power equipment. Where harmonic currents are the primary concern,
24-pulse-power conversion equipment may be considered.
4.10.2 HARMONIC CURRENT CANCELLATION
Transformer connections employing phase shift are sometimes used to effect can-
cellation of harmonic currents in a power system. Triplen harmonic (3rd, 9th, 15th,
etc.) currents are a set of currents that can be effectively trapped using a special
transformer configuration called the zigzag connection. In power systems, triplen
harmonics add in the neutral circuit, as these currents are in phase. Using a zigzag
connection, the triplens can be effectively kept away from the source. Figure 4.20
illustrates how this is accomplished.
The transformer phase-shifting principle is also used to achieve cancellation of
the 5th and the 7th harmonic currents. Using a ∆–∆ and a ∆–Y transformer to supply
harmonic producing loads in parallel as shown in Figure 4.21, the 5th and the 7th
harmonics are canceled at the point of common connection. This is due to the 30˚
phase shift between the two transformer connections. As the result of this, the source
does not see any significant amount of the 5th and 7th harmonics. If the nonlinear
loads supplied by the two transformers are identical, then maximum harmonic
current cancellation takes place; otherwise, some 5th and 7th harmonic currents
would still be present. Other phase-shifting methods may be used to cancel higher
harmonics if they are found to be a problem. Some transformer manufacturers offer
multiple phase-shifting connections in a single package which saves cost and space
compared to using individual transformers.
© 2002 by CRC Press LLC
FIGURE 4.20 Zig-zag transformer application as third harmonic filter.
FIGURE 4.21 Cancellation of fifth and seventh harmonic currents by using 30° phase-shifted
transformer connections.
A
B
C
N
SOURCE
LOAD
I
3
III
333
333
MM
5TH AND 7TH
HARMONICS
FLOW IN THE
BRANCHES
5TH AND 7TH HARMONICS
CANCEL OUT AT THE COMMON BUS
© 2002 by CRC Press LLC
4.10.3 HARMONIC FILTERS
Nonlinear loads produce harmonic currents that can travel to other locations in the
power system and eventually back to the source. As we saw earlier, harmonic currents
can produce a variety of effects that are harmful to the power system. Harmonic
currents are a result of the characteristics of particular loads. As long as we choose
to employ those loads, we must deal with the reality that harmonic currents will
exist to a degree dependent upon the loads. One means of ensuring that harmonic
currents produced by a nonlinear current source will not unduly interfere with the
rest of the power system is to filter out the harmonics. Application of harmonic
filters helps to accomplish this.
Harmonic filters are broadly classified into passive and active filters. Passive
filters, as the name implies, use passive components such as resistors, inductors, and
capacitors. A combination of passive components is tuned to the harmonic frequency
that is to be filtered. Figure 4.22 is a typical series-tuned filter. Here the values of
the inductor and the capacitor are chosen to present a low impedance to the harmonic
frequency that is to be filtered out. Due to the lower impedance of the filter in
comparison to the impedance of the source, the harmonic frequency current will
circulate between the load and the filter. This keeps the harmonic current of the
desired frequency away from the source and other loads in the power system. If
other harmonic frequencies are to be filtered out, additional tuned filters are applied
in parallel. Applications such as arc furnaces require multiple harmonic filters, as
they generate large quantities of harmonic currents at several frequencies.
Applying harmonic filters requires careful consideration. Series-tuned filters
appear to be of low impedance to harmonic currents but they also form a parallel
resonance circuit with the source impedance. In some instances, a situation can be
created that is worse than the condition being corrected. It is imperative that computer
simulations of the entire power system be performed prior to applying harmonic
filters. As a first step in the computer simulation, the power system is modeled to
indicate the locations of the harmonic sources, then hypothetical harmonic filters
are placed in the model and the response of the power system to the filter is examined.
If unacceptable results are obtained, the location and values of the filter parameters
are changed until the results are satisfactory. When applying harmonic filters, the
units are almost never tuned to the exact harmonic frequency. For example, the 5th
harmonic frequency may be designed for resonance at the 4.7th harmonic frequency.
FIGURE 4.22 Series-tuned filter and filter frequency response.
L
C
HARMONIC
CURRENT
SOURCE
POWER
SOURCE
Z(S)
Z
FREQUENCY
Z
f
R
I H
© 2002 by CRC Press LLC
By not creating a resonance circuit at precisely the 5th harmonic frequency, we can
minimize the possibility of the filter resonating with other loads or the source, thus
forming a parallel resonance circuit at the 5th harmonic. The 4.7th harmonic filter
would still be effective in filtering out the 5th harmonic currents. This is evident
from the series-tuned frequency vs. impedance curve shown in Figure 4.22.
Sometimes, tuned filters are configured to provide power factor correction for
a facility as well as harmonic current filtering. In such cases the filter would be
designed to carry the resonant harmonic frequency current and also the normal
frequency current at the fundamental frequency. In either case, a power system
harmonic study is paramount to ensure that no ill effects would be produced by the
application of the power factor correction/filter circuit.
Active filters use active conditioning to compensate for harmonic currents in a
power system. Figure 4.23 shows an active filter applied in a harmonic environment.
The filter samples the distorted current and, using power electronic switching
devices, draws a current from the source of such magnitude, frequency composition,
and phase shift to cancel the harmonics in the load. The result is that the current
drawn from the source is free of harmonics. An advantage of active filters over
passive filters is that the active filters can respond to changing load and harmonic
conditions, whereas passive filters are fixed in their harmonic response. As we saw
earlier, application of passive filters requires careful analysis. Active filters have no
serious ill effects associated with them. However, active filters are expensive and
not suited for application in small facilities.
4.11 CONCLUSIONS
The term harmonics is becoming very common in power systems, small, medium,
or large. As the use of power electronic devices grows, so will the need to understand
the effects of harmonics and the application of mitigation methods. Fortunately,
FIGURE 4.23 Active filter to cancel harmonic currents.
M
ACTIVE
FILTER
COMPUTER
LOADS
ASD
POWER SOURCE
I(LOAD)I(SOURCE)
I(COMP)
© 2002 by CRC Press LLC
harmonics in a strict sense are not transient phenomena. Their presence can be easily
measured and identified. In some cases, harmonics can be lived with indefinitely,
but in other cases they should be minimized or eliminated. Either of these approaches
requires a clear understanding of the theory behind harmonics.
© 2002 by CRC Press LLC
5
Grounding and Bonding
5.1 INTRODUCTION
What do the terms
grounding
and
bonding
mean? Quite often the terms are mistak-
enly used interchangeably. To reinforce understanding of the two concepts, the
definitions given in Chapter 1 are repeated here:
Grounding
is a conducting connec-
tion by which an electrical circuit or equipment is connected to earth or to some
conducting body of relatively large extent that serves in place of earth.
Bonding
is
intentional electrical interconnecting of conductive paths in order to ensure common
electrical potential between the bonded parts.
The primary purpose of grounding and bonding is electrical safety, but does
safety
cover personal protection or equipment protection, or both? Most people
would equate electrical safety with personal protection (and rightfully so), but
equipment protection may be viewed as an extension of personal protection. An
electrical device grounded so that it totally eliminates shock hazards but could still
conceivably start a fire is not a total personal protective system. This is why even
though personal safety is the prime concern, equipment protection is also worthy of
consideration when configuring a grounding system methodology.
With the advent of the electronic age, grounding and bonding have taken on the
additional roles of serving as reference planes for low-level analog or digital signals.
Two microelectronic devices that communicate with each other and interpret data
require a common reference point from which to operate. The ground plane for such
devices should provide a low-impedance reference plane for the devices, and any
electrical noise induced or propagated to the ground plane should have very minimal
impact on the devices. So far we have identified three reasons for grounding and
bonding. One point that cannot be stressed enough is that nothing that we do to
grounding and bonding should compromise personal safety. It is not uncommon to
see modifications to the grounding of an electrical system for the sole purpose of
making equipment function properly at the expense of safety. Such actions contradict
the real reason for grounding a system in the first place.
5.2 SHOCK AND FIRE HAZARDS
Grounding and bonding of electrical devices and systems are vital to ensuring that
people living or working in the environment will be adequately protected. We will
start by looking into why personal safety is dependent on grounding and bonding.
Table 5.1 is a list of physiological hazards associated with passage of electrical
current through an average human body. It is obvious that it does not take much
current to cause injury and even death. The resistance of an average human under
conditions when the skin is dry is about 100 k
Ω
or higher. When the skin is wet,
© 2002 by CRC Press LLC
the resistance drops to 10 k
Ω
or lower. It is not difficult to see how susceptible
humans are to shock hazard.
Figures 5.1a and 5.1b illustrate what would happen if a person came in contact
with the frame of an electric motor where, due to insulation deterioration, a 480-V
phase is in contact with the frame. Figure 5.1a is the condition of the frame being
bonded to the service ground terminal, which in turn is connected to the building
ground electrode. If the power source feeding the motor is a grounded source, this
condition in all likelihood would cause the overcurrent protection (such as the fuse
or circuit breaker) to operate and open the circuit to the motor. If the power source
feeding the motor is an ungrounded source (such as a
∆
-connected transformer), no
overcurrent protection is likely to operate; however, the phase that is contacting the
frame will be brought to the ground potential and the person touching the frame is
not in danger of receiving an electric shock.
TABLE 5.1
Effect of Current Flow Through Human Body
Current Level Shock Hazard
100
µ
A Threshold of perception
1–5 mA Sensation of pain
5–10 mA Increased pain
10–20 mA Intense pain; unable to release grip
30 mA Breathing affected
40–60 mA Feeling of asphyxiation
75 mA Ventricular fibrilation, irregular heartbeat
FIGURE 5.1
(a) Current flow when motor frame is grounded. (b) Current flow when motor
frame is ungrounded.
R
R
SOURCE
SOURCE
FAULT FAULT
(a) (b)
CURRENT PATH
WITH MOTOR
GROUNDED
CURRENT PATH
WITH MOTOR
UNGROUNDED