POWER QUALITY phần 5 pps
Bạn đang xem bản rút gọn của tài liệu. Xem và tải ngay bản đầy đủ của tài liệu tại đây (3.45 MB, 20 trang )
© 2002 by CRC Press LLC
frequency of
f
, the second harmonic has a frequency of 2
×
f
, the third harmonic
has a frequency of 3
×
f
,
and
the
n
th harmonic has a frequency of
n
×
f
. If the
fundamental frequency is 60 Hz (as in the U.S.), the second harmonic frequency is
120 Hz, and the third harmonic frequency is 180 Hz.
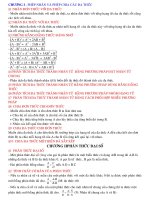
The significance of harmonic frequencies can be seen in Figure 4.3. The second
harmonic undergoes two complete cycles during one cycle of the fundamental fre-
quency, and the third harmonic traverses three complete cycles during one cycle of
the fundamental frequency.
V
1
,
V
2
, and
V
3
are the peak values of the harmonic
components that comprise the composite waveform, which also has a frequency of
f
.
FIGURE 4.1
Sinusoidal voltage and current functions of time (
t
). Lagging functions are
indicated by negative phase angle and leading functions by positive phase angle.
FIGURE 4.2
Nonsinusoidal voltage waveform Fourier series. The Fourier series allows
expression of nonsinusoidal periodic waveforms in terms of sinusoidal harmonic frequency
components.
v(t)=Vsin(wt)
w = Angular velocity
= 2
f
T
Period T = 1/f
= 2
w
current lags voltage
V
I
i(t)=Isin(wt-
)
v(t)
t
© 2002 by CRC Press LLC
The ability to express a nonsinusoidal waveform as a sum of sinusoidal waves allows
us to use the more common mathematical expressions and formulas to solve power
system problems. In order to find the effect of a nonsinusoidal voltage or current on
a piece of equipment, we only need to determine the effect of the individual harmonics
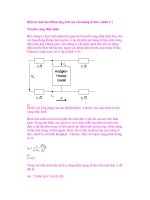
and then vectorially sum the results to derive the net effect. Figure 4.4 illustrates how
individual harmonics that are sinusoidal can be added to form a nonsinusoidal wave-
form.
The Fourier expression in Eq. (4.3) has been simplified to clarify the concept
behind harmonic frequency components in a nonlinear periodic function. For the
purist, the following more precise expression is offered. For a periodic voltage wave
with fundamental frequency of
ω
= 2
π
f
,
v
(
t
) =
V
0
+
∑
(
a
k
cos
k
ω
t
+
b
k
sin
k
ω
t
) (for
k
= 1 to
∞
) (4.4)
FIGURE 4.3
Fundamental, second, and third harmonics.
V1
V2
V3
FUNDAMENTAL
SECOND HARMONIC
THIRD HARMONIC
1 CYCLE
1 CYCLE
1CYCLE
V1 sin wt
V2 sin 2wt
V3 sin 3wt
© 2002 by CRC Press LLC
where
a
k
and
b
k
are the coefficients of the individual harmonic terms or components.
Under certain conditions, the cosine or sine terms can vanish, giving us a simpler
expression. If the function is an even function, meaning
f
(–
t
) =
f
(
t
), then the sine
terms vanish from the expression. If the function is odd, with
f
(–
t
) = –
f
(
t
), then
the cosine terms disappear. For our analysis, we will use the simplified expression
involving sine terms only. It should be noted that having both sine and cosine
terms affects only the displacement angle of the harmonic components and the
shape of the nonlinear wave and does not alter the principle behind application of
the Fourier series.
The coefficients of the harmonic terms of a function
f
(
t
) contained in Eq. (4.4)
are determined by:
a
k
=
f
(
t
).cos
kt
.
dt
, (
k
= 1,2,3, …,
n
) (4.5)
b
k
=
f
(
t
).sin
kt
.
dt
, (
k
= 1,2,3, …,
n
) (4.6)
The coefficients represent the peak values of the individual harmonic frequency terms
of the nonlinear periodic function represented by
f
(
t
). It is not the intent of this book
to explore the intricacies of the Fourier series. Several books in mathematics are
available for the reader who wants to develop a deeper understanding of this very
essential tool for solving power quality problems related to harmonics.
FIGURE 4.4
Creation of nonlinear waveform by adding the fundamental and third harmonic
frequency waveforms.
FUNDAMENTAL
THIRD HARMONIC
FUNDAMENTAL + THIRD
HARMONIC
1
π
–π
+π
∫
1
π
–π
+π
∫
© 2002 by CRC Press LLC
4.2 HARMONIC NUMBER (
h
)
Harmonic number
(
h
) refers to the individual frequency elements that comprise a
composite waveform. For example,
h
= 5 refers to the fifth harmonic component
with a frequency equal to five times the fundamental frequency. If the fundamental
frequency is 60 Hz, then the fifth harmonic frequency is 5
×
60, or 300 Hz. The
harmonic number 6 is a component with a frequency of 360 Hz. Dealing with
harmonic numbers and not with harmonic frequencies is done for two reasons. The
fundamental frequency varies among individual countries and applications. The
fundamental frequency in the U.S. is 60 Hz, whereas in Europe and many Asian
countries it is 50 Hz. Also, some applications use frequencies other than 50 or
60 Hz; for example, 400 Hz is a common frequency in the aerospace industry, while
some AC systems for electric traction use 25 Hz as the frequency. The inverter part
of an AC adjustable speed drive can operate at any frequency between zero and its
full rated maximum frequency, and the fundamental frequency then becomes the
frequency at which the motor is operating. The use of harmonic numbers allows us
to simplify how we express harmonics. The second reason for using harmonic
numbers is the simplification realized in performing mathematical operations involv-
ing harmonics.
4.3 ODD AND EVEN ORDER HARMONICS
As their names imply, odd harmonics have odd numbers (e.g., 3, 5, 7, 9, 11), and
even harmonics have even numbers (e.g., 2, 4, 6, 8, 10). Harmonic number 1 is
assigned to the fundamental frequency component of the periodic wave. Harmonic
number 0 represents the constant or DC component of the waveform. The DC
component is the net difference between the positive and negative halves of one
complete waveform cycle. Figure 4.5 shows a periodic waveform with net DC
content. The DC component of a waveform has undesirable effects, particularly on
transformers, due to the phenomenon of core saturation. Saturation of the core is
caused by operating the core at magnetic field levels above the knee of the magne-
tization curve. Transformers are designed to operate below the knee portion of the
curve. When DC voltages or currents are applied to the transformer winding, large
DC magnetic fields are set up in the transformer core. The sum of the AC and the
DC magnetic fields can shift the transformer operation into regions past the knee of
the saturation curve. Operation in the saturation region places large excitation power
requirements on the power system. The transformer losses are substantially
increased, causing excessive temperature rise. Core vibration becomes more pro-
nounced as a result of operation in the saturation region.
We usually look at harmonics as integers, but some applications produce har-
monic voltages and currents that are not integers. Electric arc furnaces are examples
of loads that generate non-integer harmonics. Arc welders can also generate non-
integer harmonics. In both cases, once the arc stabilizes, the non-integer harmonics
mostly disappear, leaving only the integer harmonics.
The majority of nonlinear loads produce harmonics that are odd multiples of
the fundamental frequency. Certain conditions need to exist for production of even
© 2002 by CRC Press LLC
harmonics. Uneven current draw between the positive and negative halves of one
cycle of operation can generate even harmonics. The uneven operation may be due
to the nature of the application or could indicate problems with the load circuitry.
Transformer magnetizing currents contain appreciable levels of even harmonic com-
ponents and so do arc furnaces during startup.
Subharmonics have frequencies below the fundamental frequency and are rare
in power systems. When subharmonics are present, the underlying cause is resonance
between the harmonic currents or voltages with the power system capacitance and
inductance. Subharmonics may be generated when a system is highly inductive (such
as an arc furnace during startup) or if the power system also contains large capacitor
banks for power factor correction or filtering. Such conditions produce slow oscil-
lations that are relatively undamped, resulting in voltage sags and light flicker.
4.4 HARMONIC PHASE ROTATION AND PHASE
ANGLE RELATIONSHIP
So far we have treated harmonics as stand-alone entities working to produce wave-
form distortion in AC voltages and currents. This approach is valid if we are looking
at single-phase voltages or currents; however, in a three-phase power system, the
harmonics of one phase have a rotational and phase angle relationship with the
FIGURE 4.5 Current waveform with DC component (scale, 1 A = 200 A). This waveform
has a net negative DC component as indicated by the larger area of the negative half compared
to the positive half of each cycle.
© 2002 by CRC Press LLC
harmonics of the other phases. In power system studies involving harmonics, this
relationship is important.
In a balanced three-phase electrical system, the voltages and currents have a
positional relationship as shown in Figure 4.6. The three voltages are 120˚ apart and
so are the three currents. The normal phase rotation or sequence is a–b–c, which is
counterclockwise and designated as the positive-phase sequence in this book. For
harmonic analyses, these relationships are still applicable, but the fundamental
components of voltages and currents are used as reference. All other harmonics use
the fundamental frequency as the reference. The fundamental frequencies have a
positive-phase sequence. The angle between the fundamental voltage and the fun-
damental current is the displacement power factor angle, as defined in Chapter 1.
So how do the harmonics fit into this space–time picture? For a clearer
understanding, let us look only at the current harmonic phasors. We can further
simplify the picture by limiting the discussion to odd harmonics only, which
under normal and balanced conditions are the most prevalent. The following
relationships are true for the fundamental frequency current components in a
three-phase power system:
i
a1
= I
a1
sin ωt (4.7)
i
b1
= I
b1
sin (ωt-120°) (4.8)
i
c1
= I
c1
sin (ωt-240°) (4.9)
FIGURE 4.6 Balanced three-phase power system. Phase sequence refers to the order in which
phasors move past a reference axis. The positive phase sequence is assigned a counterclock-
wise rotation.
REFERENCE AXIS
Va
Ia
Ic
Ib
Vc
Vb
COUNTERCLOCKWISE
PHASE SEQUENCE
120 DEG.
© 2002 by CRC Press LLC
The negative displacement angles indicate that the fundamental phasors i
b1
and i
c1
trail the i
a1
phasor by the indicated angle. Figure 4.7a shows the fundamental
current phasors.
The expressions for the third harmonic currents are:
i
a3
= I
a3
sin 3ωt (4.10)
i
b3
= I
b3
sin 3(ωt-120°) = I
b3
sin (3ωt-360°) = I
b3
sin 3ωt (4.11)
i
c3
= I
c3
sin 3(ωt-240°) = I
c3
sin (3ωt-720°) = I
c3
sin 3ωt (4.12)
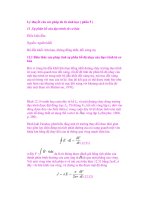
The expressions for the third harmonics show that they are in phase and have zero
displacement angle between them. Figure 4.7b shows the third harmonic phasors.
The third harmonic currents are known as zero sequence harmonics due to the zero
displacement angle between the three phasors.
FIGURE 4.7 (a) Fundamental phasors. (b) Third harmonic phasors. (c) Fifth harmonic pha-
sors. (d) Seventh harmonic phasors.
Ia1
Ib1
Ic1
POSITIVE PHASE SEQUENCE
I a3, I b3, I c3
I
I
I
a5
b5
c5
NEGATIVE PHASE SEQUENCE
I
I
I
a7
c7
b7
POSITIVE PHASE SEQUENCE
ZERO PHASE SEQUENCE
(a) (c)
(b) (d)
© 2002 by CRC Press LLC
The expressions for the fifth harmonic currents are:
i
a5
= I
a5
sin 5ωt (4.13)
i
b5
= I
b5
sin 5(ωt-120°) = I
b5
sin(5ωt-600°) = I
b5
sin(5ωt-240°) (4.14)
i
c5
= I
c5
sin 5(ωt-240°) = I
c5
sin(5ωt-1200°) = I
c5
sin(5ωt-120°) (4.15)
Figure 4.7c shows the fifth harmonic phasors. Note that the phase sequence of the
fifth harmonic currents is clockwise and opposite to that of the fundamental. The
fifth harmonics are negative sequence harmonics.
Similarly the expressions for the seventh harmonic currents are:
i
a7
= I
a7
sin 7ωt (4.16)
i
b7
= I
b7
sin 7(ωt-120°) = I
b7
sin(7ωt-840°) = I
b7
sin(7ωt-120°) (4.17)
i
c7
= I
c7
sin 7(ωt-240°) = I
c7
sin(7ωt-1680°) = I
c7
sin(7ωt-240°) (4.18)
Figure 4.7d shows the seventh har-
monic current phasors. The seventh
harmonics have the same phase
sequence as the fundamental and
are positive sequence harmonics.
So far, we have not included even
harmonics in the discussion; doing
so is left to the reader as an exer-
cise. Table 4.1 categorizes the har-
monics in terms of their respective
sequence orders.
The expressions shown so far for harmonics have zero phase shifts with respect
to the fundamental. It is not uncommon for the harmonics to have a phase-angle
shift with respect to the fundamental. Figure 4.8 depicts a fifth harmonic current
waveform with and without phase shift from the fundamental. Expressions for the
fifth harmonics with a phase-shift angle of θ degrees are:
i
a5
= I
a5
sin 5(ωt-θ) (4.19)
i
b5
= I
b5
sin 5(ωt-120°-θ) (4.20)
i
c5
= I
c5
sin 5(ωt-240°-θ) (4.21)
While the phase-shift angle has the effect of altering the shape of the composite
waveform, the phase sequence order of the harmonics is not affected.
TABLE 4.1
Harmonic Order vs. Phase Sequence
Harmonic Order Sequence
1, 4, 7, 10, 13, 16, 19 Positive
2, 5, 8, 11, 14, 17, 20 Negative
3, 6, 9, 12, 15, 18, 21 Zero
© 2002 by CRC Press LLC
4.5 CAUSES OF VOLTAGE AND CURRENT
HARMONICS
A pure sinusoidal waveform with zero harmonic distortion is a hypothetical quantity
and not a practical one. The voltage waveform, even at the point of generation,
contains a small amount of distortion due to nonuniformity in the excitation magnetic
field and discrete spatial distribution of coils around the generator stator slots. The
distortion at the point of generation is usually very low, typically less than 1.0%.
The generated voltage is transmitted many hundreds of miles, transformed to several
levels, and ultimately distributed to the power user. The user equipment generates
currents that are rich in harmonic frequency components, especially in large com-
mercial or industrial installations. As harmonic currents travel to the power source,
the current distortion results in additional voltage distortion due to impedance volt-
ages associated with the various power distribution equipment, such as transmission
and distribution lines, transformers, cables, buses, and so on. Figure 4.9 illustrates
how current distortion is transformed into voltage distortion. Not all voltage distor-
tion, however, is due to the flow of distorted current through the power system
impedance. For instance, static uninterruptible power source (UPS) systems can
FIGURE 4.8 Nonsymmetry of the waveform with respect to a vertical reference plane intro-
duced by a displacement of harmonics. Periodicity is still maintained.
0
FUNDAMENTAL WAVE
5TH HARMONIC WAVE
FUNDAMENTAL WAVE
5TH HARMONIC WAVE
WITH ZERO DISPLACEMENT
WITH 0 DEG. DISPLACEMENT
© 2002 by CRC Press LLC
generate appreciable voltage distortion due to the nature of their operation. Normal
AC voltage is converted to DC and then reconverted to AC in the inverter section
of the UPS. Unless waveform shaping circuitry is provided, the voltage waveforms
generated in UPS units tend to be distorted.
As nonlinear loads are propagated into the power system, voltage distortions are
introduced which become greater moving from the source to the load because of
the circuit impedances. Current distortions for the most part are caused by loads.
Even loads that are linear will generate nonlinear currents if the supply voltage
waveform is significantly distorted. When several power users share a common
power line, the voltage distortion produced by harmonic current injection of one
user can affect the other users. This is why standards are being issued that will limit
the amount of harmonic currents that individual power users can feed into the source
(an issue that we will examine later in this chapter). The major causes of current
distortion are nonlinear loads due to adjustable speed drives, fluorescent lighting,
rectifier banks, computer and data-processing loads, arc furnaces, and so on. One
can easily visualize an environment where a wide spectrum of harmonic frequencies
are generated and transmitted to other loads or other power users, thereby producing
undesirable results throughout the system.
4.6 INDIVIDUAL AND TOTAL HARMONIC
DISTORTION
Individual harmonic distortion (IHD) is the ratio between the root mean square
(RMS) value of the individual harmonic and the RMS value of the fundamental
IHD
n
= I
n
/I
1
(4.22)
FIGURE 4.9 Voltage distortion due to current distortion. The gradient graph indicates how
distortion changes from source to load.
Ih
HARMONIC
CURRENT
ZT
SOURCE
VOLTAGE DISTORTION
LOW
VOLTAGE DISTORTION
HIGH
ZZ(SOURCE) (LOAD)
GENERATOR
SOURCE
LOAD
VOLTAGE DISTORTION GRADIENT
© 2002 by CRC Press LLC
For example, assume that the RMS value of the third harmonic current in a
nonlinear load is 20 A, the RMS value of the fifth harmonic current is 15 A, and
the RMS value of the fundamental is 60 A. Then, the individual third harmonic
distortion is:
IHD
3
= 20/60 = 0.333, or 33.3%
and the individual fifth harmonic distortion is:
IHD
5
= 15/60 = 0.25, or 25.0%
Under this definition, the value of IHD
1
is always 100%. This method of quantifying
the harmonics is known as harmonic distortion based on the fundamental. This is
the convention used by the Institute of Electrical and Electronic Engineers (IEEE)
in the U.S. The European International Electrotechnical Commission (IEC) quanti-
fies harmonics based on the total RMS value of the waveform. Using the same
example shown above, the RMS value of the waveform is:
I
rms
= = 65 A
Based on the IEC convention,
IHD
1
= 60/65 = 0.923, or 92.3%
IHD
3
= 20/65 = 0.308, or 30.8%
IHD
5
= 15/65 = 0.231, or 23.1%
The examples illustrate that even though the magnitudes of the harmonic currents
are the same, the distortion percentages are different because of a change in the
definition. It should be pointed out that it really does not matter what convention is
used as long as the same one is maintained throughout the harmonic analysis. In
this book, the IEEE convention will be followed, and all harmonic distortion calcu-
lations will be based on the fundamental.
Total harmonic distortion (THD) is a term used to describe the net deviation of
a nonlinear waveform from ideal sine waveform characteristics. Total harmonic
distortion is the ratio between the RMS value of the harmonics and the RMS value
of the fundamental. For example, if a nonlinear current has a fundamental component
of I
1
and harmonic components of I
2
, I
3
, I
4
, I
5
, I
6
, I
7
, …, then the RMS value of the
harmonics is:
I
H
= (4.23)
THD = (I
H
/I
1
) × 100% (4.24)
60
2
20
2
15
2
++()
I
2
2
I
3
2
I
4
2
I
5
2
I
6
2
I
7
2
…++++++()
© 2002 by CRC Press LLC
Example: Find the total harmonic distortion of a voltage waveform with the
following harmonic frequency make up:
Fundamental = V
1
= 114 V
3rd harmonic = V
3
= 4 V
5th harmonic = V
5
= 2 V
7th harmonic = V
7
= 1.5 V
9th harmonic = V
9
= 1 V
This problem can be solved in two ways:
RMS value of the harmonics = V
H
= = 4.82 V
THD = (4.82/114) × 100 ≅ 4.23%
or find the individual harmonic distortions:
IHD
3
= 4/114 = 3.51%
IHD
5
= 2/114 = 1.75%
IHD
7
= 1.5/114 = 1.32%
IHD
9
= 1/114 = 0.88%
By definition, IHD
1
= 100%, so
THD = ≅ 4.23%
The results are not altered by using either the magnitude of the RMS quantities or
the individual harmonic distortion values.
The individual harmonic distortion indicates the contribution of each harmonic
frequency to the distorted waveform, and the total harmonic distortion describes the
net deviation due to all the harmonics. These are both important parameters. In order
to solve harmonic problems, we require information on the composition of the
individual distortions so that any treatment may be tailored to suit the problem. The
total harmonic distortion, while conveying no information on the harmonic makeup,
is used to describe the degree of pollution of the power system as far as harmonics
are concerned. Defining the individual and total harmonic distortions will be helpful
as we look at some typical nonlinear waveforms and their harmonic frequency
characteristics.
4
2
2
2
1.5
2
1
2
++ +()
IHD
3
2
IHD
5
2
IHD
7
2
IHD
9
2
+++()
© 2002 by CRC Press LLC
4.7 HARMONIC SIGNATURES
Many of the loads installed in present-day power systems are harmonic current
generators. Combined with the impedance of the electrical system, the loads also
produce harmonic voltages. The nonlinear loads may therefore be viewed as both
harmonic current generators and harmonic voltage generators. Prior to the 1970s,
speed control of AC motors was primarily achieved using belts and pulleys. Now,
adjustable speed drives (ASDs) perform speed control functions very efficiently.
ASDs are generators of large harmonic currents. Fluorescent lights use less electrical
energy for the same light output as incandescent lighting but produce substantial
harmonic currents in the process. The explosion of personal computer use has
resulted in harmonic current proliferation in commercial buildings. This section is
devoted to describing, in no particular order, a few of the more common nonlinear
loads that surround us in our everyday life.
4.7.1 FLUORESCENT LIGHTING
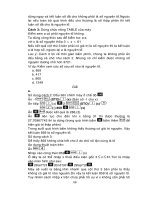
Figure 4.10 shows a current waveform at a distribution panel supplying exclusively
fluorescent lights. The waveform is primarily comprised of the third and the fifth
harmonic frequencies. The individual current harmonic distortion makeup is pro-
vided in Table 4.2. The waveform also contains slight traces of even harmonics,
especially of the higher frequency order. The current waveform is flat topped due
to initiation of arc within the gas tube, which causes the voltage across the tube and
the current to become essentially unchanged for a portion of each half of a cycle.
4.7.2 ADJUSTABLE SPEED DRIVES
While several technologies exist for creating a variable voltage and variable fre-
quency power source for the speed control of AC motors, the pulse-width modulation
(PWM) drive technology is currently the most widely used. Figures 4.11 and 4.12
show current graphs at the ASD input lines with a motor operating at 60 and 45 Hz,
respectively. Tables 4.3 and 4.4 show the harmonic current distortion spectrum for
the two respective frequencies. The characteristic double hump for each half cycle
of the AC waveform is due to conduction of the input rectifier modules for a duration
of two 60˚ periods for each half cycle. As the operating frequency is reduced, the
humps become pronounced with a large increase in the total harmonic distortion.
The THD of 74.2% for 45-Hz operation is excessive and can produce many delete-
rious effects, as will be shown in later sections of this chapter.
Figure 4.13 is the waveform of the voltage at the ASD input power lines. It was
stated earlier that large current distortions can produce significant voltage distortions.
In this particular case, the voltage THD is 8.3%, which is higher than levels typically
found in most industrial installations. High levels of voltage THD also produce
unwanted results. Table 4.5 provides the voltage harmonic distortion distribution.
Figure 4.14 is the current waveform of an ASD of smaller horsepower. This
drive contains line side inductors which, along with the higher inductance of the
motor, produce a current waveform with less distortion. Table 4.6 provides the
harmonic frequency distribution for this ASD.
© 2002 by CRC Press LLC
FIGURE 4.10 Nonlinear current drawn by fluorescent lighting.
TABLE 4.2
Harmonic Number h(n) vs. Individual Harmonic
Distortion (IHD) for a Fluorescent Lighting Load
Harmonic Distortion Spectrum
h(n) IHD (%) h(n) IHD (%) h(n) IHD (%)
0 — 11 2.2 22 0.6
1 100 12 0.3 23 0.6
2 0.3 13 1.7 24 0.7
3 13.9 14 0.3 25 1.4
4 0.3 15 1.9 26 1.1
5 9 16 0.3 27 0.3
6 0.2 17 0.8 28 0.9
7 3.3 18 0.5 29 1.5
8 0 19 1.4 30 1
9 3.2 20 0.4 31 0.3
10 0.1 21 1.2
Note: Total harmonic distortion = 18.0%.
© 2002 by CRC Press LLC
FIGURE 4.11 Adjustable speed drive input current with motor operating at 60 Hz.
FIGURE 4.12 Adjustable speed drive input current with motor operating at 45 Hz.
© 2002 by CRC Press LLC
TABLE 4.3
Harmonic Number h(n) vs. Individual Harmonic
Distortion for an Adjustable Speed Drive Input Current
with Motor Running at 60 Hz
Harmonic Distortion Spectrum
h(n) IHD (%) h(n) IHD (%) h(n) IHD (%)
0 0.15 11 9.99 22 0.39
1 100 12 0.03 23 2.95
2 4.12 13 0.19 24 0.02
3 0.78 14 0.48 25 0.66
4 1.79 15 0.07 26 0.15
5 35.01 16 0.52 27 0.05
6 0.215 17 4.85 28 0.22
7 2.62 18 0.03 29 1.79
8 1 19 0.67 30 0.03
9 0.06 20 0.31 31 0.64
10 0.73 21 0.04
Note: Total harmonic distortion = 37.3%.
TABLE 4.4
Harmonic Number h(n) vs. Individual Harmonic
Distortion for an Adjustable Speed Drive Input Current
with Motor Running at 45 Hz
Harmonic Distortion Spectrum
h(n) IHD (%) h(n) IHD (%) h(n) IHD (%)
0 2.23 11 6.36 22 0.16
1 100 12 0.03 23 3.75
2 4.56 13 9.99 24 0.12
3 2.44 14 0.11 25 1.73
4 3.29 15 0.62 26 0.42
5 62.9 16 0.35 27 0.33
6 1.4 17 5.22 28 0.22
7 36.1 18 0.35 29 1.68
8 0.43 19 1.96 30 0.26
9 0.73 20 0.64 31 1.36
10 0.58 21 0.22
Note: Total harmonic distortion = 74.2%.
© 2002 by CRC Press LLC
FIGURE 4.13 Adjustable speed drive input voltage with motor operating at 60 Hz.
TABLE 4.5
Harmonic Number h(n) vs. Individual Harmonic
Distortion for an Adjustable Speed Drive Input Voltage
with Motor Running at 60 Hz
Harmonic Distortion Spectrum
h(n) IHD (%) h(n) IHD (%) h(n) IHD (%)
0 0.02 11 1.87 22 0.07
1 100 12 0.02 23 0.46
2 0.12 13 0.92 24 0.04
3 0.09 14 0.07 25 0.36
4 0.11 15 0.01 26 0.06
5 7.82 16 0.04 27 0.03
6 0.01 17 0.61 28 0.07
7 1.42 18 0.06 29 0.4
8 0.06 19 0.36 30 0.02
9 0.04 20 0.06 31 0.34
10 0.03 21 0.12
Note: Total harmonic distortion = 8.3%.
© 2002 by CRC Press LLC
FIGURE 4.14 Adjustable speed drive input current for a smaller motor operating at 50 Hz
(ASD with input line inductors).
TABLE 4.6
Harmonic Number h(n) vs. Individual Harmonic
Distortion for an Adjustable Speed Drive Input Voltage
with Line Inductor and Motor Running at 50 Hz
Harmonic Distortion Spectrum
h(n) IHD (%) h(n) IHD (%) h(n) IHD (%)
0 1.27 11 0.93 22 0.43
1 100 12 0.44 23 0.42
2 1.76 13 1.01 24 0.29
3 35.5 14 0.35 25 0.51
4 1.91 15 0.96 26 0.24
5 3.83 16 0.53 27 0.58
6 1.62 17 0.23 28 0.15
7 3.42 18 0.64 29 0.2
8 0.93 19 0.82 30 0.13
9 3.22 20 0.44 31 0.21
10 0.54 21 0.75
Note: Total harmonic distortion = 36.3%.
© 2002 by CRC Press LLC
4.7.3 PERSONAL COMPUTER AND MONITOR
Figures 4.15 and 4.16 show the nonlinear current characteristics of a personal
computer and a computer monitor, respectively. Tables 4.7 and 4.8 provide the
harmonic content of the currents for the two devices. The predominance of the third
and fifth harmonics is evident. The current THD for both devices exceeds 100%, as
the result of high levels of individual distortions introduced by the third and fifth
harmonics. The total current drawn by a personal computer and its monitor is less
than 2 A, but a typical high-rise building can contain several hundred computers
and monitors. The net effect of this on the total current harmonic distortion of a
facility is not difficult to visualize.
So far we have examined some of the more common harmonic current genera-
tors. The examples illustrate that a wide spectrum of harmonic currents is generated.
Depending on the size of the power source and the harmonic current makeup, the
composite harmonic picture will be different from facility to facility.
4.8 EFFECT OF HARMONICS ON POWER SYSTEM
DEVICES
We are interested in the subject of harmonics because of the harmful effects they
have on power system devices. What makes harmonics so insidious is that very often
FIGURE 4.15 Nonlinear current drawn by single personal computer.
FIGURE 4.16 Nonlinear current drawn by single computer video monitor.
© 2002 by CRC Press LLC
the effects of harmonics are not known until failure occurs. Insight into how har-
monics can interact within a power system and how they can affect power system
components is important for preventing failures. In this section, we will look at the
effect of harmonics on some common power system devices.
TABLE 4.7
Harmonic Number h(n) vs. Individual Harmonic
Distortion for a Personal Computer
Harmonic Distortion Spectrum
h(n) IHD (%) h(n) IHD (%) h(n) IHD (%)
0 12.8 11 10.3 22 2.1
1 100 12 1.2 23 0
2 3.3 13 10.3 24 0
3 87.2 14 0 25 0
4 5.1 15 10.3 26 0
5 64.1 16 0 27 0
6 1.6 17 5.1 28 0
7 41.1 18 0 29 0
8 0 19 2.4 30 0
9 17.9 20 0 31 0
10 1.1 21 2.1
Note: Total harmonic distortion = 118.3%.
TABLE 4.8
Harmonic Frequency h(n) vs. Individual Harmonic
Distortion for Computer Monitor Current
Harmonic Distortion Spectrum
h(n) IHD (%) h(n) IHD (%) h(n) IHD (%)
0 0 11 10 22 0
1 100 12 2.5 23 5
2 5 13 10 24 0
3 90 14 2.5 25 0
4 5 15 10 26 0
5 62.5 16 0 27 0
6 5 17 2.5 28 0
7 32.5 18 0 29 0
80190300
9 12.5 20 0 31 0
10 2.5 21 5
Note: Total harmonic distortion = 116.3%.