Báo cáo khoa học: "Immunohistochemical identification and quantitative analysis of cytoplasmic Cu/Zn superoxide dismutase in mouse organogenesis" ppsx
Bạn đang xem bản rút gọn của tài liệu. Xem và tải ngay bản đầy đủ của tài liệu tại đây (9.93 MB, 8 trang )
JOURNAL OF
Veterinary
Science
J. Vet. Sci. (2008), 9(3), 233
240
*Corresponding author
Tel: +82-43-261-2596; Fax: +82-43-271-3246
E-mail:
Immunohistochemical identification and quantitative analysis of
cytoplasmic Cu/Zn superoxide dismutase in mouse organogenesis
Jung-Min Yon
1
, In-Jeoung Baek
1
, Se-Ra Lee
2
, Mi-Ra Kim
1
, Beom Jun Lee
1
, Young Won Yun
1
, Sang-Yoon
Nam
1,
*
1
College of Veterinary Medicine and Research Institute of Veterinary Medicine, Chungbuk National University, Cheongju
361-763, Korea
2
CKD Research Institute, Chong Kun Dang Pharm., Chonan P.O. Box 74, Chonan 330-600, Korea
Cytoplasmic Cu/Zn superoxide dismutase (SOD1) is an
antioxidant enzyme that converts superoxide to hydrogen
peroxide in cells. Its spatial distribution matches that of
superoxide production, allowing it to protect cells from
oxidative stress. SOD1 deficiencies result in embryonic
lethality and a wide range of pathologies in mice, but little
is known about normal SOD1 protein expression in
developing embryos. In this study, the expression pattern
of SOD1 was investigated in post-implantation mouse
embryos and extraembryonic tissues, including placenta,
using Western blotting and immunohistochemical analyses.
SOD1 was detected in embryos and extraembryonic tissues
from embryonic day (ED) 8.5 to 18.5. The signal in
embryos was observed at the lowest level on ED 9.5-11.5,
and the highest level on ED 17.5-18.5, while levels remained
constant in the surrounding extraembryonic tissues during all
developmental stages examined. Immunohistochemical analysis
of SOD1 expression on ED 13.5-18.5 revealed its ubiquitous
distribution throughout developing organs. In particular,
high levels of SOD1 expression were observed in the
ependymal epithelium of the choroid plexus, ganglia,
sensory cells of the olfactory and vestibulocochlear epithelia,
blood cells and vessels, hepatocytes and hematopoietic
cells of the liver, lymph nodes, osteogenic tissues, and skin.
Thus, SOD1 is highly expressed at late stages of embryonic
development in a cell- and tissue-specific manner, and
can function as an important antioxidant enzyme during
organogenesis in mouse embryos.
Keywords:
antioxidant enzyme, extraembryonic tissue, mouse
embryos, superoxide dismutase
Introduction
In mammalian tissues, reactive oxygen species (ROS),
such as superoxide radicals (O
2-
), hydroxyl radicals (OH
-
)
and hydrogen peroxide (H
2
O
2
), are continuously generated
during aerobic metabolism. ROS modulate multiple
cellular processes, including proliferation, differentiation,
and signaling. However, excessive generation of ROS can
cause detrimental changes, such as lipid peroxidation,
DNA breakage, protein degradation, and enzyme
inactivation [6,26].
The superoxide dismutase (SOD) family is a ubiquitously
distributed group of enzymes that efficiently catalyze the
dismutation of O
2-
[15]. The cytoplasmic Cu/Zn SOD
(SOD1) is located in multiple intracellular compartments
including the cytosol, nucleus, lysosome, and mitochondrial
intermembrane space [4,20], while the manganese SOD
(SOD2) is only located in mitochondria [28].
Mice lacking SOD1 develop a range of pathologies,
including hepatocellular carcinoma, cochlear hair cell loss,
vascular dysfunction, anemia, acceleration of age-related
loss of muscle mass, an earlier incidence of cataracts, and
a reduced lifespan [7,8,13,16,17,23]. Pregnant female
mice lacking SOD1 experienced an increased incidence of
lethality in their embryos [11]. Co-treatment with SOD
alleviated the teratogenicity of a broad range of embryonic
cytotoxic agents, including ethanol and hyperglycemia
[3,29]. SOD1 mRNA was detected in all embryos at
embryonic day (ED) 7.5-18.5 and was expressed in a cell-
and tissue-specific manner in developing organs [30]. In
this study, we investigated the expression patterns of
SOD1 protein during embryonic development, using
Western blotting and immunohistochemical analysis, to
better understand the function of SOD1 in embryogenesis.
234 Jung-Min Yon et al.
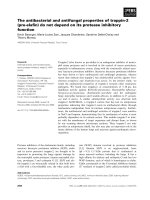
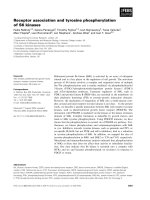
Fig. 1. Relative expression levels of SOD1 protein in developing embryos (A) and extraembryonic tissues (B). Total protein was
extracted from mouse embryos and extraembryonic tissues on embryonic day (ED) 8.5 to 18.5, and Western blotting was performed
using an anti-SOD1 antibody. β-actin was used as an internal standard.
Materials and Methods
Experimental animals
Male and female ICR mice (8 to 10 weeks old) were
purchased from a commercial breeder, Biogenomics
(Korea). All animals were housed in polycarbonate cages
and acclimatized for 1 wk. The environmental conditions
were controlled, with an ambient temperature of 21 ± 2
o
C,
relative humidity of 55% ± 10%, air ventilation rate of 10
cycles per h, and a 12:12 h light:dark cycle. The animals
were fed a standard mouse chow (Samyang, Korea) and tap
water ad libitum throughout the experimental period. All
experiments were approved and performed according to
the “Guide for Care and Use of Animals” (Chungbuk
National University Animal Care Committee, Korea).
Preparation of embryos and extraembryonic tissues
One male and two female mice were housed in cages for
mating. Successful mating was confirmed by the presence
of a copulation plug in the vagina. The day on which the
vaginal plug was observed was designated ED 0.5.
Pregnant mice were sacrificed under pentobarbital anesthesia
on ED 8.5-18.5, and embryos and extraembryonic tissues,
including the placenta, were dissected.
Protein extraction and Western blotting analysis
Total protein was extracted from mouse embryos and
extraembryonic tissues taken on ED 8.5-18.5. Tissue
samples were homogenized in lysis buffer (50 mM
HEPES, 150 mM NaCl, 1 mM EDTA, 10% glycerol, 1%
Triton X-100, 1 mM phenylmethylsulfonyl fluoride, 1
μg/ml aprotinin, 0.5 mM sodium orthovanadate, and 20
mM sodium pyrophosphate). The lysates were clarified by
centrifugation at 14,000 rpm for 10 min and incubated at 95
o
C
in loading buffer (0.125 M Tris-HCl (pH 6.8), 4% SDS,
20% glycerol, 10% 2-mercaptoethanol, and 0.002%
bromophenol blue) for 5 min before electrophoresis.
Aliquots containing 60 μg of total protein were separated
by SDS-PAGE (using 10% polyacrylamide gels) and
transferred to nitrocellulose membranes (Immobilon;
Millipore, USA). The membranes were blocked with 5%
non-fat milk in Tris-buffered saline [TBS; 25 mM Tris (pH
7.4), 200 mM NaCl] for 1 h at room temperature to
eliminate nonspecific binding, and were then incubated
with the primary antibodies (diluted 1:1,000 in 5% non-fat
milk in TBST), polyclonal rabbit anti-SOD1 (Stressgen,
Canada) and polyclonal rabbit anti-β-actin (Cell Signaling,
USA). Next, membranes were incubated with a horseradish
peroxidase-conjugated secondary antibody (1:1,000; Cell
Signaling, USA) for 1 h at room temperature, visualized
using a Western Lightning Chemiluminescence reagent
(Perkin-Elmer Life Sciences, USA) according to the
manufacturer's protocol, and photographed (Gel Doc EQ;
Bio-Rad, USA). Immunoreactive bands were quantified
and normalized using PDQuest Image software (Bio-Rad,
USA). Experiments were performed in triplicate, and data
are presented as mean ± SD.
Immunohistochemistry
For immunohistochemical analysis, mouse embryos
obtained on ED 13.5-18.5 were fixed in Bouin solution.
Tissue sections were deparaffinized with xylene and
rehydrated through an ethanol gradient. Endogenous
peroxidase activity was quenched by 0.3% hydrogen
Localization and level of SOD1 in developing mouse embryos 235
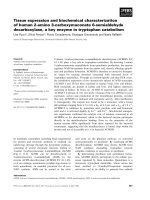
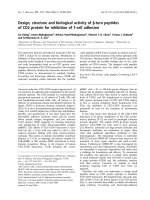
Fig. 2. Immunohistochemistry using a SOD1 antibody on sagittal sections of developing mouse embryos. (A) Embryonic day (ED) 17.5
cerebral cortex (outer layer; asterisk) (×100). (B) ED 17.5 pyramidal cells of cerebral cortex (×400). (C) ED 17.5 cerebellum (×100).
(D) ED 17.5 choroid plexus (×100). (E) ED 15.5 Rathke’s pouch (×400). (F) ED 17.5 Rathke’s pouch (×100). (G) ED 15.5 spinal
ganglion (×400). (H) ED 16.5 inner ear in bony labyrinth (×40). (I) ED 16.5 sensory epithelium of inner ear (×400). (J) ED 17.5 nasal
cavity (×100), Bowman’s glands (arrow). (K) ED 17.5 olfactory epithelium (×400). (L) ED 18.5 eye (×40), iris (arrow) and pigmen
t
layer (arrowhead) of retina. (M) ED 16.5 lung (×40). (N) ED 16.5 lung (×200), terminal bronchial epithelia of lung (asterisk). (O) ED
17.5 heart (×100). (P) ED 13.5 blood cells (×400). (Q) ED 17.5 blood vessel (×200; asterisk). (R) ED 16.5 stomach (×200). (S) ED 16.
5
goblet cell (arrow) and Paneth cell (arrowhead) of intestine (×400). (T) ED 17.5 intestine (×100).
peroxide in methanol for 15 min, and then sections were
washed 4 times in PBS, for 5 min each time. Nonspecific
binding was blocked with a 20 min incubation in diluted
normal serum, and sections were incubated for 1 h at 37
o
C
with the SOD1 antibody. Next, sections were incubated for
30 min at room temperature with a biotinylated secondary
antibody (Vector, USA) followed by 40 min at room
temperature with the peroxidase-conjugated biotin-avidin
complex (Vectastain ABC kit; Vector, USA). Finally, the
bound peroxidase was revealed by immersing the sections
in diaminobenzidine (Vector, USA). Sections were
counterstained with hematoxylin, rehydrated for 15 min in
236 Jung-Min Yon et al.
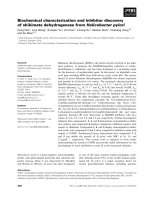
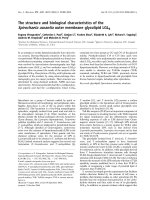
Fig. 3. Immunohistochemistry using a SOD1 antibody on sagittal sections of developing mouse embryos. (A) Embryonic day (ED) 16.5
liver (×100). (B) ED 16.5 liver (×400). (C) ED 17.5 pancreas (×400). (D) ED 18.5 submandibular gland (×200). (E) ED 16.5 kidney
(×200). (F) ED 14.5 adrenal gland (×100). (G) ED 16.5 adrenal gland (×200). (H) ED 17.5 thymus (×200). (I) ED 16.5 lymph node (×40).
(J) ED 16.5 bone (×200). (K) ED 18.5 bone (×100). (L) ED 14.5 skin (×200). (M) ED 17.5 skin (×100). (N) ED 18.5 collagen fiber-like
tissue (×100). (O) ED 17.5 skin (×100); negative control.
deionized water to remove any precipitated Tris, and then
dehydrated in a series of ethanol and xylene. Negative
control experiments for the antibodies were performed as
above with the omission of the primary antibody.
Results
Expression of SOD1 in developing embryos and
extraembryonic tissues
Using Western blot analysis with β-actin as an internal
standard, SOD1 was detected in all embryos and
extraembryonic tissues from ED 8.5 to 18.5. The signal in
embryos was observed at the lowest levels on ED 9.5-11.5
and the highest levels on ED 17.5-18.5 (Fig. 1A). Extraembryonic
expression of SOD1 remained constant throughout all
stages of embryonic development (Fig. 1B).
Localization pattern of SOD1 during organogenesis
SOD1 immunoreactivity was detected in various
embryonic tissues from ED 13.5 to 18.5. The distribution
and quantitative expression of SOD1 in developing
embryos are described in detail below (Figs. 2 and 3) and
are summarized in Table 1. In developing brains, SOD1
immunoreactivity was detected at moderate levels in the
external layers (Fig. 2A; asterisk) and pyramidal cells of
the cerebral cortex on ED 13.5 to 18.5 (Fig. 2B) and in the
cerebellum on ED 17.5 and 18.5 (Fig. 2C). A strong SOD1
signal was observed in the ependymal epithelium of the
choroid plexus on ED 13.5 to 18.5 (Fig. 2D) and in
Rathke’s pouch (hypophysis) after ED 15.5 (Figs. 2E and
F). The SOD1 signal was also strong in the developing
spinal ganglia on ED 13.5 to 17.5, but was present at only
a moderate level on ED 18.5 (Fig. 2G). Moderate SOD1
Localization and level of SOD1 in developing mouse embryos 237
Table 1. Comparison of cytoplasmic Cu/Zn superoxide dismutase expression in developing embryonic organs following embryonic da
y
Organs / Embryonic day 13.5 14.5 15.5 16.5 17.5 18.5
N
ervous tissues Cerebral cortex + +± ±++
Choroid plexus ++ ++ ++ ++ +++ ++
Cerebellum + + ± ± + +
Rathke's pouch (hypophysis) + + + ++ ++ +++
Ganglia ++ ++ ++ ++ ++ ++
Spinal cord + + + + ++ ++
Sensory organs Olfactory epithelium + + ++ ++ ++ ++
Inner ear epithelium nc + ++ +++ ++ ++
Respiratory organs Lung Parenchyma ± ± ± + + +
Epithelium ± ± ± ++ ++ ++
Circulatory organs Myocardium ± ± ± ± + ++
Blood cells +++ +++ +++ ++ ++ ++
Blood vessels ++ ++ +++ +++ +++ +++
Digestive organs Intestine Epithelium ± ± + ++ + +
Muscular layer ± ± + + + ++
Liver Hepatocyte +++ +++ +++ +++ +++ ++
Hematopoietic cells +++ ++ ++ ++ ++ ++
Pancreas Acinus ± + + + ++ +
Islet ± + + + + ±
Submandibular gland ± ± + nc ++ ++
Urinary organs Kidney Metanephric corpuscle + + + + ++ ±
Metanephric tubule + + + + + +
Urinary bladder Epithelium nc nc + + nc ±
Muscular layer nc nc ± ± nc ++
Adrenal gland Medulla ++ ++ + + nc ±
Cortex + + + ++ nc ++
Lymphatic organs Thymus nc nc ++ +++ ++ +
Lymph nodes nc ± ++ +++ +++ +++
Osteogenic tissues +++ +++ +++ +++ +++ ++
Skin ± ± ++ +++ +++ +++
*
Signal intensity: ±, weak; +, moderate; ++, strong; +++, very strong; nc, not checked.
immunoreactivity was detected in the spinal cord on ED
13.5 to 16.5, and the signal was strong on ED 17.5 and 18.5
(Table 1).
After ED 15.5, SOD1 was strongly expressed in the
sensory cells of the cochlear and vestibular epithelia of the
inner ear (Figs. 2H and I) and in the olfactory cells and
Bowman’s glands in the olfactory epithelium (Figs. 2J and
K). In developing eyes, strong SOD1 immunoreactivity
was observed in the lens fiber and the retinal pigment
epithelium (RPE) on ED 16.5, and in the iris and RPE on
ED 18.5 (Fig. 2L).
In the parenchyma of the developing lung, weak
expression of SOD1 was observed on EDs 13.5 to 15.5,
becoming moderate on ED 16.5 to 18.5. Strong SOD1
immunoreactivity was observed in the bronchial and
terminal bronchiolar epithelia after ED 15.5 (Figs. 2M and
N). SOD1 was weakly expressed in the myocardium of the
developing heart up until ED 16.5, and increased slightly
after ED 17.5 (Fig. 2O). In contrast, strong SOD1
immunoreactivity was consistently observed in nucleated
and enucleated blood cells and in blood vessels (Figs. 2P
and Q).
SOD1 was strongly expressed in the basal cells and
muscular layers of the stomach on ED 16.5 (Fig. 2R). In
developing intestine, SOD1 expression was moderate in
the intestinal villi and muscle layers after ED 15.5, but was
strong in the goblet cells and basal cell part of the crypt of
Lieberkühn after ED 16.5 (Fig. 2S and T). In the developing
liver, strong SOD1 immunoreactivity was observed in
hepatocytes and hematopoietic cells during all periods
examined (Figs. 3A and B). In the developing pancreas,
moderate SOD1 immunoreactivity was observed in the
acinus and islet on ED 14.5 to 16.5. After ED 17.5, the
SOD1 signal was higher in the acinus than the islet of the
238 Jung-Min Yon et al.
pancreas (Fig. 3C). Strong SOD1 immunoreactivity was
observed in secretory acini and ducts of the submandibular
glands on EDs 17.5 to 18.5 (Fig. 3D).
In the developing kidney, SOD1 immunoreactivity was
higher in the cortex than in the medulla, but the signal
intensity was moderate in the metanephric corpuscles and
tubules on ED 13.5 to 16.5 (Fig. 3E). On ED 17.5, a strong
SOD1 signal was observed in the glomeruli, but moderate
in the tubules. However, the signal intensity in tubules and
glomeruli was reversed on ED 18.5 (Table 1). Moderate
SOD1 immunoreactivity was observed in the luminal
epithelium of the urinary bladder on EDs 15.5 and 16.5. On
ED 18.5, SOD1 immunoreactivity was strong in the
surrounding muscular layers, but was weak in the
epithelium (Table 1).
In the developing adrenal glands, SOD1 expression was
higher in the medulla than in the cortex on EDs 13.5 and
14.5 but was similar in both areas on ED 15.5. On ED 16.5
to 18.5, the SOD1 signal in the cortex had exceeded that
observed in the medulla (Figs. 3F and G).
Strong SOD1 expression was observed in the thymus on
ED 15.5 to 17.5 (Fig. 3H), whereas expression was
moderate on ED 18.5. In the developing lymph nodes,
SOD1 expression was weak on ED 14.5 and was high after
ED 15.5 (Fig. 3I). In the developing bone and cartilage, a
very strong SOD1 signal was observed in chondrocytes on ED
13.5 to 18.5 (Figs. 3J and K). Strong SOD1 immunoreactivity
was observed in the surface epithelium, hair follicles, and
muscle layers of the skin after ED 15.5 (Figs. 3L and M)
and in a collagen fiber-like tissue on ED 18.5 (Fig. 3N).
Discussion
ROS are important in normal developmental processes,
such as progression to the early stage, neuronal
differentiation, and digit formation. However, excessive
production of ROS can cause severe embryonic damage,
resulting in embryonic death, preeclampsia, or congenital
anomalies in placentation [6,26]. SOD1 plays a major role
in antioxidant defense by converting O
2-
to H
2
O
2
and water
[15]. Recently, we demonstrated that SOD1 transcripts were
present at all embryonic stages [30]. Here, we confirm the
expression pattern of SOD1 protein during normal
embryonic development. SOD1 was detected throughout
all embryonic stages, in both embryonic and
extraembryonic tissues, from ED 8.5 to 18.5. The SOD1
signal was increased at late stages of embryonic
development, but maintained a constant level of expression
in extraembryonic tissues during organogenesis. SOD1
immunoreactivity was particularly strong in metabolically
active sites and in protective tissues, such as the skin and
lung, at late gestation.
Uteroplacental circulation is established after implantation.
The placenta receives nutrients, oxygen, antibodies, and
hormones from the mother's blood and passes out waste
[10]. The expression of SOD1 within the human placenta
suggests that it might serve an important function at the
maternal-fetal interface [27]. The oxygen requirements in
rodent embryos vary during embryo development [2]. As
the fetus moves from a hypoxic to a relatively hyperoxic
environment, accompanying changes in antioxidant enzymes
constitute a compensatory mechanism aimed at protecting
the newborn from oxidative stress [14].
SOD1 accumulates in many neuronal populations, but it
is particularly abundant in motor neurons of the spinal cord
[21]. A number of sporadic and familial motor neuron
diseases result from point mutations in the gene encoding
SOD1 on human chromosome 21 [24]. In this study, SOD1
expression was higher in the spinal cord and spinal ganglia
than in the brain during organogenesis.
SOD1 immunoreactivity was ubiquitously present in
developing organs and was particularly strong in the
ependymal epithelium of the choroid plexus, ganglia,
sensory cells of the olfactory and vestibulocochlear
epithelia, blood cells and vessels, hepatocytes and
hematopoietic cells of livers, lymph nodes, osteogenic
tissues, and skin during organogenesis. These results are in
agreement with the expression patterns of SOD1 transcripts
in most tissues and metabolically active sites [30]. SOD1
levels increase in mature cells to inhibit oxidative stress
induced by exogenous materials, such as alcohol, kanamycin,
6-hydroxydopamine, and 1-methyl-4-phenylpyridinium
[1,22]. SOD1 immunoreactivity is detected in the
epithelial cells of the gastrointestinal tract, respiratory
tract, pancreatic islets, and kidneys during late gestation in
rats [18,19].
ROS are vital to normal developmental processes, such as
proliferation and differentiation [6]. SOD1 is distributed
primarily in tissues and cells that are frequently exposed to
O
2-
or its metabolites. In this study, strong SOD1
immunoreactivity was observed in sites of active
differentiation and proliferation, such as chondrocytes of
osteogenic tissues, hematopoietic cells of the liver, and
circulatory blood cells. Erythrocytes use SOD1 to
scavenge O
2-
, but carry only the SOD1 protein, not mRNA,
as they lack mitochondria. SOD1 deficiency leads to
increased erythrocyte vulnerability, as a consequence of
increased oxidation of proteins and lipids. The short
lifespan of erythrocytes in SOD1−/− mice has been
attributed to both endogenous and environmental factors
[12]. Neutrophils produce enormous quantities of O
2-
through the activity of oxidant-generating systems [25].
High levels of SOD1 activity were detected in cartilage and
connective tissues [9], and a low molecular weight mimetic
of SOD attenuates chronic inflammation, tissue damage,
and bone damage associated with collagen-induced arthritis
[5]. Thus, SOD1 may act as an important antioxidant in
osteogenesis and hematopoiesis during embryonic development.
Localization and level of SOD1 in developing mouse embryos 239
SOD1 levels vary widely in different cell types, and even
within a particular cell type, during the course of embryonic
development. SOD1 may play a crucial role as an
antioxidant against ROS in cellular differentiation, regulation,
and signaling during murine embryonic development.
Acknowledgments
This work was supported by a Korea Research Foundation
Grant funded by the Korean Government (MOEHRD,
Basic Research Promotion Fund, KRF-2005-005-J15002
and KRF-2006-312-E00151).
References
1. Barkats M, Horellou P, Colin P, Millecamps S,
Faucon-Biguet N, Mallet J. 1-Methyl-4-phenylpyridinium
neurotoxicity is attenuated by adenoviral gene transfer of
human Cu/Zn superoxide dismutase. J Neurosci Res 2006,
83, 233-242.
2. Chen EY, Fujinaga M, Giaccia AJ. Hypoxic
microenvironment within an embryo induces apoptosis and
is essential for proper morphological development. Teratology
1999, 60, 215-225.
3. Chen SY, Sulik KK. Free radicals and ethanol-induced
cytotoxicity in neural crest cells. Alcohol Clin Exp Res 1996,
20, 1071-1076.
4. Crapo JD, Oury T, Rabouille C, Slot JW, Chang LY.
Copper,zinc superoxide dismutase is primarily a cytosolic
protein in human cells. Proc Natl Acad Sci USA 1992, 89,
10405-10409.
5. Cuzzocrea S, Mazzon E, Paola RD, Genovese T, Mui
à C,
Caputi AP, Salvemini D. Effects of combination M40403
and dexamethasone therapy on joint disease in a rat model of
collagen-induced arthritis. Arthritis Rheum 2005, 52,
1929-1940.
6. Dennery PA. Effects of oxidative stress on embryonic
development. Birth Defects Res C Embryo Today 2007, 81,
155-162.
7. Didion SP, Ryan MJ, Didion LA, Fegan PE, Sigmund
CD, Faraci FM. Increased superoxide and vascular
dysfunction in CuZnSOD-deficient mice. Circ Res 2002, 91,
938-944.
8. Elchuri S, Oberley TD, Qi W, Eisenstein RS, Jackson
Roberts L, Van Remmen H, Epstein CJ, Huang TT.
CuZnSOD deficiency leads to persistent and widespread
oxidative damage and hepatocarcinogenesis later in life.
Oncogene 2005, 24, 367-380.
9. Frederiks WM, Bosch KS. Localization of superoxide
dismutase activity in rat tissues. Free Radic Biol Med 1997,
22, 241-248.
10. Hanson LA. Session 1: Feeding and infant development
breast-feeding and immune function. Proc Nutr Soc 2007,
66, 384-396.
11. Ho YS, Gargano M, Cao J, Bronson RT, Heimler I, Hutz
RJ. Reduced fertility in female mice lacking copper-zinc
superoxide dismutase. J Biol Chem 1998, 273, 7765-7769.
12. Iuchi Y, Okada F, Onuma K, Onoda T, Asao H,
Kobayashi M, Fujii J. Elevated oxidative stress in
erythrocytes due to a SOD1 deficiency causes anemia and
triggers autoantibody production. Biochem J 2007, 402,
219-227.
13. Keithley EM, Canto C, Zheng QY, Wang X,
Fischel-Ghodsian N, Johnson KR. Cu/Zn superoxide
dismutase and age-related hearing loss. Hear Res 2005, 209,
76-85.
14. Khan JY, Black SM. Developmental changes in murine
brain antioxidant enzymes. Pediatr Res 2003, 54, 77-82.
15. McCord JM, Fridovich I. Superoxide dismutase. An
enzymic function for erythrocuprein (hemocuprein). J Biol
Chem 1969, 244, 6049-6055.
16. McFadden SL, Ding D, Reaume AG, Flood DG, Salvi RJ.
Age-related cochlear hair cell loss is enhanced in mice
lacking copper/zinc superoxide dismutase. Neurobiol Aging
1999, 20, 1-8.
17. Muller FL, Song W, Liu Y, Chaudhuri A, Pieke-Dahl S,
Strong R, Huang TT, Epstein CJ, Roberts LJ 2nd, Csete
M, Faulkner JA, Van Remmen H. Absence of CuZn
superoxide dismutase leads to elevated oxidative stress and
acceleration of age-dependent skeletal muscle atrophy. Free
Radic Biol Med 2006, 40, 1993-2004.
18. Munim A, Asayama K, Dobashi K, Suzuki K, Kawaoi A,
Kato K. Immunohistochemical localization of superoxide
dismutases in fetal and neonatal rat tissues. J Histochem
Cytochem 1992, 40, 1705-1713.
19. Ogawa T, Ohira A, Amemiya T. Manganese and
copper-zinc superoxide dismutases in the developing rat
retina. Acta Histochem 1997, 99, 1-12.
20. Okado-Matsumoto A, Fridovich I. Subcellular distribution
of superoxide dismutases (SOD) in rat liver: Cu,Zn-SOD in
mitochondria. J Biol Chem 2001, 276, 38388-38393.
21. Pardo CA, Xu Z, Borchelt DR, Price DL, Sisodia SS,
Cleveland DW. Superoxide dismutase is an abundant
component in cell bodies, dendrites, and axons of motor
neurons and in a subset of other neurons. Proc Natl Acad Sci
USA 1995, 92, 954-958.
22. P
érez MJ, Cederbaum AI. Adenovirus-mediated expression
of Cu/Zn- or Mn-superoxide dismutase protects against
CYP2E1-dependent toxicity. Hepatology 2003, 38, 1146-1158.
23. Sha SH, Zajic G, Epstein CJ, Schacht J. Overexpression of
copper/zinc-superoxide dismutase protects from kanamycin-
induced hearing loss. Audiol Neurootol 2001, 6, 117-123.
24. Shaw PJ, Ince PG, Falkous G, Mantle D. Oxidative
damage to protein in sporadic motor neuron disease spinal
cord. Ann Neurol 1995, 38, 691-695.
25. Sheppard FR, Kelher MR, Moore EE, McLaughlin NJ,
Banerjee A, Silliman CC. Structural organization of the
neutrophil NADPH oxidase: phosphorylation and translocation
during priming and activation. J Leukoc Biol 2005, 78,
1025-1042.
26. Valko M, Leibfritz D, Moncol J, Cronin MT, Mazur M,
Telser J. Free radicals and antioxidants in normal
physiological functions and human disease. Int J Biochem
Cell Biol 2007, 39, 44-84.
27. Wang Y, Walsh SW. Increased superoxide generation is
associated with decreased superoxide dismutase activity and
mRNA expression in placental trophoblast cells in preeclampsia.
240 Jung-Min Yon et al.
Placenta 2001, 22, 206-212.
28. Weisiger RA, Fridovich I. Mitochondrial superoxide
simutase. Site of synthesis and intramitochondrial localization.
J Biol Chem 1973, 248, 4793-4796.
29. Wentzel P, Eriksson UJ. Antioxidants diminish developmental
damage induced by high glucose and cyclooxygenase
inhibitors in rat embryos in vitro. Diabetes 1998, 47,
677-684.
30. Yon JM, Baek IJ, Lee SR, Jin Y, Kim MR, Nahm SS, Kim
JS, Ahn B, Lee BJ, Yun YW, Nam SY. The spatio-temporal
expression pattern of cytoplasmic Cu/Zn superoxide
dismutase (SOD1) mRNA during mouse embryogenesis. J
Mol Histol 2008, 39, 95-103.