Báo cáo khoa học: "Two-dimensional gel electrophoresis and immunoblot analysis of Neospora caninum tachyzoites" ppt
Bạn đang xem bản rút gọn của tài liệu. Xem và tải ngay bản đầy đủ của tài liệu tại đây (1.75 MB, 7 trang )
-2851$/ 2)
9H W H U L Q D U \
6FLHQFH
J. Vet. Sci.
(2004),
/
5
(2), 139–145
Two-dimensional gel electrophoresis and immunoblot analysis of
Neospora caninum
tachyzoites
Eung-Goo Lee, Jae-Hoon Kim
1
, Yong-Seung Shin, Gee-Wook Shin, Yong-Hwan Kim, Gon-Sup Kim,
Dae-Yong Kim
2
, Tae-Sung Jung, Myung-Deuk Suh*
Institute of Animal Medicine,
College of Veterinary Medicine, Gyeongsang National University, Jinju 600-701, Korea
1
Department of Veterinary Medicine, Cheju National University, Jeju 690-756, Korea
2
Department of Pathology, College of Veterinary Medicine, Seoul National University, Seoul 151-742, Korea
Identification of expressed protein profiles and antigenic
determination are some of the most challenging aspects of
proteomics. Two-dimensional gel electrophoresis (2-DE)
combined with immunoblot analysis were employed to study
the
N. caninum
proteome. Protein sample preparation was
carried out by first conducting sonication, followed by
adding lysis buffer containing 7M urea plus 2M thiourea to
the purified tachyzoites in order to complete disruption. A
total of 335 differentially expressed protein spots were
detected using pH 4-7 IPG strip (7 cm) that were run in a 56
kVh isoelectric focusing (IEF) system. Of the spots analyzed,
64 were identified as antigenic spots on immunoblot profile.
Major antigenic spots appeared at 65 kDa (pI 5.2-5.3), 51
kDa (pI 5.5), 38 kDa (pI 5.1), 33 kDa (pI 4.4), 29 kDa (pI 5.6)
and 15.5 kDa (pI 5.0) were observed to be significantly
distinct compared to the rest of the antigenic spots. The
results indicate that combination of 2-DE and immunoblotting
methods were thought as very useful tools in defining both
proteins and antigens of
N. caninum
tachyzoites.
Additionally, present 2-DE profiles may be valuable in
further proteomic approaches and study of the pathogen.
Kewords:
Neospora caninum
, two-dimensional gel electro-
phoresis (2-DE), immunoblot
Introduction
Neospora caninum
(
N. caninum
)
is an obligate cyst-
forming intracellular protozoan (Apicomplexa) parasite of
animals [10,11]. It was usually misdiagnosed as
Toxoplasma
gondii
(
T. gondii
) because of their morphological and
biological similarities up to the middle of 1980s. But it was
then distinguished due to its distinct morphology of forming
cysts in tissue and their antigenic differences [4,5,10]. In
recent years,
N. caninum
has been identified as a major
causative agent of abortion or stillbirths in both dairy and
beef cattle worldwide, including Korea [1,12,19,22,24]. The
economic losses due to infections it causes have encouraged
a general investigation of the pathogen, and many reports
were published concerning its pathogenicity. However, no
study of the expressed proteins from the whole organism of
N. caninum
was performed.
The global analysis of protein expression profiles might
be invaluable for obtaining a more complete understanding
of biological events, such as, development, evolution, and
pathogenicity of this organism [21,36]. Two-dimensional
electrophoresis (2-DE) which is considered as a powerful
and widely used method for analyzing complex protein
mixtures extracted from cells, tissues, or other biological
samples. This technique was originally described by Klose
[27] and O’Farrell [34], which involves separation of
cellular proteins according to their isoelectric points (p
I
) and
relative molecular masses (
M
r
). With this method, a protein
can only be visualized and analyzed if it can be brought and
kept in solution during the entire 2-DE separation process.
The cells or tissues must be efficiently disrupted and cells
contents must be solubilized completely [30]. This is one of
the most important points to consider in 2-DE. Over the last
few yea rs, 2-DE with immobilized pH gradients (IPGs) has
been improved to its superior resolution and reproducibility
[14,15,37]. Moreover, its combination with immunoblotting
assay is allowed to find out many and distinct antigens
compared with conventional SDS-PAGE and its
immunoblotting analysis. These approaches prove a highly
successful in characterization of the expressed proteins of
some parasitic organisms such as
T. gondii
[8,9,13],
Fasciola hepatica
[20],
Schistosoma japonicum
[25],
Ascaris suum
[26], and even comparison of 2-DE profiles
between
N. caninum
and
T. go
ndii [17].
In this study, 2-DE profiles were employed for the
analysis of expressed proteins of
N. caninum
tachyzoites.
*Corresponding author
Phone: +82-55-751-5822; Fax: +82-55-751-5803
E-mail:
140 Eung-Goo Lee
et al.
Proper optimization of sample preparation were known to
play a key role in obtaining suitable images of 2-DE. In
addition, two-dimensional antigen profiles were observed
with the use of rabbit anti-sera specific for
N. caninum
tachyzoites (KBA-2).
Materials and Methods
Maintenance and purification of
N. caninum
tachyzoites
N. caninum
tachyzoites, KBA-2 isolate [23], was used at the
present study. The tachyzoites were maintained in Vero cell
monolayer. For purification, tachyzoites were harvested by
scraping the infected Vero cell monolayer into growth
medium. Suspension of tachyzoites including cellular debris
were done through centrifugation at 1,000 × g for 10 min.
Pellet was resuspended in phosphate-buffered saline (PBS,
pH 7.4). Tachyzoites were released from infected cells by
pulling and pushing a syringe fitted with a 23-guage and 27-
guage needle, respectively. Subsequently, suspensions were
loaded on 30%, 50% and 80% osmotic percoll gradient
(Amersham Bioscience, Sweden), and centrifuged at
2,000 × g for 30 min. The viable tachyzoites band formed
between 50% and 80% osmotic percoll gradients were
collected and washed three times with PBS. Generally, a total
of approximately 1 × 10
8
tachyzoites as counted by the use of
hemocytometer were purified from infected monolayer using
four pieces of 175 cm
2
size culture flasks. The purified
tachyzoites were stored at
−
70
o
C until further use.
Comparison of sample preparation for 2-DE
In order to optimize sample preparation for 2-DE, purified
tachyzoites were lysed in three different methods. First,
tachyzoites dissolved in 40 mM Tris-base (pH 9.6) were
disrupted by rapid freezing and thawing 3 times using liquid
nitrogen, and continually disrupted using lysis buffer
containing 9.5 M urea, 40 mM Tris-base, 4% (w/v) CHAPS,
1% (w/v) DTT, 1 mM PMSF, and 0.5% (v/v) IPG-buffer pH
3-10 (Amersham Bioscience, Sweden). Secondly, after
successive freezing and thawing, the intact tachyzoites
remained were sonicated (XL-2020, Misonix, USA) at a low
power for 1 min in ice slurry and continually disrupted using
9.5 M urea lysis buffer. Finally, the same procedures
employed in second method were followed except that the
lysis buffer which is composed of 7 M urea and 2 M
thiourea. The lysates were maintained for 1 h in ice slurry
and then centrifuged at 16,000 × g for 30 min at 4
o
C.
Subsequently, the supernatants were transferred to micro
centrifuge tube and stored at
−
70
o
C. The total protein
concentrations were estimated at approximately 0.5 mg/mL
based on the Bradford protein assay method [7]
using bovine
serum albumin as standard.
2-DE and comparison of two different IEF conditions
Isoelectric focusing (IEF) was carried out by using
IPGphor system (Amersham Bioscience, Sweden) according
to Görg
et al
. [15] and utilizing Immobilized pH gradient
(IPG) strips (Immobiline DryStrip, pH 3-10 and pH 4-7,
0.5 × 3 × 70 mm, Amersham Bioscience, Sweden). The
tachyzoite samples separately prepared were mixed with
rehydration buffer (8 M urea or 2 M thiourea/6 M urea, 4%
(w/v) CHAPS, 65 mM DTT, 0.5% IPG buffer, 0.002% (w/
v) bromophenol blue) and then loaded on the ceramic strip
holders by in gel rehydration method. The absorbed proteins
in strips were focused in an automated run at 20
o
C. After
IEF, IPG strips were equilibrated with 10 mg/mL DTT in
equilibration buffer (6 M urea, 2% (w/v) SDS, 30% (v/v)
glycerol, 0.002% (w/v) bromophenol blue, 50 m
M
Tris-HCl,
pH 8.8) for 15 min and further incubated in the same buffer
for another 15 min replacing DTT by 4 mg/mL
iodoacetamide. After equilibration, the IPG strips were
placed onto either 12.5% or 10% SDS-polyacrilamide gels
(80 × 80 × 1 mm) and sealed with 0.5% (w/v) agarose.
SDS-PAGE was run at 5 mA/gel for 15 min as initial
migration and increased to 10 mA/gel for separation until
front dye reached the bottom of the gel. In order to establish
an accurate IEF result, two different conditions were
compared using pH 3-10 IPG strip (7 cm). First sample (4
µ
g/IPG strip) was focused in an automated run by
programming 12 hrs in gel rehydration (without current), 1 h
at 500 V, 1 h at 1000 V, and 10 hrs at 4500 V, having a total
of 46.5 Kilovolt-hour (kVh). On the other hand, same
sample conditions were rehydrated at 14 hrs (7 hrs at 0 V
and 7 hrs at 30 V), 2 hrs at 200 V, 1 h at 500 V and 1000 V, 2
hrs at 2000 V and 10 hrs at 4500 V reaching a total of 56.1
kVh.
Silver staining
Silver staining was performed according to Mortz
et al
.
[33] with slight modification. Briefly, the gels after 2-DE
were fixed in 50% (v/v) methanol, 12% (v/v) acetic acid and
0.05% (v/v) formalin for 2 hrs and then washed 3 times with
50% (v/v) ethanol for 20 min. The gels were then sensitized
with 0.01% (w/v) sodium thiosulfate for 1 min and washed
with distilled water 3 times for 20 sec. The washed gels
were incubated in 0.2% (w/v) silver nitrate containing
0.076% (v/v) formalin for 30 min. After incubation, it was
rinsed with distilled water followed by adding the
developing solution which contained 3% (w/v) sodium
carbonate with 0.05% (v/v) formalin until intensity desired.
Development was terminated by adding 50% (v/v) methanol
and 12% (v/v) acetic acid.
Production of rabbit anti-sera specific
N. caninum
tachyzoites
Anti-
N. caninum
polyclonal antibodies were raised by
immunizing rabbit (New Zealand White, 1.5 kg). Briefly,
rabbit was immunized subcutaneously with 1 × 10
7
live
tachyzoites (KBA-2) mixed with Freunds complete (first
Two-dimensional gel electrophoresis and its immunoblot analysis of
Neospora caninum
tachyzoites 141
immunization) and incomplete adjuvant (second and third
immunization) at 2-weeks-interval. Booster dose was given
a week after. Sera were collected 7 days after booster
injection and stored at
−
70
o
C until use.
Immunoblot analysis
The gels containing spots separated with 2-DE were
transferred to nitrocellulose membrane (Immobilon-NC,
0.45
µ
m, Millipore, USA). The blotted membranes were
rinsed with TBS-T buffer (20 mM Tris, 500 mM NaCl,
0.05% v/v tween 20, pH 7.4) and then blocked with
blocking buffer (5% w/v skim milk in TBS-T buffer)
overnight at 4
o
C. The membranes were incubated with an
anti-
N. caninum
rabbit antisera diluted in a ratio of 1 : 200 in
blocking buffer for 2 h and then washed 3 times with TBS-T
buffer for 20 min. Further incubation were done using the
goat anti-rabbit IgG antibody conjugated with horseradish
peroxidase (Santa Cruz Biotechnology, USA) with 1 : 2,000
dilution in blocking buffer for 1 h. After washing five times
with TBS-T buffer, the membranes were treated with ECL
solution (Amersham Bioscience, Sweden) for 1 min and
then exposed to X-ray film for 5-30 sec.
Image analysis
Either stained or immunoblotted spots were digitalized by
using Agfa Arcus 1200
TM
image scanner (Agfa-Gevaert,
Belgium), and the acquired images were analyzed by using
Phoretix
TM
2D software (Ver. 5.01, NonLinear Dynamics,
UK).
SDS-PAGE and Immunoblot analysis
In order to accurately compare between 2-DE and 1-DE
profiles, purified tachyzoites of
N. caninum
were disrupted
by freezing and thawing, sonicated as previously described,
mixed with the same volume of SDS sample buffer (Sigma,
USA) and boiled at 95
o
C for 5 min. The lysates were
centrifuged at 10,000 g for 5 min at 4
o
C and the supernatants
were stored at
−
70
o
C. The sample was separated by SDS-
PAGE using 12.5% slab gels with a 4% stacking gel. The
protein bands were stained with Coomassie blillant blue
(CBB) G-250. The separated proteins were transferred to
nitrocellulose membrane and underwent immunoblotting as
previously described. Images of stained gel and film were
digitalized by using Agfa Arcus 1200
TM
image scanner.
Acquired images were analyzed using Quantity One
®
software (Ver. 4.2, Bio-Rad, USA).
Results
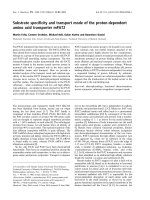
Comparison between two IEF conditions
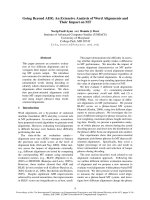
2-DE profiles stained with silver nitrate showed a
significant differences in spot numbers depending on IEF
conditions. The spot numbers were analyzed by automatic
spot detection mode using Phoretix 2D software.
Approximately 182 spots were detected on 2-DE profile
focused on IPG strip that were run in 46.5 kVh. On the other
hand, approximately 212 spots were observed on the profile
at 56 kVh (Fig. 1).
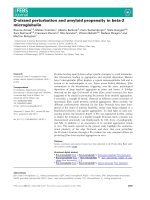
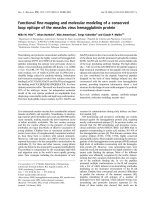
Comparison of 2-DE sample preparation
Comparison of 2-DE sample preparations were carried
out by determining the number of resolved spots detected on
silver stained gels. The lysates separately prepared were
focused at 56.1 kVh using IPG strips of pH 3-10 and pH 4-7
and performed SDS-PAGE with 12.5% gel. Most
N.
caninum
tachyzoites protein spots were located between pH
4 and pH 8, and between 25 and 87 kDa. A total of 172 spots
(A) were observed in pH 3-10 IPG strip, on the contrary,
approximately 243 spots (D) were observed in pH 4-7 IPG
strip when samples were prepared by freezing and thawing.
F
ig. 1.
Comparison of two IEF conditions. IEF was performed using pH 3-10 IPG strips (7 cm) with 8 µg of lysate from
N. caninu
m
t
achyzoites. SDS-PAGE was performed using 12% gels which were then stained with silver nitrate. (A) In gel rehydration were done
at
0
V for 12 hrs, 500 V for 1 h, 1,000 V for 1 h and 4,500 V for 10 hrs, having a total of 46,5 kVh, (B) In gel rehydration conditions we
re
a
t 0 V for 7 hrs followed by 30 V for 7 hrs, 200 V for 2 hrs, 500 V for 1 h, 1,000 V for 1 h, 2,000 V for 2 hrs and 4,500 V for 10 h
rs,
h
aving a total of 56,1 kVh.
142 Eung-Goo Lee
et al.
Sample preparation using sonication followed by adding
lysis buffer containing 9.5 M Urea shows an increase in spot
numbers. Based on the data gathered, approximately 194
(B) and 256 spots (E) were identified with pH 3-10 and pH
4-7 IPG strips, respectively. Sonication and utilization of
2 M thiourea plus 7M urea proved to obatin the highest
number of spots, since it was able to detect around 251 (C)
and 332 spots (F) using pH 3-10 and pH 4-7 IPG strips,
respectively (Fig. 2).
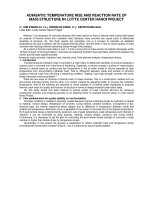
Immunoblot analysis
A total of 335 spots were detected on silver stained gel
using pH 4-7 IPG strip based on sample preparation
utilizing sonication and lysis buffer (7 M urea plus 2 M
thiourea). Among them, 64 spots were identified as
antigenic spots on immunoblot image with the used of rabbit
antisera specific for KBA-2. Most
N. caninum
antigenic
spots were located in between 28 kDa and 97 kDa and
between pH 4.4 and pH 6.1 except one antigenic spot having
15.5 kDa (spot 64). A number of large antigenic spots (spot
61 and 64) were also observed. Concurrently, a series of
antigen spots having similar molecular weight but different
p
I
values (spot 16-19 and 27-34) were also determined in
immunoblotting profile. Major antigenic spots were noted as
spot 16, 17, 19, 42, 59, 61 and 64 (Fig. 3). Molecular weight
and isoelectric point of the respective antigenic spots were
shown in Table 1.
Rabbit antiserum specific for
N. caninum
tachyzoites
(KBA-2) was able to recognize 20 bands located from 15.5
to 80 kDa, of which thick bands were observed such as 18-
15.5, 22-21, 25, 31-30, 39, 44, 49, 65, and 80 kDa. Whereas,
minor bands were identified having 28, 33, 35, 37, 55, 74,
and 108 kDa. Among them, only few antigenic bands
corresponds to antigenic spots on 2-DE profiles using pH 4-
7 IPG strips and were determined as 15.5, 28, 33, 35, 37, 39,
44, 55, 65 and 80 kDa antigenic bands (Fig. 4).
Discussion
One of the most important points in proteomic approach is
to obtain a reproducible 2-DE gels which primarily depends
on sample preparation. The cells or tissue must be efficiently
disrupted and solubilized completely in order to obtain a
representative protein population through sample lysis
methods (sonication, french pressure, grinding and
mechanical homogenization) [30]. Three sample
preparation methods were compared at the present study.
Among them, sonication for disrupting
N. caninum
tachyzoites combined with Urea-thiourea mixture as strong
neutral chaotrope were found suitable method since more
spots were detected compared with the other methods
previously mentioned. It also observed and allowed to detect
clear spots. Urea-thiourea mixtures (typically 2 M thiourea
and 5-8 M urea) were reported to exhibit superior
solubilizing power, especially on membrane proteins
[32,37]. Furthermore, the mixtures were able to resolve
many high molecular weight proteins [29].
Most
N. caninum
tachyzoites spots were placed at p
I
values below 7 by using a wide-range of IPG gels (pH 3-10)
[17]. At present study, most spots were placed between pH 4
and 8, and between molecular weights of 25 and 87 kDa. In
addition, many spots were found over pH 7. A few number
of 2-DE profile for
N. caninum
tachyzoites were available,
but present results were slightly different from Heckeroth
et
al.
[17] in terms of pH range probably caused by different
sample preparation methods, different IEF conditions and
IPG gel sizes. However, most spots observed in acidic part
have identical result between the two experiments.
Immunodominant antigens of
N. caninum
were detected
as groups comprising molecules of 16/17, 29, 37, 46 kDa
F
ig. 2.
Comparison of 2-DE profiles with three different samp
le
p
reparations. 2-DE profiles of
N.
caninum
tachyzoites
we
re
c
onducted employing the three different sample preparati
on
p
rocess at the same IEF conditions such as freezing and thawi
ng
(
A and D), sonication (B and E) followed by adding lysis buff
er
c
ontaining 9.5 M urea and sonication. After which, 7M urea pl
us
2
M thiourea (C and F) were again added. IEF was performed
at
a
total of 56.1 kVh using pH 3-10 and pH 4-7 IPG strips (7 cm
).
S
DS-PAGE was performed in 12% gels which were then stain
ed
w
ith silver nitrate. A total of 172 (A), 251 (C) and 256 (E) spo
ts
w
ere observed with pH 3-10 IPG strips. On the contra
ry,
a
pproximately 194 (B), 243 (D) and 332 (F) spots were observ
ed
w
ith pH 4-7 IPG strips.
Two-dimensional gel electrophoresis and its immunoblot analysis of
Neospora caninum
tachyzoites 143
using hyperimmune rabbit anti-
N. caninum
(NC-1) serum
[2]. Similar molecular bands, including 17, 29/30, 37 and 46
kDa, were observed from sera of cattle, dogs, sheep, goats,
rabbits and pigs [6]. Bands such as 15.5-18, 30/31 and 37
kDa, were also detected using rabbit sera raised against
N.
caninum
tachyzoites (KBA-2). In addition, thick bands, for
example 22-21, 25, 39, 44, 49, 65 and 80 kDa, were
identified which were thought as main antigens of the
parasite.
Most studies were performed based on conventional SDS-
PAGE and immunoblotting assay. Although differences of
sample preparation were not allowed to compare directly
between 2-DE profiles and conventional results, a number of
antigen spots on 2-DE using pH 4-7 IPG strip were found
and considered as corresponding antigen bands on SDS-
PAGE immunoblotting profiles: Spot 9 corresponds to 80
kDa band, spots 15, 16, 17, 18 and 19 to 65 kDa band, spot
37 to 55 kDa band, spot 44 and 46 to 44 kDa band, spot 52
to 39 kDa band, spot 55 and 56 to 37 kDa band, spot 58 to
35 kDa band, spot 59 to 33 kDa band, spot 63 to 28 kDa
band, spot 64 to 15.5 kDa band. Spot 42, 54 and 61
exhibited strong signals on 2-DE immunoblotting profile on
F
ig. 3.
Analysis of 2-DE and immunoblot profiles of
N. caninum
tachyzoites. (A) A total of 335 spots were detected on the 2-DE profi
le.
O
f these, 64 spots were identified as antigenic through comparison with 2-DE immunoblotting profile with the use of Phoretix
TM
2
D
s
oftware on (B) 2-DE immunoblotting profile. Separated proteins after 2-DE were transferred to NC membrane and antigenic spo
ts
w
ere detected with the use of rabbit anti-serum specific for
N. caninum
tachyzoites.
T
able 1.
Isoelectric point andMolecular weight of antigenic spots of Fig. 4
Spot No. p
I
a)
M
r
b)
(kDa) Spot No. p
IM
r
(kDa) Spot No. p
IM
r
(kDa)
1 5.93 96.5 23 5.51 62.6 45 5.71 44.7
2 5.68 95.0 24 5.58 62.5 46 4.94 44.3
3 5.69 88.2 25 5.67 62.4 47 5.06 44.8
4 5.65 87.3 26 5.12 61.7 48 5.24 42.4
5 5.73 86.9 27 4.61 63.3 49 5.98 41.1
6 4.85 86.6 28 4.65 61.9 50 5.34 40.3
7 5.77 85.5 29 4.69 61.4 51 4.91 39.6
8 5.02 84.6 30 4.73 61.1 52 5.97 39.3
9 5.79 80.1 31 4.78 60.6 53 5.44 37.8
10 5.70 76.3 32 4.85 59.2 54 5.09 37.8
11 5.62 76.0 33 4.90 58.8 55 5.75 37.0
12 5.36 69.4 34 5.01 58.5 56 6.01 36.8
13 5.74 68.0 35 5.06 58.9 57 5.37 36.0
14 5.65 66.4 36 5.55 56.6 58 6.11 35.3
15 5.68 65.4 37 5.91 55.2 59 4.36 32.6
16 5.27 65.0 38 5.88 54.1 60 5.35 29.4
17 5.34 65.0 39 5.84 52.9 61 5.60 28.7
a
)
Isoelectric point
b
)
Molecular weight
144 Eung-Goo Lee
et al.
pH 4-7 having no corresponding antigen bands on SDS-
PAGE immunoblotting profiles. Differences might be due to
2-DE resolution which able to separate not only molecular
weight but also p
I
for each molecule.
Antigen bands 116, 65 and 25 kDa were detected using
sera from cows which were confirmed as
Neospora
-induced
abortion by immunoblot analysis [3]. At the present study,
65 kDa antigen band was separated into a series of antigenic
spots, such as spot 15, 16, 17, 18 and 19, which had similar
molecular weight but different p
I
values. Isoform proteins
might be separated into chain-like patterns. Each spot of the
isoforms might be either originated from different gene or
the same gene but occurred usually in post translational
modification [31]. Spots from 27 to 34 were also observed
possessing a chain-like patterns but displayed very weak
signals.
The 29/30 kDa antigens might be associated with dense
granules, network and limiting membrane of the
parasitophorous vacuole [6]. Spots 60, 61 and 62 were
thought to be corresponding spots of 29 kDa antigen band.
Among them, spot 61 was suspected as a major antigenic
spot in 2-DE antigen profiles. Dense granule associated in
33 kDa protein (NCDG1) was subcloned and identified [28].
On the other hand, affinity purified anti-Nc-p33 antibodies
were uniquely recognized against 33 kDa band by
immunoblot performed under both reducing and non-
reducing conditions [18]. Spot 59 was assumed corresponding
to 33 kDa antigen band and need to be confirmed using
MALD-TOF MS assay.
Both
N. caninum
-specific sheep and rabbit sera were
recognized as antigenic spots, at molecular weight range of
11 to 18 kDa and at p
I
range of 5 to 6. But the two antigenic
spots did not react with
T. gondii
-specific anti-sera using 2-
DE immunoblotting assay [17]. Spot 64, a large antigenic
spot, was detected at 15.5 kDa and at p
I
value of 5.03 on 2-
DE immunoblot profile. The spot was distinguished from
the other due to its low molecular weight on 2-DE profiles
and was suspected as the same spot pointed by Heckeroth
et
al.
[17].
This study was conducted by optimization of sample
preparation and IEF condition for 2-DE and analysis of 2-
DE profiles. Results collected allowed to manifest the
usefulness of 2-DE combined with immunoblotting in
defining proteins and antigens of
N. caninum
tachyzoites. In
addition, 2-DE profiles of
N. caninum
tachyzoites may be
useful in further proteomic approaches.
Acknowledgment
This study was supported by a grant from the Agricultural
R & D Promotion Center (ARPC, No. 20010067), Korea.
References
1. Anderson ML, Blanchard PC, Barr BC, Dubey JP,
Hoffman RL, Conrad PA.
Neospora
-like protozoan infection
as a major cause of abortion in California dairy cattle. J Am
Vet Med Assoc 1991, 198, 241-244.
2. Barta JR, Dubey JP. Characterization of anti-
Neospora
caninum
hyperimmune rabbit serum by Western blot analysis
and immunoelectron microscopy. Parasitol Res 1992, 78,
689-694.
3. Baszler TV, Knowles DP, Dubey JP, Gay JM, Mathison
BA, McElwain TF. Serological diagnosis of bovine
neosporosis by
Neospora
caninum
monoclonal antibody-
based competitive inhibition enzyme-linked immunosorbent
assay. J Clin Microbiol
1996, 34, 1423-1428.
4. Bjerkås I, Mohn SF, Presthus J. Unidentified cyst-forming
sporozoon causing encephalomyelitis and myositis in dogs. Z
Parasitenkd 1984, 70, 271-274.
5. Bjerkås I, Presthus J. Immunohistochemical and
ultrastructural characteristics of a cyst-forming sporozoon
associated with encephalomyelitis and myositis in dogs. Acta
Patho Microbiol Immunol Scand 1988, 96, 445-454.
6. Bjerkås I, Jenkins MC, Dubey JP. Identificaton and
characterizaton of
Neospora caninum
tachyzoite antigens
useful for diagnosis of neosporosis. Clin Diagn Lab Immunol
1994, 1, 214-221.
7. Bradford MM. A rapid and sensitive method for the
quantitation of microgram quantities of protein utilizing the
principle of protein-dye binding. Anal Biochem 1976, 72,
248-254.
8. Cohen AM, Rumpel K, Coombs GH, Wastling JM.
Characterization of global protein expression by two-
F
ig. 4. SDS-PAGE and its immunoblot analysis of the
N.
c
aninum
tachyzoites. SDS-PAGE (line 1) and its immunoblotti
ng
p
rofiles (line 2) were resolved under reducing conditions. T
he
a
ntigen bands were detected with rabbit anti-serum specific f
or
N
. caninum
tachyzoites and were expressed in numbers (arro
w
o
n the right of immunoblotting image) allowing to find
its
c
orresponding antigen spots on 2-DE immunoblotting profile
s.
M
olecular weight markers are indicated on the left side a
nd
e
xpressed in kilo Dalton (kDa).
Two-dimensional gel electrophoresis and its immunoblot analysis of
Neospora caninum
tachyzoites 145
dimensional electrophoresis and mass spectrometry: proteomics
of
Toxoplasma gondii
. Int J Parasitol 2002,
32
, 39-51.
9.
Dlugonska H, Dytnerska K, Reichmann G, Stachelhaus
S, Fischer HG.
Towards the
Toxoplasma gondii
proteome:
position of 13 parasite excretory antigens on a standardized
map of two-dimensionally separated tachyzoite proteins.
Parasitol Res 2001,
87
, 634-637.
10.
Dubey JP, Carpenter JL, Speer CA, Topper MJ, Uggla A.
Newly recognized fatal protozoan disease of dogs. J Am Vet
Med Assoc 1988,
192
, 1269-1285.
11.
Dubey JP, Lindsay DS.
A review of
Neospora caninum
and
neosporosis. Vet Parasitol 1996,
67
, 1-59.
12.
Dubey JP.
Recent advances in
Neospora
and neosporosis.
Vet Parasitol 1999,
84
, 349-367.
13.
Geiâler S, Sokolowska-Köhler W, Bollmann R, Jungblut
PR, Presber W.
Toxoplasma gondii
infection: analysis of
serological response by 2-DE immunoblotting. FEME
Immuno Med Microbiol 1999,
25
, 299-311.
14.
Görg A, Postel W, Günther S.
The current state of two-
dimensional electrophoresis with immobilized pH gradients.
Electrophoresis 1988,
9
, 531-546.
15.
Görg A, Obermaier C, Boguth G, Harder A, Dcheibe B,
Wildgruber R, Wesis W.
The current state of two-
dimensional electrophoresis with immobilized pH gradients.
Electrophoresis 2000,
21
, 1037-1053.
16.
Harkins D, Clements DN, Maley S, Marks J, Wright S,
Esteban I, Innes EA, Buxton D.
Western blot analysis of the
IgG responses of ruminant infected with
Neospora caninum
and with
Toxoplasma gondii
. J Comp Path 1998,
119
, 45-55.
17.
Heckeroth AR, Tenter AM, Hemphill A, Innes EA,
Buxton D.
Evaluation of cross-reactivity between tachyzoites
of
Neospora
caninum
and
Toxoplasma gondii
by two-
dimensional gel electrophoresis. Int J Parasitol 2000,
30
,
913-919.
18.
Hemphill A, Gajendran N, Sonda S, Fuchs N, Gottstein B,
Hentrich B, Jenkins M.
Identification and characterization of
a dense granule-associated protein in
Neospora caninum
tachyzoites. Int J Parasitol 1998,
28
, 429-438.
19.
Hur K, Kim JH, Hwang WS, Hwang EK, Jean YH, Lee
BC, Bae JS, Kang YB, Yamane I, Kim DY.
Seroepidemiological study of
Neospora caninum
in Korean
dairy cattle by indirect immunofluorescent antibody assay.
Korean J Vet Res 1998,
38
, 859-866.
20.
Jefferies JR, Brophy PM, Barrett J.
Investigation of
Fasciola hepatica
sample preparation for two-dimensional
electrophoresis
.
Electrophoresis
2000,
21
, 3724-3729.
21.
Jungblut PR, Zimny-Arndt U, Zeindl-Eberhart E, Stulik
J, Koupilova K, Pleissner KP, Otto A, Muller EC,
Sokolowska-Kohler W, Grabher G, Stoffler G.
Proteomics
in human disease: cancer, heart and infectious diseases.
Electrophoresis 1999,
20
,
2100-2110.
22.
Kasari TR, Barling K, McGrann JM.
Estimated
production and economic losses from
Neospora
caninum
infection in Texas beef herds. Bovine Pract 1999,
33
, 113-
120.
23.
Kim JH, Sohn HJ, Hwang WS, Hwang EK, Jean YH,
Yamane I, Kim DY.
In vitro
isolation and characterization of
bovine
Neospora
caninum
in Korea. Vet Parasitol 2000,
90
,
147-54.
24.
Kim JH, Lee JK, Hwang EK, Kim DY.
Prevalence of
antibodies to
Neospora caninum
in Korean native beef cattle.
J Vet Med Sci 2002,
64
, 941-943.
25.
Kirinoki M, Yokoi H, Kawai S, Chigusa Y, Matuda H.
Detection of a
Schistosoma japonicum
specific circulating
antigen by two-dimensional gel electrophoresis.
Parasitol Int
1998,
47
, 21-27.
26.
Kasuga-aoki H, Tsuji N, Suzuki K, Isobe T, Yoshihara S.
Identification of surface proteins and antigens from larval
stages of
Ascaris suum
by two-dimensional electrophoresis.
Parasitology 2000,
121
, 671-677.
27.
Klose J.
Protein mapping by combined isoelectric focusing
and electrophoresis of mouse tissues. A novel approach to
testing for induced point mutation in mammals. Humangenetik
1975,
26
, 231-243.
28.
Lally N, Jenkins M, Liddell S, Dubey JP.
A dense granule
protein (NCDG1) gene from
Neospora
caninum
. Mol Bio
Parasitol 1997,
87
, 239-243.
29.
Lanne B, Potthast F, Hoglund A, Brockenhuus von
Lowenhielm H, Nystrom AC, Nilsson F, Dahllof B.
Thiourea enhances mapping of the proteome from murine
white adipose tissue. Proteomics 2001,
1
, 819-828.
30.
Link AJ.
2-D Proteome Analysis Protocols. pp. 9-94.
Humana Press, Totowa, 1999.
31.
Luduena RF.
Multiple forms of tubulin: different gene
products and covalent modifications. Int Rev Cytol
1998,
178
,
207-275.
32.
Molloy MP, Herbert BR, Walsh BJ, Tyler MI, Traini M,
Sanchez JC, Hochstrasser DF, Williams KL, Gooley AA.
Extraction of membrane proteins by differential solubilization
for separation using two-dimensional gel electrophoresis.
Electrophoresis 1998,
19
, 837-844.
33.
Mortz E, Krogh TN, Vorum H, Görg A.
Improved silver
staining protocols for high sensitivity protein identification
using matrix-assisted laser desorption / ionization-time of
flight analysis. Proteomics 2001,
1
, 1359-1363.
34.
O’Farrell PH.
High resolution two-dimensional
electrophoresis of proteins. J Biol Chem 1975,
250
, 4007-
4021.
35.
Paré J, Hietala SK, Thurmond MC.
An enzyme-linked
immunosorbent assay (ELISA) for serological diagnosis of
Neospora
sp. infection in cattle. J Vet Diagn Invest 1995,
7
,
352-359.
36.
Pennington SR, Wilkins MR, Hochstrasser DF, Dunn MJ
.
Proteome analysis: from protein characterization to
biological function. Trends Cell Biol 1997,
7
, 168-173.
37.
Rabilloud T, Adessi C, Giraudel A, Lunardi J.
Improvement of the solubilization of proteins in two-
dimensional electrophoresis with immobilized pH gradients.
Electrophoresis
1997,
18
, 307-316.