[Psychology] Mechanical Assemblies Phần 8 potx
Bạn đang xem bản rút gọn của tài liệu. Xem và tải ngay bản đầy đủ của tài liệu tại đây (5.82 MB, 58 trang )
386
15
DESIGN
FOR
ASSEMBLY
AND
OTHER
"ILITIES"
(a) For
parts that
can be
grasped
and
manipulated with
one
bare hand
Symmetry
(S
=
a
+
p)
S
<
360°
360°
< S <
540°
540°
< S <
720°
S
=
720°
Code
0
1
2
3
No
handling
difficulties
Thickness
> 2 mm
Size
> 15 mm
0
1.13
1.5
1.8
1.95
6 mm <
size
< 15 mm
1
1.43
1.8
2.1
2.25
< 2 mm
Size
> 6 mm
2
1.69
2.06
2.36
2.51
Part
nests
or
tangles
Thickness
> 2 mm
Size
>
1
5
mm
3
1.84
2.25
2.57
2.73
6 mm <
size
< 15 mm
4
2.17
2.57
2.9
3.06
<2mm
Size
> 6 mm
5
2.45
3
3.18
3.34
(b) For
parts that
can be
lifted with
one
hand
but
require
two
hands
to
manage
FIGURE
15-1.
Selected
Manual Handling Times
in
Seconds. Parts
(a) and (b) are
mutually exclusive.
Both
apply
to
small
parts within easy reach, that
are no
smaller than
6 mm, do not
stick together,
and are not
fragile
or
sharp. Symmetry
is
measured
by
summing angles
a and
/};
a is the
number
of
degrees required
to
rotate
the
part about
an
axis
normal
to the
insertion
axis
in
order
to
return
it to an
identical configuration,
and
f>
is the
same with respect
to an
axis
about
the
insertion axis.
The
code
to
be
assigned
is the
combination
of the row and
column headings
in
italics.
For
example,
a
part coded
"12"
has
handling time
2.06 sec. (Courtesy
of
Boothroyd Dewhurst, Inc. Copyright
©
1999.)
table
appears
in
Figure
15-1.
Each code
is
accompanied
by
an
estimated handling time
in
seconds, ranging
from
1.13
seconds
to 5.6
seconds. These times were developed
over
a
period
of
years
by
means
of
experiments
and are
applicable
to
small
parts.
4
Individual companies have also
developed their
own
time estimates. Boothroyd also pro-
vides guidelines
for
scaling
the
times
for
larger parts.
The
assembly conditions that
affect
assembly time
are
listed
in
Table 15-5.
A
portion
of the
manual insertion
time
table appears
in
Figure
15-2.
There
are 24
code num-
bers
with
insertion times that range
from
1.5
seconds
to
10.7 seconds.
As
with
the
numbers
in
Figure
15-1,
these
4
MIT
students
who
have
used
these
times
for
handling
and
assembly
report
that
they
are
accurate
within
about
10%.
However,
it is
impor-
tant
to
recall
the
information
cited above
that
it
takes 1,000
to
3,000
trials
to
become really
proficient
at an
assembly
task,
whereas
the
MIT
student data
are
based
on ten or
twenty practice runs
at
most.
TABLE
15-4.
Part Features that Affect Manual Handling
Nesting,
tangling,
fragility
Need
to use two
hands
or
more
than
one
person
Need
to use
tools
Size,
thickness,
and
weight
Flexibility,
slipperiness,
stickiness
Need
for
mechanical
or
optical
magnification
assistance
Degree
of
symmetry
of the
part
Source:
[Boothroyd, Dewhurst,
and
Knight].
times
apply
to
small parts
and
must
be
scaled
up for
larger
ones.
For
example,
a
person assembling cell phones might
install
several complex-shaped metal shields over
a
circuit
board
to
block
radio-frequency
interference
during
a
cycle
time
of 15
seconds
or
less.
By
contrast,
on an
automobile
final
assembly
line, station times
are
typically
45 to 60
sec-
onds,
during
which
one
large item like
a
seat, roof, hood,
or
battery might
be
obtained
and
installed. Sometimes,
two
Code
4
a
<
180°
Size
> 15 mm
0
4.1
6 <
Size
< 15 mm
1
4.5
a
=
360°
Size
> 6 mm
2
5.6
15.D.
TRADITIONAL
DFM/DFA (DFx
IN THE
SMALL)
387
people work together
to
handle
the
larger items. Often
there
is no
time
to
install
and
tighten fasteners,
so
another
person does this
at the
next station.
In
support
of the
time estimates
in
these tables,
[Boothroyd, Dewhurst,
and
Knight] presents several
detailed explanations
for the
sources
of the
estimates,
in-
cluding empirical formulas
and
graphs.
These
include:
• The
influence
of
symmetry
or
asymmetry
on the
time
a
person needs
to
orient something correctly starting
TABLE
15-5.
Conditions that Affect Manual Insertion
Time
Whether
the
part
is
secured immediately
or
after
other operations
Accessibility
of the
insertion region
Ability
to see the
insertion region
Ease
of
aligning
and
positioning
the
part
A
tool
is
needed
Whether
the
part stays
put
after
being placed
or
whether
the
assembler must hold
it
until other parts
or
fasteners
are
installed
Simplicity
of the
insertion operation
Source: [Boothroyd, Dewhurst,
and
Knight].
(a)
Part inserted
but not
secured immediately,
or
secured
by
snap
fit
(b)
Part inserted
and
secured immediately
by
power
screwdriver.
Note:
add 2.9
seconds
to get
power tool.
(c)
Separate operation times
for
solid parts already
in
place
FIGURE 15-2.
Selected
Manual
Insertion Times (Courtesy
of
Boothroyd
Dewhurst,
Inc. Copyright
©
1999.)
Parts
(a)
and
(b) are
mutually exclusive, while Part
(c)
contains times that
are
added
to
times
in the
other
two
tables when required.
Times
in
Part
(a)
apply
to
small parts where there
is no
resistance
to
insertion.
No
access
or
vision
difficulties
Obstructed
access
or
restricted
vision
Obstructed
access
and
restricted vision
Code
0
1
2
Secured
by
separate
operation
or
part
No
holding down required
Easy
to
align
0
1.5
3.7
5.9
Not
easy
to
align
/
3.0
5.2
7.4
Holding
down required
Easy
to
align
2
2.6
4.8
7.0
Not
easy
to
align
3
5.2
7.4
9.6
Secured
right
away
by
snap
fit
Easy
to
align
4
1.8
4.0
7.7
Not
easy
to
align
5
3.3
5.5
7.7
No
access
or
vision
difficulties
Restricted
vision
only
Obstructed
access only
Code
3
4
5
Easy
to
align
0
3.6
6.3
9.0
Not
easy
to
align
/
5.3
8.0
10.7
388
15
DESIGN
FOR
ASSEMBLY
AND
OTHER
"ILITIES"
from
a
random orientation (time
rises
approximately
linearly
regardless
of
detailed part cross-sectional
shape
from
a
base
of
1.5
seconds
to a
peak
of 2.7
sec-
onds
as the
required number
of
degrees
of
rotation
rises)
• The
influence
of
part size
and
thickness (size greater
than about
15
mm
does
not
impose
any
handling time
penalty,
while thickness greater than
2 mm
does
not
cause
any
handling time penalty; these conclusions
obviously
do not
apply
to
parts
the
size
of car
seats)
• The
influence
of
part weight (for small parts,
the
time rises linearly with weight,
and a
part weigh-
ing
20
pounds
imposes
a
penalty
of 0.5
seconds
plus
any
additional time associated with walking)
• The
influence
of
clearance ratio (see Chapter
10) on
insertion time (time penalty
is
inversely
proportional
to
the log of the
clearance ratio
and
ranges
from
0.2 to
0.5
seconds depending
on
whether there
is a
chamfer
or
not)
In
addition
to the
time
estimates
provided
in
[Boothroyd, Dewhurst,
and
Knight],
one can use
stan-
dard time handbooks such
as
[Zandin].
These handbooks
use
standard work
actions
like
"reach,"
"grasp,"
and so
on,
without
taking
the
design
of the
part
or the
assembly
operation into account. However, they contain data that
applies
to
larger parts, walking time,
and
time
to
position
equipment
to aid
assembly.
These
time estimates
do not
take account
of
variations
due to
fatigue
or
time
of
day.
In
many factories, assembly
line workers
can
adjust
the
speed
of the
line during
the
day
as
long
as
they make
the
total number
of
assemblies
required
by the end of the
day. This approach
is
satisfac-
tory
for a
line that feeds
a
warehouse
but not for one
that
feeds
another line unless additional measures
are
taken
to
ensure that
the
downstream processes receive assemblies
when they need them.
Several general guidelines
are
also
offered:
•
Avoid connections,
or
make them short
and
direct.
Items like pipes that join
different
parts
or
assemblies
could
be
made
shorter,
straighter,
or
even eliminated
if
the
parts were closer
to
each other
or
otherwise
better arranged.
A
guideline like this
can run
into
conflicts
if the
parts
in
question must
be
replaced
for
maintenance
or are
subject
to
design revision
or
customer options.
Conflict
can
also arise
if the
parts
must
be
kept
separate
in
order
to
allow cooling
air to
pass between them
or to
reduce
the
effect
of
radio-
frequency
interference,
for
example.
•
Provide plenty
of
space
to get at the
parts
and
their
fasteners during assembly.
This
guideline
often con-
flicts
with
the
need
to
make products small even
as
they
become more complex.
Car
engine compart-
ments,
cell
phones,
and
cameras
are
typical exam-
ples.
In
such cases, assemblers need tools, magni-
fiers,
dexterity,
and
extra time.
•
Avoid adjustments. Adjustments take time, hence
the
guideline. Sometimes,
as
discussed
in
Chapter
6, it is
not
economical
to
make parts
of
sufficient
accuracy
to
avoid adjustments.
In
other
cases,
the
customer
makes
the
adjustments
in the
normal course
of
using
the
product.
The
user
of a
sewing machine
adjusts
thread tension
to
accommodate
different
thread
ma-
terials with
different
coefficients
of
friction.
• Use
kinematic design principles.
As
noted
in
Chap-
ter 4,
overconstraint makes
the
assembly
strategy
operator-dependent
and
thus makes both time
and
quality
operator-dependent.
[Redford
and
Chal]
notes that
the
classification method,
while
not
explaining
in
detail what
to do if a
part
or
operation takes longer than desired, nevertheless places
it
in the
table
next
to
other classification
possibilities
that
are
better
or
worse. Thus
the
engineer
can see
what kinds
of
improvements might
be
made
in a
given case: Would
the
part
be
better
if it was
thicker,
had a
chamfer,
didn't
tangle,
was a
little more symmetric,
and so on? How
much
time will that save?
And so on.
[Boothroyd, Dewhurst,
and
Knight] notes that design
changes
for
ease
of
assembly, like those that reduce part
count (discussed below) cannot
be
made without know-
ing
their impact
on the
cost
of
making
the
part. Thus
[Boothroyd, Dewhurst,
and
Knight] also contains chap-
ters
on
design
for
sheet metal, injection molding, machin-
ing,
and
other
manufacturing
processes,
as
well
as
robot
assembly.
The
information
in the
tables
for
handling
and in-
sertion times
is
encapsulated
in
software available
from
Boothroyd Dewhurst, Inc., Kingston, Rhode Island.
15.D.2.
The
Hitachi
Assembleability
Evaluation
Method
The
Hitachi Assembleability Evaluation Method (AEM)
belongs
to a
class
of
"points
off" methods ([Miyakawa,
15.D.
TRADITIONAL
DFM/DFA
(DFx
IN THE
SMALL)
389
Ohashi,
and
Iwata]).
In
these methods,
the
"perfect" part
or
assembly operation gets
the
maximum score, usually
one
hundred,
and
each element
of
difficulty
is
assigned
a
penalty.
There
are
twenty different operational circum-
stances, each with
its own
penalty. Each circumstance
is
accompanied
by a
simple icon
for
identification, permit-
ting
the
method
to be
applied easily with little training.
The
AEM is
part
of a
larger suite
of
tools including
the
Pro-
ducibility
Evaluation Method (PEM, [Miyakawa, Ohashi,
Inoshita,
and
Shigemura]),
the
Assembly Reliability Eval-
uation
Method (AREM, described below),
and the
Recy-
clability Evaluation Method (REM).
The
method
is
applied manually
or
with
the aid of
com-
mercially available software. When
a
part
or
operation
is
fully
evaluated,
all the
penalties
are
added
up and
sub-
tracted
from
one
hundred.
If the
score
is
less than some cut-
off
value,
say
eighty,
the
operation
or
part
is to be
subjected
to
analysis
to
improve
its
score.
The
penalties
and
time
es-
timates have been refined based
on the
experience
of the
entire Hitachi corporation, which makes
a
wide range
of
consumer
and
industrial goods such
as
camcorders,
televi-
sion
sets, microwave ovens, automobile components,
and
nuclear
power stations.
All the
evaluations
are
based
on
comparing
the
current design
to a
base design that
is
either
"ideal"
or
represents
the
previous design
of the
same
or
a
similar product. Because
of the
depth
of the
underlying
dataset
and the
ratio technique
of
evaluation,
the
method
is
especially
useful
for
designing
the
next
in a
series
of
similar
products over
a
period
of
years. Repeated
use of
the
method
on the
same product line relentlessly drives
out
low
scoring operations.
The
evaluation takes place
in two
stages. First, each
operation
is
evaluated, yielding
an
evaluation score
£,
for
each operation.
If
several operations
are
required
on one
part,
an
average score
E is
calculated.
The
score
for the
entire product
is
either
the sum of all the
individual part
scores
or the
average
of the
part scores.
In
either case,
it
is
possible that
an
assembly with fewer parts will have
a
higher
score simply because fewer penalties
are
available
to
reduce
it. In
this case,
the
method clearly states,
"reduc-
tion
in
part count
is
preferable
to
better
score."
However,
the
method
does
not
include
a
systematic
way of
identify-
ing
which parts might
be
eliminated.
Examples
of the
penalties
and use of the
method appear
in
Figure 15-3
and
Figure 15-4.
15.D.3.
The
Hitachi
Assembly
Reliability
Method
(AREM)
The
Hitachi Assembly Reliability Evaluation Method
([Suzuki,
Ohashi, Asano,
and
Miyakawa])
extends
the
AEM
beyond cost
and
time into
the
domain
of
assem-
bly
success
and
product reliability.
The
impetus
for
this
method arises
from
several trends:
the
rise
in
product
liability suits,
the
introduction
of new
product
and
pro-
cess technologies resulting
in
production uncertainties
and
long ramp-up times, shorter product development time
resulting
in
design mistakes,
and the
degree
to
which out-
sourcing
makes
a
manufacturer dependent
for
quality
on
the
work
of
other companies.
The
method
has
proven use-
ful
for
products that must achieve very high reliability,
products that change drastically
from
one
model
or
ver-
sion
to the
next, complex products, ones that
are
assembled
at
multiple sites around
the
world,
and
products containing
many
parts
and
subassemblies
from
suppliers.
The
basic
logic
of the
method
is
shown
in
Figure 15-5.
The
method
is
similar
in
style
to the AEM in the
sense
that each operation
is
evaluated
and
compared
to a
stan-
dard,
resulting
in a
penalty.
In
addition,
the
method con-
tains
a
scale
factor called
the
basic
shop fault rate, based
on
data
from
a
given
factory,
that permits
the
failure rate
at
that
factory
to be
estimated based
on the
product's design.
FIGURE 15-3. Examples
of AEM
Symbols
and
Penalty
Scores.
([Miyakawa,
Ohashi,
and
Iwata].
Hitachi,
Ltd. Used
by
permission.)
390
15
DESIGN
FOR
ASSEMBLY
AND
OTHER
"ILITIES"
FIGURE 15-4.
Assembleability
Eval-
uation
and
Improvement Examples.
([Miyakawa,
Ohashi,
and
Iwata].
Hitachi,
Ltd. Used
by
permission.)
FIGURE 15-5. Hitachi Assembly Relia-
bility
Evaluation Method. (Hitachi, Ltd.
Used
by
permission.)
On
this basis,
one can
decide either
to
improve
the
product
or to
improve
the
factory
in
order
to
increase
the
score.
The
basic
assumption behind
the
method
is
that
if the
assembly reliability
is
low, either
the
product
is at
fault
(resulting
in a
product structure penalty)
or
there
is
some
variation
in the
assembly
process
(resulting
in an
oper-
ational variance penalty). Product structure factors that
influence
assembly faults include dimensional variation,
flexibility
or
fragility
of
parts, lack
of
sufficient
access
to
the
assembly point,
too
much force needed
to
ensure
complete insertion,
and so on.
Operational variance factors
include
not
positioning
a
part accurately enough, applying
too
much force
or not
enough
force,
not
driving screws
all
the way in,
cutting
a
wire,
and so on.
These
factors
are to
some extent
represented
in the
Boothroyd handling time
and
insertion time tables
but
are
associated with time rather than failure
to
perform
the
assembly correctly.
In
addition, other kinds
of
mistakes
are
15.D. TRADITIONAL
DFM/DFA
(DFx
IN THE
SMALL)
391
FIGURE
15-6.
The
Westinghouse
DFA
Calculator.
The
calculator
is a
rotary
slide
rule.
It
consists
of a
large
disk
with
a
slightly
smaller
disk
and a
transparent
cursor
on
each
side.
The
smaller
disks
can be
rotated
independently
of the
large
disk
and
the
cursors.
Difficulty
starts
at
zero
and
accumulates
as the
topics
marked
A, B, C,
and so on, are
addressed
in
turn.
(Reprinted
from
[Sturges]
with
permission
from
Elsevier
Science.)
possible,
as
discussed
in
Chapter
16. The
most
frequent
of
these
are
using
the
wrong part
and
using
a
damaged
part.
No DFA
method
deals
directly with
these
issues,
although general guidelines include warnings about help-
ing
the
operator
to
distinguish between similar parts.
15.D.4.
The
Westinghouse
DFA
Calculator
Sturges developed
a
rotary calculator
at
Westinghouse
for
estimating handling
and
insertion
difficulty
(Figure
15-6).
On
one
side
the
user calculates
a
handling
difficulty
index
that
is
interpreted
as
seconds required.
On the
other
side
the
same kind
of
calculation
is
done
to
estimate assembly
time. Factors such
as
part shape, symmetry, size
of
fea-
tures
to be
grasped
or
mated with, direction
of
insertion,
clearance,
and
fastening
method
are
assessed
and
added
up by
repositioning
the
disks
and the
cursor.
15.D.5.
The
Toyota
Ergonomic
Evaluation
Method
Most
DFA
methods
are
designed
to
evaluate assembly
of
small
parts.
In the
auto industry,
final
assembly
of the
product involves relatively large
and
heavy parts. Here,
ergonomics,
the
science
of
large-scale human work
and
motion,
is
applicable. Toyota
has
determined that
the
prod-
uct
of the
weight
of a
part
and the
time
it
must
be
sup-
ported
by a
worker
is a
good indicator
of
physical stress
([Niimi
and
Matsudaira]).
In
addition,
the
worker's pos-
ture
is
important: standing, slightly bending,
or
bending
deeply
are
each
more
stressful
than
the one
before
for the
same weight
and
duration. Thus Toyota
has
developed
a
stress evaluator
called
TVAL (Toyota Verification
of As-
sembly Line)
to
prioritize assembly operations
for im-
provement
to
reduce physical stress.
The
form
of
TVAL
is
where
d\,di,
and
d^
are
constants
and t and W are the
time
and
part weight, respectively.
For
example, installing
a
lightweight grommet onto
a car
door requires standing
for
30
seconds
and has a
TVAL
of
about
25.
By
contrast,
installing
a
rear combination lamp involves bending for-
ward
deeply
for
over
60
seconds
and has a
TVAL
of 42.
Before
TVAL
was
applied
to a
section
of
assembly line,
TVALs
ranged
from
30 to 48.
After
redesigning
the
worst
stations,
TVALs range
from
22 to 35.
15.D.6.
Sony
DFA
Methods
Sony
has a
unique
way of
involving
its
engineers
in the
DFA
process.
The
engineers must prepare
exploded
view
drawings
of all
concepts. This forces consideration
of as-
sembly even before detailed design begins. This
is
illus-
trated
in
Figure 15-7.
A DFA
analysis
is
done
on the
con-
cept, based
on the
exploded view, using Sony's
own DFA
software.
The DFA
score
is
included with other
criteria
in
judging
the
merit
of
each
concept.
5
5
This
process
was
explained
to the
author during
two
visits
to
Sony
in
1991.
Next Page
392
15
DESIGN
FOR
ASSEMBLY
AND
OTHER
"ILITIES"
FIGURE 15-7. Exploded View Drawing
of
Sony Walkman Chassis. Drawings like this
are
made
by
design engineers
for
every
design
concept.
(Used
by
permission
of
Sony FA.)
15.E.
DFx IN THE
LARGE
DFx in the
large deals with issues that require consid-
eration
of the
product
as a
whole, rather than individual
parts
in
isolation,
and
likely will require consideration
of
the
context
in the
factory, supply chain, distribution chain,
and the
rest
of the
product's
life
cycle.
We
take
up
such
issues
here.
Our
focus
will
be on (a)
product structure
and
its
relation
to
product simplification
and (b)
design
for
disassembly, repair,
and
recycling.
15.E.1.
Product
Structure
Product structure involves many
of the
issues
normally
as-
sociated with product architecture,
but the
focus
is on the
structure
more than
on its
influence
on
architecture issues.
That
is, one
reads about products that
are
built
in
stacks
or
in
arrays,
or
about consolidating parts,
in the
context
of
simplifying assembly rather than about
"integrality"
or
"modularity." Nevertheless,
one of the first
books
to
deal with design
for
assembly, [Andreasen
et
al.],
clearly
recognizes
the
close
connection,
not
only between
DFA
and
product structure,
but
between these
two
topics
and
the
larger issue
of
product development processes them-
selves. Early consideration
of
assembleability inevitably
turns
to
opportunities
for
restructuring
the
product,
and
this
cannot
be
done except early
in the
design process.
A
design process that does
not
permit early consideration
of
assembly issues will therefore
be a
very different
process
from
one
that does,
and the
resulting product will
be
dif-
ferent
as
well. Furthermore,
the
differences will extend
beyond
the
local issue
of
assembleability.
15.E.1
.a.
Styles
of
Product
Structure
and
their
Influence
on
Ease
of
Assembly
Several architectural styles have been
identified
in
assem-
blies. These
are the
stack
and the
array. Examples
of
these
are
shown
in
Figure 15-8.
In
general,
arrays present
the
fewest constraints
on the
assembly
process. Printed circuit boards
are the
most
ob-
vious
example. These
are
usually made
by
high speed
machines that select parts
from
feeders each
of
which
Previous Page
15.E.
DFx
IN
THE
LARGE
393
FIGURE
15-8.
Examples
of
Stack
and
Array
Product
Structures. Both stacks
and
arrays
come
in two
generic
varieties:
the
parts
are
mostly
the
same
or
mostly
different.
([Redford
and
Chal].
Copyright
©
Alan
Redford.
Used
by
permission.)
presents
one
part
(100K
resistor,
a
particular integrated
circuit, etc.) Because this product structure
is so
simple,
the
assembly sequence
can be
optimized
to
suit selection
and
insertion
of the
different
kinds
of
parts.
The
factors
involved include
how far the
insertion head
has to
travel
to
get
each kind
of
part,
how
many
of
each kind
are
needed,
how
close together
on the
board they are,
and so on.
Opti-
mization
algorithms have been developed
to find the
best
insertion sequence.
The
main
justification
for a
stack architecture
is
that
gravity
aids
the
insertion process.
If
locating
features
are
provided,
a
part will
stay
put
once
it is
placed.
In
Fig-
ure
15-8,
two
types
of
stacks
are
shown, namely, those
with
identical parts
and
those with
different
parts.
In the
former
case, there
are
ample opportunities
for
alternate
as-
sembly sequences, such
as
preparing
a
separate subassem-
bly
comprising
the
stack
of the
identical disks. When
the
parts
are
quite
different,
as
suggested
by the
illustration,
their
individual
properties
and
mating features
may
create
assembly sequence constraints.
Most products
are
combinations
of the
generic struc-
tures illustrated above. [Kondoleon] conducted
a
survey
of
a
dozen varied products,
including
consumer
and
indus-
trial
items, noting which assembly operations were needed
and
the
directions along which they occurred.
The
results
appear
in
Figure 15-9
and
Figure
15-10.
They show that
there
are two
dominant insertion operations
and two
dom-
inant
directions.
The
implication
is
that these products
appear
to
have
a
major axis
of
insertion
and
perhaps
of
operation
as
well. Perpendicular
to
this axis
is the
direc-
tion
in
which fasteners
are
installed. These observations
probably
reflect
the
Cartesian nature
of the
architectures
of
the
machine tools used
to
make
the
parts.
15.E.1.b.
Simplification Methods
As
noted earlier
in
this chapter,
a
major
effort
of DFA is
product
simplification. Simpler products have fewer parts,
which means fewer assembly operations, workstations,
factory
space,
and
workers.
In
addition, each part repre-
sents
design
effort
and
overhead. Whether simpler/fewer
always
means less expensive
is a
separate issue discussed
below.
While most researchers
and
practitioners
of DFA un-
derstand
the
desirability
of
reducing
the
number
of
parts,
only
the
Boothroyd method presents
a
systematic
ap-
proach
to
doing this.
The
idea
is to
subject
each
part
to
three criteria that might
justify
its
inclusion
in the
product,
and
eliminate
any
part that
fails
the
criteria.
394
15
DESIGN
FOR
ASSEMBLY
AND
OTHER
"ILITIES"
FIGURE
15-9.
Census
of
Assembly Operations
and
Their Directions.
The
conclusions
to be
drawn from these data must
be
tempered
by the
fact that they were gathered
in the
middle
1970s.
Product design methods
and
product materials have
changed greatly since that time
but no
study comparable
to
this
has
been repeated since. ([Kondoleon])
FIGURE
15-10.
Summary Census
of
Assembly Operations.
([Kondoleon])
15.E.
DFx
IN
THE
LARGE
395
The
three criteria
are as
follows ([Boothroyd,
Dewhurst,
and
Knight]):
1.
During operation
of the
product, does
the
part move
relative
to all
other parts already assembled? Small
motions that could
be
accommodated
by flex
hinges
integral
to the
parts
are not
counted.
2.
Must
the
part
be of a
different
material
or be
isolated
from
all
other parts already assembled?
3.
Must
the
part
be
separate
from
all
other parts
al-
ready assembled because otherwise
the
assembly
or
disassembly
of
other
separate
parts
would
be
impossible?
Unless
at
least
one of
these questions
can be
answered
"yes"
for a
part, that part theoretically
can be
combined
with
another part
or
eliminated entirely. This criterion
is
applied ruthlessly using main product
functions
as the fo-
cus.
Thus,
for
example,
all
separate fasteners
are
auto-
matically
flagged as
theoretically unnecessary.
The
effect
of
part consolidation
on
part cost
is
evaluated separately
using
DFx in the
small.
It is not
expected that
the
theoret-
ically unnecessary parts will really
be
eliminated because
other criteria
for
performance
or
manufacturability might
be
affected.
The
purpose
of the
exercise
is to
focus atten-
tion
on
necessity.
The
assembly
efficiency
metric
is
calculated
as
follows:
(theoretical
minimum
Assembly
_
number
of
parts)
efficiency
~~
* 3
sec/part
(15-2)
estimated assembly time
including
all
parts
In
this metric,
an
assembly time
of 3
seconds
per
part
is
assumed, based
on an
ideal assembly time
for a
small part
that
presents
no
difficulties
in
handling, orienting,
and in-
serting. Thus
the
numerator represents
an
ideal minimum
assembly
time
for a
relatively simple manually assem-
bled product that contains only those parts that survive
the
three
questions
listed above.
The
denominator
repre-
sents
the
actual assembly time
of the
current
or
modified
design.
Typical products that
are
ripe
for
part count reduc-
tion
often
have assembly
efficiencies
on the
order
of 5% to
10%
while efficiencies after reduction analysis
or
redesign
are
typically
on the
order
of
25%.
An
assembly
efficiency
of
or
near 100%
is
unlikely
to be
achieved
in
practice.
This
finding
implies that other valid reasons beyond those
listed
in the
three questions above intervene
to
prevent
parts
from
being eliminated. Considering
the
issues raised
in
Chapters
12
and 14,
this should
be no
surprise.
FIGURE
15-11.
Plastic Injection Molded Part. This
part
goes into
a
domestic
hot
water heating system
and has
dozens
of
features
on it. It is
about
1.5"
high.
Its
mold
clearly
took
a
long time
to
develop.
It
utilizes "hollow core"
molding,
which
involves
folding
and
moving
mold
core
parts.
Such
a
part
will
not be
economical unless
it is
made
in
very large
quantities. (Poschmann Industrie-Plastic
GmbH
& Co KG.
Photo
by the
author.)
Some
of the
products used
as
part-count-reduction
examples
in the DFA
literature
may
appear ridiculous
at
first
sight. These typically
are
rich
in
threaded fasteners,
including
washers
and
nuts. Each screw/washer/nut
set
counts
as
three parts that
are
automatically eliminated,
driving
down
the
assembly
efficiency.
As
Boothroyd
points
out, some
of
these products look like model shop
prototypes that were
put
directly into production with-
out any
attempt
to
design them
for
production
efficiency.
Anecdotally, fasteners seem
to
account
for low
assembly
efficiency
in
many
cases.
6
Eliminating them
is
thus
an
easy
way to
boost
the
score.
The
pros
and
cons
of
mod-
ifying
or
eliminating fasteners
are
discussed later
in
this
chapter.
Today,
many products exhibit evidence
of
careful
at-
tention
to
structure
and
part consolidation.
As
reflected
in
the
examples
in
Section
15.F,
even quite modest con-
sumer products contain injection molded
or
stamped parts
of
high quality, exquisite tolerances,
and
complex features.
See
Figure
15-11
for a
picture
of one
such part. This
is
the
result
of
recent progress
in
development
of
stamping
methods
as
well
as of new
polymer materials having high
strength,
low
shrinkage,
and
high-dimensional stability
over time. Examples include
the
casings
of
electric drills
6
Ken
Swift,
University
of
Hull, personal communication.
396
15
DESIGN
FOR
ASSEMBLY
AND
OTHER
"ILITIES"
and
screwdrivers, covers
of
cell
phones
and
computers,
and
interior
components
of
automobiles. Design
of
these
items
and
their molds
is
supported
by
three-dimensional
CAD
models
and
simulation
of the flow of
molten plastic
into
the
molds.
Nevertheless, there
are
many case studies across
a
range
of
industries that show
an
average
of
about
45%
part count
reduction ([Boothroyd, Dewhurst,
and
Knight],
[Swift
and
Brown],
[Swanstrom
and
Hawke]).
15.E.1.C.
Tradeoffs
and
Caveats
Application
of DFx in the
small subjects each part
to
scrutiny
separately while
DFx in the
large summarizes
the
appropriateness
of the
product
as a
whole through metrics
like that
in
Equation (15-2). Blind adherence
to the
"rules"
and
"metrics"
of
DFA, however,
is not
recommended.
In-
stead, these methods should
be
used
in
combination with
other
criteria.
In a
number
of
situations,
the
right thing
to
do
is not
what
the DFA
analysis recommends. This section
contains some comments
and
examples.
15.E.I.c.l.
General Considerations.
We
noted
at the be-
ginning
of the
chapter that parts costs greatly
exceed
as-
sembly costs.
For
this reason,
DFA
must
be
accompanied
by
DFM. Naturally,
any
choice
of
manufacturing
method
and
material
must
deliver
the
required functionality,
reli-
ability,
durability,
and
appearance.
DFM is a
huge topic
with
a
rich literature that
we
cannot address
in
this book.
[Boothroyd, Dewhurst,
and
Knight] presents methods
for
estimating
the
cost
of
making cast, molded, stamped,
and
powder metal parts. [Ostwald
and
McLaren] gives meth-
ods for
estimating
process
costs
for a
variety
of
processes
based
on
given hourly operating costs
for
machines.
[Hu
and
Poli]
describes
a
method
of
comparing
the
cost
of
stamped,
molded,
and
assembled
parts based
on
guaran-
teeing
functional
equivalence feature-by-feature. [Esawi
and
Ashby]
describes
the
Cambridge Process Selector,
which
searches
for
good candidate
processes
based
on
preliminary part information early
in
design. Extensive
analysis
and
testing
are
required
to
compare
different
ma-
terials
and
processes
for
making "the
same"
part.
The
Boothroyd method
as
presented above applies
to
manual assembly.
If
automatic assembly
is
contem-
plated,
then
a
different
set of
criteria,
codes,
and
operation
times must
be
used. These
are
available
in
[Boothroyd,
Dewhurst,
and
Knight].
Unfortunately,
it is
often
difficult
to
know which method
of
assembly will
be
used.
A new
product
might begin
life
assembled manually
and
could
be
switched
to
automatic assembly
if it
becomes
a
market
success.
Rarely
is
there
an
opportunity
to
redesign
it at
this
stage because
the
effort
is
directed
at
getting
as
many
units
of the
original design
out the
door
as
possible.
Second,
any DFA
method
requires
that
a
nominal
as-
sembly sequence
be
chosen, because assembly
difficulty
often
depends
on
which other parts
are
present when
a
given part
is to be
installed.
In
many
cases,
little
guidance
is
provided regarding
how to
select
an
assembly sequence.
Often
one is
advised
to
"pick
the
base
part."
It may not be
obvious which part this
is,
although [Redford
and
Chal]
recommends that special design
effort
be
devoted
to be-
ing
sure that every product
has
one. Properties
of a
good
base part include being wide enough
to
provide
stable
support
and
being well enough toleranced
to
function
as
an
assembly
fixture. The
casing
of the
Denso panel
me-
ter
meets
these
criteria.
On the
other hand,
as we saw in
Chapter
7,
many quite attractive assembly sequences
be-
gin
with parts that would
not be
chosen
as the
base, such
as
the
rotor
nut on the
automobile alternator.
This
part
was
chosen
in
order
to
permit vertical assembly with
no
reorientation
of the
product during assembly.
Third, assembly
difficulty
is not
easy
to
predict,
and
many
ways exist
to
reduce
it. As
noted above,
people
get
better
as
they practice,
and a
difficult
task
can
often
be
made easy with
the
provision
of a
simple
tool.
Until
one
actually
has the
parts
in
hand
and is
able
to try
assem-
bling
them,
it is
difficult
to
know
for
sure what will
be
easy
and
what will
be
difficult.
Furthermore, many
oper-
ations
that
are
easy
for
people (turning
the
assembly over
or
quickly determining
if a
part
is
suitable
for
use)
are
dif-
ficult,
expensive,
or
impossible
for
machines.
Similarly,
many
operations that
are
difficult
for
people
are
easy
for
machines,
such
as
picking
up
little parts with tweezer-
like
end
effectors, placing integrated
circuits
to
within
0.01
"tolerance
at the
rate
of 6 per
second,
and
tighten-
ing
fasteners
to an
exact torque every time. Thus,
DFA
analyses
are
predictions
at
best.
Recent
research,
such
as
[Gupta
et
al.],
applies
virtual
environments
to
help predict
assembly problems.
In
addition,
we saw in
Chapter
8
that
eliminating
and
consolidating parts
can
deprive
the
assembly process
of
needed
adjustment
opportunities. Depending
on the in-
dustry,
its
cost structures,
the
skill
of its
assemblers,
the
variation
in the
parts,
and the
time available
for
each
as-
sembly operation,
it may be of
advantage
to
permit
adjust-
ments
or it may not be.
Each
case
needs
to be
evaluated
carefully.
15.E.
DFx
IN
THE
LARGE
397
FIGURE
15-12.
Redesign
of
Automobile Interior
Arm
Bracket.
Top
left: Existing
design,
requiring
several
parts,
fixtures,
and
assembly
operations.
Top
right:
New
bracket.
Bottom:
New
armrest
with
bracket
molded
in.
(Courtesy
of
Munro
and
Associates.
Used
by
permission.)
15.E.1.C.2.
Does Consolidating Parts Really Save
Money?
More deeply,
it is
clear that consolidating parts
makes them more complex. Boothroyd
and
other prac-
titioners
of
DFA, including Sandy Munro
of
Munro
and
Associates,
are firmly
convinced that
fewer
but
more com-
plex parts
add up to a
less expensive product
due to
lower
parts costs
and
lower assembly costs.
The
true condi-
tions must
be
evaluated
individually
for
each part
and
product.
Sometimes
the
consolidated design
is
totally
different
from
the
original. Developing
it
requires intimate knowl-
edge
of
materials
and
process technologies.
An
example
appears
in
Figure
15-12.
Not
only
is the
metal bracket
transformed
to a
single stamping,
but the
armrest itself
is
molded integrally with
the
bracket.
Its
shape
is
created
in
part
by
injecting
gas
into
the
sides during molding.
[Boothroyd, Dewhurst,
and
Knight] presents equations
permitting
one to
estimate
the
number
of
hours needed
to
fabricate
an
injection mold. Factors that
influence
the
time
include
the
area
and
volume
of the
part,
the
number
of
features
such
as
surface patches, holes
and
depressions,
and
tolerances
and
surface
finish.
Most
of
these factors
affect
mold development time linearly,
but
complexity
in
terms
of
features
is
estimated
to
increase mold develop-
ment time
by the
power
of
1.27. Figure 15-13 shows
the
results
of
calculating mold development time
for the
fol-
lowing problem: Given some number
of
separate
parts
of
given
complexity,
is it
better
in
terms
of
mold development
time
to
make
a
separate
mold
for
each part
or to
combine
the
parts
and
make them with
one
mold? Naturally,
the
combined part
is
more complex.
If the
individual parts
are
sufficiently
complex themselves,
the
nonlinear factor
398
15
DESIGN
FOR
ASSEMBLY
AND
OTHER
"ILITIES"
FIGURE
15-13.
Cost
Versus
Complexity
of an
Injection Mold. Hypothetical parts with different degrees
of
complexity
are
considered
as
candidates
for
consolidation,
and the
number
of
hours
to
develop
the
mold
is
calculated
using equations
in
[Boothroyd,
Dewhurst,
and
Knight].
These equations include factors
for
estimating
the
complexity
of a
part. Each pair
of
lines
in
the
chart compares time
to
make separate molds versus time
to
make
one
mold that makes
a
combined
part.
If the
parts
are
not
very
complex, then
it is
always better
(in
terms
of
mold development time)
to
consolidate them.
If
they
are
complex,
then there
is a
maximum number that should
be
consolidated,
above which
it is
better
to
create separate molds
for
each one.
This
number
is
lower when
the
parts
are
individually more complex.
The
chart
is
illustrative only,
and a
similar analysis would
have
to be
made
in any
real
situation.
by
which complexity
influences
development time will
sooner
or
later make
the
combined-part mold take longer
than separate molds.
The
study
in
Figure 15-13
does
not
include
alternate strategies like combining only some
of
the
parts,
but
rather only compares
all
versus none.
It is
illustrative
only,
and
each real case must
be
evaluated
on
its
own
merits.
[Hu
and
Poli]
presents
a
more refined
cost
model
that
includes material
and
assembly costs
for the
parts
as
well
as
tool development cost. This part fabrication model esti-
mates total cost
by
summing
the
cost
of
creating each fea-
ture
on the
part.
The
model
is
linear
and
does
not
contain
an
explicit measure
of
complexity.
It
concludes, contrary
to
Figure 15-13, that there
is
always
a
number
of
parts
to
be
combined above which
it is
cheaper
to
combine them
than
to
make them separately
and
assemble them.
[Fagade
and
Kazmer] expands
the
scope
of
analysis
to
include time
to
market
and
long term profit. This model
is
based
on
statistical analyses
of
price quotes
and
delivery
times
from
mold vendors
on a
variety
of
parts. While each
proposed consolidation must
be
evaluated
on its
merits,
the
research concludes that
the
three criteria
for
part con-
solidation given
by
Boothroyd must
be
augmented. Plastic
injection-molded parts
may be
consolidated
unless
• The
consolidation
does
not
reduce
the
number
of
tools,
• The
parts have vastly
different
quality requirements,
• The
design process
is not
certain
of
delivering
the
product
and
there
is
significant
sales cost sensitivity,
and
• The
manufacturing processes
are not
capable
of
delivering high yields
of
complex products
These conclusions
are
consistent with those
of
[Ulrich,
Sartorius,
Pearson,
and
Jakiela].
If
the
product must meet
criteria
for
repair,
recycling
or
reuse, then other factors
must
be
considered.
For
example,
15.E.
DFx
IN
THE
LARGE
399
FIGURE
15-14.
Glass-Filled
Nylon (PA-66)
Injection-
Molded Parts
for a
Home
Hot
Water System. These parts
are
members
of a
product
family
that
allows
a
heating
con-
tractor
to
customize
a
home
hot
water system
to the
cus-
tomer's
needs.
The
parts
share common exterior
and
interior
diameters
as
well
as
axes where fasteners
are
inserted.
(Courtesy
of
Poschmann
Industrie-Plastic
GmbH
& Co KG.
Photo
by the
author.)
parts that
are
subject
to
wear should
be
separate,
low
cost,
and
easy
to
remove
and
replace.
An
example
of
real parts with real mold time
and
cost
data, consider
the
parts
in
Figure
15-14.
These parts
go
into
home
hot
water systems
and are
designed
so
that they
can
be
combined
in
many ways
to
configure custom systems.
The
diameter across
the
fastener diagonal
is 10 cm.
These
parts sell
at
wholesale
for
about
$2.00
to
$6.00
each. They
are
very complex, including curved internal passages that
are
created using
a low
temperature melting point bismuth
alloy mold insert (see Figure
15-15)
that
is
later washed
out
of the finished
part using
hot
oil.
The
molds take
6
to 8
weeks
to
design
and 4 to 12
months
to
bring
to
their
final
state, able
to
deliver parts with tolerances around
±0.2
mm. One of
these molds
can
cost
from
$100,000
to
as
much
as
$500,000.
7
7
Information
provided
in
2000
by
Andreas Meyer
of
Poschmann
Industrie-Plastic
GmbH
& Co KG of
Germany,
the
company that
makes
the
molds
and the
parts. Meyer estimates that doubling
the
number
of
features
on a
part
can
triple
the
design
and
tryout
time
for
a
mold.
FIGURE
15-15.
Low
Melting Point Bismuth Alloy Lost
Core.
(Courtesy
of
Poschmann
Industrie-Plastic
GmbH
&
Co
KG.)
15.
E.I.
c. 3. Is It DFA or
Product Redesign? More deeply
still,
it may not be
obvious where modifying product struc-
ture stops being
a DFA
activity
and
begins
to
resemble
redesign.
As an
example, consider
the two
pump designs
shown
in
Figure 15-16. This
figure
illustrates
use of the
Lucas/University
of
Hull
DFA
method.
It is
similar
in
many
ways
to the
Boothroyd method
in
that
it
calculates
a
number
of
metrics based
on
deciding which parts
are
really
functionally
necessary
and
which
are
not.
The
met-
rics compare time
or
effort
devoted
to
"unnecessary" parts
relative
to
that devoted
to the
necessary ones.
But
this
figure
shows something else, namely that
the
two
pump designs
do not
operate
the
same way.
The
path
taken
by the
pumped
fluid is
different,
the
style
of
valve
is
different,
and
external piping
and
packaging arrange-
ments
are
different.
In one
case
the
volume above
the
piston
fills
with
fluid
while
in the
other case
it
does not.
This means that
the
seals around
the
piston
rod are
cru-
cial
in one
design
and
negligibly important
in the
other
design.
Each design
is
likely
to
exhibit
different
failure
modes. This
is not to say
that
the new
design
is not a
good
one but
rather
to
point
out
that much more differentiates
the two
designs than mere application
of DFA
rules
and
metrics.
In
general,
DFA
must take
its
place
among
all
the
other pressures exerted
on
product design,
and DFA
recommendations must
be
weighed against other factors.
15.E.1.C.4.
The
Role
of
"Product
Character".
Finally,
it
is
likely that consumer
and
industrial products will pro-
vide
different
opportunities
for
DFx. Consumer products
like
food mixers
and can
openers
are
subject
to
much less
stringent performance
and
durability requirements than
are
industrial components like automobile transmissions
400
15
DESIGN
FOR
ASSEMBLY
AND
OTHER
"ILITIES"
FIGURE
15-16.
Pump Redesign Example. Close inspection
of the
before
and
after pump designs shows several functional
and
application
differences.
For
example,
the
fluid
paths,
shown
by
heavy hollow arrows,
are
different
in the two
designs.
This
example illustrates
use of the
Lucas/University
of
Hull
DFA
methodology. This methodology judges
the
value
of
keeping
a
part
in the
product based
on
three different metrics: design efficiency (similar
to the
Boothroyd
assembly efficiency,
the
ratio
of
the
total
number
of
parts
to the
number
of "A"
parts,
the
latter
being
the
functional minimum),
feeding
and
handling
ratio
(ratio
of
total feeding effort
to
that needed
to
feed only
the A
parts,
and the
fitting ratio (ratio
of
time needed
for all
assembly
operations
to
that needed
for the A
parts). ([Redford
and
Chal].
Copyright
©
Alan Redford. Used
by
permission.)
and
aircraft
engines.
A
home handyman's electric drill
will
get as
much
use in a
year
as a
professional carpenter's
drill will
get in a
single day.
For
such reasons, design-
ers
will
choose materials, part boundaries,
and
fasteners
much
more
carefully
for an
industrial product.
The
result
is
that
opportunities
for
part consolidation
and
elimination
of
fasteners will
be
fewer.
Table 15-6 summarizes several factors
to
consider
when
deciding whether
or not to
consolidate parts.
15.E.1.d.
Fastening
Choices
As
noted above, fasteners
are the
chief targets
of
part count
reduction.
One of the
motivations
for
this
was the
belief
in
the
1970s that threaded fasteners took
a
long time
to
15.E.
DFx IN THE
LARGE
401
TABLE
15-6.
Factors
to
Consider
Regarding
Parts
Consolidation
Consolidation
Differentiation
Supports functional drivers requiring integrity, absence
of
interfaces,
absence
of
fasteners
Complex
design process:
KCs
must
be
achieved
by
means
of
fabrication
process design
and
execution
Material selection
is
crucial
Design must accommodate
the
most demanding requirement
Larger, heavier parts
Fewer assembly steps, more reliance
on
fabrication
processes
to
create
quality
Fabrication
tooling is
more expensive
and
takes longer
to
develop
Complex
fabrication processes
Many features
are
created
at
once
Requires
care
in
defining
location
and
orientation
of
split planes
Reduces "fixed" design
and
management costs like parts management,
logistics,
contracts, etc., that grow
with
the
number
of
parts
regardless
of
their complexity
Process yield
is
crucial
for
large
or
complex parts;
failure
creates
expensive
scrap (microprocessors, thermoset
aircraft
assemblies)
or
inconvenient meltdown (metals, thermoplastics)
Supports
business drivers requiring substitution, differentiation,
and
modularity
Supports
adjustment
to
achieve
KCs
Permits multiple materials
and
other opportunities
for
design
refinement
Each part
can
meet
its own
requirements, including need
for
periodic
replacement
or
support
for low
cost reuse
More parts, longer assembly
line
More assembly steps, more reliance
on
assembly processes
to
create quality
Lower-cost fabrication tooling
may be
attractive
for low
volume
production
Fabrication
and
assembly steps
can be
interspersed
on the
assembly
line
to
achieve differentiation, adjustment,
better
tolerances
Each
feature
can
have
its own
material,
fabrication
process, surface
finish,
tolerance, etc.
Saves
on
costs associated with part complexity such
as
time
to
design
and
prove
out
complex production
tooling
Process yield risk
is
distributed over
many
parts;
high
risk
can be
concentrated
on one or a few
parts,
and
assembly
can use
tested
good parts
install
and
that installation
was
error-prone.
Whether that
was
true
or not at the
time,
it is
less true today. Auto-
matic
screw
insertion
machines
and
powered
hand
tools
are
available that
are
very
fast
and
reliable,
and
usually
include
automatic
feeding
of
each
screw
and
sensing
of
the
correct torque. Even though
it is
still
a
good idea
to
examine
a
design
to see if
parts
can be
eliminated
or
con-
solidated, fasteners
may be a
less tempting target than they
were
in the
past.
Many
fastening alternatives exist. These include
screws,
screws with washers already attached, self-tapping
screws (especially
useful
for
fastening plastic
and
soft
metal
parts),
rivets,
adhesives, welding, crimping, heat
or
ultrasonic staking,
and
snap
fits.
Each
of
these
has its
advantages
and
disadvantages,
some
of
which
are
listed
in
Table 15-7.
Generally,
welding,
screws,
and
rivets
are
preferred
for
joints subjected
to
large loads
in
products such
as
machin-
ery, autos, aircraft,
bridges,
and
buildings. Attempts
to
reduce
the
number
of
fasteners
in
major machinery joints
in
the
name
of DFA
have been known
to
cause catas-
trophic
failure.
8
A
typical screw joint
in a
simple consumer
?
Ken
Swift, University
of
Hull, personal communication.
product might have four screws
at 90°
intervals while
one
in
a
machine tool, aircraft engine,
or
construction crane
will have fasteners densely
spaced
no
more
than
two or
three fastener diameters apart around
a
bolt circle.
The
purpose
of
this
tight
spacing
is to
avoid
large
differences
in
contact stress between material under
the
bolt heads
and
material
between
them.
Properly spaced screws
and
rivets,
or
adhesives,
may
be
superior
to
other
joining
techniques
if
there
is a
need
to
keep
two
surfaces
flat and
tight against each other. This
can
be
necessary
to
seal
against
leaks
or to
prevent buzzing
noises caused
by
vibration inputs.
In
summary,
choice
of
fastening
method
is
influenced
by
many factors, only
one of
which
is
assembly time
or
cost.
It is not
always
possible
to
consolidate
parts,
so
fas-
teners will
be
with
us for the
foreseeable
future.
15.E.2.
Use of
Assembly
Efficiency
to
Predict
Assembly
Reliability
The
Hitachi AREM predicts assembly reliability
by
examining
and
evaluating individual assembly operations.
[Boothroyd, Dewhurst,
and
Knight] reports data from
Motorola showing that products with higher assem-
bly
efficiency
have fewer defects
per
million parts.
402
15
DESIGN
FOR
ASSEMBLY
AND
OTHER
"ILITIES"
TABLE
15-7.
Advantages
and
Disadvantages
of
Different
Kinds
of
Fastening
Techniques
Fastening Method
Enablers
or
Advantages
Threaded Fasteners
Rivets
Welding
Heat staking, ultrasonic
welding
Adhesives
Snap fits
Strong
Strength
or
tightness
can be
tested
on
each
one as it is
installed
Reversible
(good
for
recycling
and
repair)
Strong
Will
not
vibrate loose
Same
as
rivets
Strong,
good
for
thermoplastics
Strong
Works
on
dissimilar materials
Fast assembly
Requires
parts made
of flexible
material
User cannot disassemble easily
but
repair
or
recycling
is
easy with
the
right tools
Can
take
3 sec
each
Installing
several
at
once requires
a
special tool
Can
vibrate loose
Must
be
drilled
out or
otherwise destroyed
to
enable disassembly
Requires
same material
on
both parts
Does
not
work
well
on
some materials
(e.g.,
aluminum)
Must
be
destroyed
to
enable disassembly
Must
be
destroyed
to
enable disassembly
Could
be
deteriorated
by
chemical attack
or
time
Suitable
for
small products
not
subject
to
large
loads
May
take
up
more space than screws
for the
same
required
strength
[Beitler, Cheldelin,
and
Ishii]
expands
on a
method from
[Hinckley] that predicts
the
fraction
of
defective products
using
the
same
data
as
used
to
calculate
assembly
ef-
ficiency.
While Hinckley used
the
Westinghouse
DFA
calculator ([Sturges])
to
obtain assembly operation time
estimates,
the
basic
idea
is the
same.
Hinckley discovered that
a
factory's defect fraction
could
be
predicted
by
calculating
the
difference
between
the
actual assembly
time
and the
theoretical
assembly
time
based
on the
actual number
of
operations. [Recall that
as-
sembly
efficiency
as
defined
by
Equation
(15-2)
is the
ratio
of
theoretical
assembly
time
using only theoretically nec-
essary
parts
to the
actual assembly
time.]
Hinckley called
this
the
complexity factor
and
calculated
it as
CF
=
TAT
-
TOP
* t
(15-3)
where
CF is the
complexity factor,
TAT is the
actual
as-
sembly time,
TOP is the
total number
of
assembly opera-
tions,
and t is
some nominal ideal operation time.
Hinckley took data
at
several factories
on a
number
of
different
assemblies
and
their defect rates. When each
factory's
data were plotted
on a
log-log
scale,
he
found
a
good straight line with
a
slope
of
about 1.3.
An
illustrative
chart
of
such data appears
in
Figure
15-17.
Hinckley used
a
baseline value
of t =
1.4
sec for
each
individual
operation,
but any
convenient value will
do.
FIGURE
15-17.
Notional
Data
Illustrating
Equation
(15-3).
Each
square
or
diamond
represents
one
factory's
defect
rate
on an
assembly
with
the
complexity
factor
shown.
([Beitler,
Cheldelin,
and
Ishii])
The
idea
is
that
if
operations take longer than
the
baseline
time, there
is an
increased chance that
a
mistake will
be
made.
While
this
is not in
itself surprising,
the
consistency
of
the
data
is
surprising
and
potentially
useful.
If
one
wants
to
predict
the
defect rate
of a new as-
sembly
in a
given factory whose defect rate
on
other
similar assemblies
is
known, then this method allows
such
a
prediction.
If one
wants
a
better defect rate than
that factory
can
deliver,
one can use a
different factory
with
a
better defect rate
for
such assemblies,
or one can
attempt
to
redesign
the
product
to
reduce
the
lengthy
operations.
15.E.
DFx
IN
THE
LARGE
403
15.E.3.
Design
for
Disassembly
Including
Repair
and
Recycling
(DfDRR)
Disassembly
for
repair
or
recycling
was
always
an im-
portant part
of DFA but has
risen
in
importance
in
recent
years.
In
some European countries, laws require manu-
facturers
to
take back their products
at the end of
their
useful
life
and
recycle them. Regardless
of
legislation,
it
is
economical
to
recycle many products,
and
indus-
tries exist
to do
this.
By
weight,
85% of
automobiles
are
recycled.
However,
the
practicality, scope,
and
economics
of re-
cycling
are
heavily affected
by
choice
of
materials
and
fastening
techniques.
Thermoset
plastics cannot
be
melted
down
for
reuse,
and
thermoplastics
with
imbedded
fibers,
such
as
used
in the
parts
in
Figure
15-14,
cannot
be
recy-
cled
many
times
because
recycling involves chopping
the
parts into little pieces. Each cycle cuts
the
fibers,
and at
some point they
are too
short
to
function
properly. Liquid
aluminum
easily dissolves
a
number
of
impurities that
spoil
its
ability
to
function.
Therefore, aluminum can-
not
be
recycled unless
all
other materials
are
separated
out first.
Snap
fits are
convenient
for
assembly
but can
cause problems
for
disassembly. Rivets
and
adhesives
are
even
more problematic.
Not
only
are
they
difficult
to re-
verse,
but
they
are
often
used
to
join dissimilar materials
that
cannot
be
recycled unless they
are
separated.
If
parts
joined this
way are
ripped apart,
the
parts themselves
may
rip,
and
portions
of one
will remain attached
to the
other.
For
these
reasons, design
for
disassembly
and
recycling
is
subject
to
many more
conflicting
forces than
is
conven-
tional DFA.
One
approach
to
DfDRR
is
classification
and
coding
in
the
spirit
of
DFA.
[Kroll
and
Hanft]
is
typical
of
this
approach.
It
identifies
four
cost drivers
in
determining
if
a
product
is
easy
to
disassemble:
•
Accessibility—is
there clearance
to
insert
the
neces-
sary
tool
or
hand?
•
Positioning—how
accurately must
the
tool
or
hand
be
positioned
in
order
to
remove
the
part (grabbing
and
yanking
is
easier than positioning
a
tool)?
•
Force—how
much force
is
needed (less
is
better
and
some fastening
methods
require
more
force
to
reverse
them
than
others)?
•
Basic disassembly
time—each
operation
has its own
estimated time.
The
basic operations
are
unscrew, remove, hold/grip,
peel, turn,
flip,
saw, clean, wedge/pry, deform, drill, grind,
cut,
push/pull,
hammer,
and
inspect.
The
difficulty
of
each task
is
estimated
for
each part
in
the
product, based
on the
difficulty
presented
by
each
of
the
cost drivers.
Difficulty
scores range
from
1 to 10,
and
the
time
to do a
disassembly operation
in
seconds
is
estimated
to be
1.04
*
(difficulty
— 1) +
0.9*
(number
of
hand
and
tool operations).
A
reference score
can be
calculated
by
estimating
the
time
to
disassemble
the
prod-
uct
if
Boothroyd's rules
for
consolidating parts
are ap-
plied. Thus both
the
time
to
disassemble
and the
sources
of
"unnecessary"
disassembly time
can be
estimated.
Another approach
to
DfDRR
is
process-based. [Kanai,
Sasaki,
and
Kishinami]
describes
a
method
for
graphi-
cally
representing
the
process alternatives
for
disassem-
bling, shredding,
and
recycling
a
given
design.
It is
based
on
an
extended assembly model
of the
type described
in
Chapter
3. A
comprehensive model
of
this type permits
computer algorithms
to
make evaluations
of the
kind
de-
scribed
in
[Kroll
and
Hanft]
as
well
as to
search
for the
lowest
cost process combinations.
The
model represents
the
following issues:
•
What
the
parts
are
made
of
•
What fastening methods
are
used
•
Whether
any
part
or
subassembly
can be
reused
This information
is
used
to
decide
if
further
disassem-
bly
of any
item
is
needed
or
whether
the
resulting item
can
be
reused whole
or
shredded whole. This question
is
asked
recursively,
starting
from
the
whole product
and
work-
ing
down.
Feasible
disassembly sequence
and
method
choices
are
evaluated based
on
whether
the
disassembled
items would
be
rendered
unusable
or
unrecyclable
by a
chosen process.
The
logic
of the
search
is
diagrammed
in
Figure
15-18.
A
search routine
is
used
to
look
for a
sequence
of
disassembly
steps that maximizes
the
"weight
fit
ratio"
defined
as
Weight
fit
ratio
= %
of
parts
by
weight that
can
be
treated properly
using
the
minimum total number
of
operations, where
"treat"
means reuse, recycle,
or
dispose,
and
"properly"
means,
for
example, that
a
reusable
part
can
really
be
reused
and is not
recycled
or
dumped instead.
"Oper-
ations"
include disassembling, sorting,
and
shredding.
A
cross-plot
of
weight
fit
ratio versus total number
of
404
15
DESIGN
FOR
ASSEMBLY
AND
OTHER
"ILITIES"
operations
reveals
the
desirability
of a
process plan,
as
indicated
in
Figure
15-19.
Figure 15-20, Figure 15-21,
and
Figure 15-22 illus-
trate
the use of
this method
on a
simple Sanyo electric
shaver.
If all
parts must
be
reused, then
the
best process
that
can be
found
has a
weight
fit
ratio
of
about
50%
after
about
150
operations. Further operations cannot improve
the
ratio. This means that
the
product
is not
well suited
for
reusing every part, even though that
is a
desirable
goal.
By
contrast,
a
less ambitious goal
is
simply
to
recycle
every
part.
In
this case,
the
weight
fit
ratio rises
to 80%
within
about
150
operations. Finally,
a
more nuanced goal
FIGURE
15-18.
Options
for
Planning
the
Reuse, Recycling,
and
Disposal Process.
FIGURE
15-19.
Cross-Plot
of
Weight
Fit
Ratio
E
w
and
Number
of
Operations
E
p
.
Better process plans
have
a
steeply
rising cross-plot that approaches
100%
while worse ones
have
a
slowly rising plot that falls short
of
100%.
The
former
suc-
ceeds
in
deploying each part
to its
desired final state
in a
small number
of
operations while
the
latter spends time
but
sends
many
parts
to the
wrong destination (recycled
or
dumped instead
of
reused,
for
example). ([Kanai, Sasaki,
and
Kishinami].
Courtesy
of S.
Kanai. Used
by
permission.)
15.E.
DFx
IN
THE
LARGE
405
that
calls
for
reusing
the
motor
and
battery, recycling
all
polymer parts
and all
metal parts over
10 g in
weight,
and
disposing
of the
rest scores
82%
within about
140
operations.
This method
can be
used
to
compare process goals
or
product designs
and can
indicate,
based
on the
cross-plot,
which
parts
or
operations
are
responsible
for
keeping
the
process
from
efficiently
meeting
the
goals.
FIGURE 15-20. Shaver Used
for
DfDRR Example.
([Kanai,
Sasaki,
and
Kishinami]. Courtesy
of S.
Kanai. Used
by
permission.)
FIGURE
15-21.
Left:
Product Structure
of
Shaver. Right:
Liaison
Diagram
of
Shaver,
"sa"
denotes
a
subassembly,
"p"
denotes
a
part, while
"c"
denotes
a
liaison.
([Kanai,
Sasaki,
and
Kishinami].
Courtesy
of S.
Kanai. Used
by
permission.)
Next Page
406
15
DESIGN
FOR
ASSEMBLY
AND
OTHER
"ILITIES"
FIGURE
15-22.
Two
Process
Plans
for
Disassembling
the
Shaver.
Left:
All
parts
must
be
reused.
In
this
case,
the
weight
fit
ratio
is
about
50%.
Right:
All
parts
must
be
recycled.
In
this
case,
the
weight
fit
ratio
is
about
80%.
"sa"
denotes subassembly,
"p"
denotes
part,
and
"f"
denotes
fragment
of a
part.
Fragments
result
from
shredding
or
arise
when
parts
are
ripped
apart,
leaving
a
fragment
of one
attached
to the
other.
([Kanai,
Sasaki,
and
Kishinami].
Courtesy
of S.
Kanai.
Used
by
permission.)
[Harper
and
Rosen]
provides
metrics
for
assessing
a
design
in
terms
of
refurbishing
and
remanufacturing.
In
remanufacturing,
a
product
is
disassembled, some
of its
parts
are
replaced,
and
others
are
repaired, still others
are
simply
cleaned
and
refinished.
Among
the
factors that they
identify
for
evaluating
the
recyclability
of a
product design
are
those given
in
Table 15-8.
15.E.4. Other Global Issues
Some companies develop their
own
DFA
methodologies
and
in so
doing
are
able
to
emphasize factors that particu-
larly
affect
their operations.
A
good example
is
Denso,
a
company that must
deal
with high volatility
in its
produc-
tion schedules
and
high variety
in its
products
([Whitney]).
As
we
have seen, Denso deals with these challenges dur-
ing
the
design
process
and
executes
its
solutions during
assembly.
Figure 15-23 shows
how
Denso approaches
one
aspect
of
DFA. Like other rational approaches, Denso's begins
with
a
cost analysis.
The
cost shown
in
this
figure
is
that
TABLE 15-8.
Factors
Entering
Refurbishing
Criteria
Number
of
theoretically
necessary
parts
Disassembly
time
Assembly time
Number
of
parts
Number
of
replaced parts
Number
of
tests
Testing
time
Cleaning score
Number
of
refurbished
parts
Number
of key
parts
Source: [Harper
and
Rosen].
FIGURE
15-23.
Cost
Analysis
of
Assembly
of
High
Variety
Products.
This
figure
shows
that
parts
preparation
(feeding
and
orienting)
costs
rise
faster
than
other
costs
as the
num-
ber
of
variants
of a
product
rises.
Denso's
production
is
par-
ticularly
highly
influenced
by the
need
to
handle
many vari-
ants.
Thus
its DFA
methodology
scores
parts
according
to
the
ease
with
which
feeders
can
switch
from
one
version
to
another.
(Courtesy
of
Denso
Co., Ltd.
Used
by
permission.)
Previous Page
15.F.
EXAM
RLE
DFA
ANALYSIS
407
(Ex.) High speed Coiling
of
Stator Core Adaptable
to
Three types
Stator
Core
e—Continuous
Coiling
Method
FIGURE
15-24.
Denso
Method
of
Making
Alternator
Stators
in a
Variety
of
Diameters
and
Lengths.
Denso
makes
alter-
nators
in
three
different sizes.
Both
diameter
and
stack
height
can be
varied easily.
Instead
of
stamping
flat
stator
core
plies
and
stacking
them
up,
Denso
winds
them
helically
from
straight
stock.
Fewer
fixtures
are
needed,
changeover
is
fast,
and
much
less
scrap
is
generated.
This
is one of
several
process
innovations
used
by
Denso
to
permit
flexible
manufacture
and
assembly
of
many varieties
of
alternator
on one set of
machines
in
response
to
orders
from
Toyota. (QDC
means
quick
die
change.)
Compare
this
method
of
dealing
with
different
power
levels
with
that
of
Black
&
Decker
discussed
in
Chapter
14.
Here,
Denso
varies
both
diameter
and
stack
length
whereas
Black
&
Decker
varies only
stack
length.
(Diagram
courtesy
of
Denso.
Used
by
permission.)
of
a
robot assembly station, presented
as a
function
of
how
many variants
of the
product this station
will
have
to
accommodate.
The figure
shows that
the
cost
of
parts pre-
sentation grows faster than
any
other cost component,
and
in
this example
it is
unprofitable
to
deal with more than
10
variants. Denso therefore includes
in its DFA
evalu-
ation
the
cost
of
switching
from
one
version
of a
part
to
another. This
cost
might
be
reduced
by
redesigning
the
part
or by
redesigning
the
product
as a
whole.
An
example
of
the
latter
is
shown
in
Figure 15-24.
15.F.
EXAMPLE
DFA
ANALYSIS
9
This product
is a
staple
gun
made
by the
Powershot Tool
Company,
Florham Park,
NJ, and
sold under
the
Sears
and
Powershot names.
See
Figure
15-25.
This
is a
heavy-
duty
product with rugged
and finely
made stamped metal
operating parts
and
well
finished
plastic exterior parts.
It
retails
for
$29.95
and is
made
in the
United States
at an
estimated annual production volume
of
500,000.
It is as-
sembled
manually. Figure
15-26
shows
an
exploded view
of
the
staple
gun
while Table 15-9
is a
parts list.
The
Boothroyd design
for
assembly (DFA) method
was
selected
for the
analysis
of the
staple gun.
Given
its
design
and
several
difficult
assembly oper-
ations,
the
appropriate assembly method
for the
current
9
The
material
in
this section, except
the
analysis
of the
low-cost
staple gun,
was
prepared
by MIT
students
Ben
Arellano, Dawn
Robison, Kris Seluga,
Tom
Speller,
and
Hai
Truong,
and
Technical
University
of
Munich
student Stefan
von
Praun. They used
a
previ-
ous
version
of
Boothroyd Dewhurst software
and
code numbers that
do not
align completely with those
in
Figure
15-1
and
Figure 15-2.
staple
gun
design
is
manual assembly.
The
analysis
be-
low
assumes
a
series
of
assembly stations, simple trans-
fer
lines
and
simple assembly
fixtures.
Manual assem-
bly
includes
the
gross motions
of
part selection
and the
fine
motions
of
part insertion
or
positioning. Parts
are
classified
using
the
terms alpha
and
beta
to
establish
the
end-to-end
and
rotational symmetry. Parts
are
eval-
uated
for the
ease
of
handling
relative
to
jamming, tan-
gling,
size,
flexibility,
and
slipperiness/sharpness.
These
parameters
are
used
to
classify
the
part handing
and
fas-
tening
type. Each classification
has an
associated time
with
penalties added
for
difficulty.
The
assembly labor
costs
can
then
be
determined
by
using
the
standard
as-
sembly hourly rate. Each
of
these analyses
is
described
below.
15.F.1.
Part
Symmetry
Classification
Parts
are
classified
by
alpha
and
beta symmetry. Alpha
is
the
angle through which
a
part must
be
rotated about
408
15
DESIGN
FOR
ASSEMBLY
AND
OTHER
"ILITIES"
FIGURE 15-26.
Staple
Gun
Exploded View.
an
axis perpendicular
to the
insertion axis
to
orient
it
correctly
for
insertion. Beta
is on the
angle through which
a
part must
be
rotated
about
the
axis
of
insertion
to
orient
it
correctly
for
insertion. Table 15-10 shows
the
symme-
try
categorization
of
each part
of the
staple gun.
The sum
of
alpha
and
beta determines
the
effect
of
symmetry
on
orientation
time.
15.F.2.
Gross
Motions
Gross motions
can be
defined
as the
selection
and
handling
of
the
part
to the
assembly
fixture.
They
can be
performed
quickly
and do not
require accuracy.
Table
15-11
shows
the
type
of
gross motions associated
with
each part assembly step
in the
staple gun.
FIGURE
15-25.
Photo
of
Powershot
Staple
Gun.
(Photo
by the
author.)
15.F.
EXAMPLE
DFA
ANALYSIS
409
TABLE
15-9.
Parts
List
for the
Staple
Gun
TABLE
15-10.
Alpha
and
Beta
for
Staple
Gun
Parts
Description
Part
Number
Shoulder
bolt-rear
Shoulder
bolt-center
Shoulder
bolt-front
Nylon
lock
nut-rear
Nylon
lock
nut-center
Nylon
locknut-front
Self-tapping
screw
Nose
piece
Right
side
plate
(metal)
Right handle
body
(plastic)
Left
side
plate
(metal)
Left
handle body (plastic)
Cassette
Staple
guide
Staple
guide
handle
Staple
advance
spring
Staple
advance
bracket
Anvil
Anvil
guide
(plastic)
Main spring
Pivot
arm
Lever spring
Dowel
pin
Lever
(metal)
Lever
handle (plastic)
Self-tapping screws
(2)
Staples
i
2
3
4
5
6
7
8
9
10
11
12
13
14
15
16
17
18
19
20
21
22
23
24
25
26
27
15.F.3.
Fine Motions
Fine motions
can be
defined
as the final
orientation
and
placement
of the
parts. They
need
a
high
level
of
accuracy
and
are
likely
to be
much slower than gross motions. Fine
motions
are
small compared
to the
part
and are
typically
a
series
of
controlled contacts
with
closed feedback loops
for
reorientation.
Table 15-12 shows
the
type
of fine
assembly motions
associated with each part assembly step
in the
staple
gun.
15.F.4.
Gripping
Features
In
the
staple gun,
all
gripping
of
parts
is
done
by
hand
(manually)
and in a
location that
is
perpendicular
to the
axis
of
insertion.
15.F.5.
Classification
of
Fasteners
There
are two
types
of
fasteners:
(1)
self-tapping screw
and
(2)
shoulder bolt
with
nylon lock nuts. There
are
three
Description
Part
Alpha
Beta
Shoulder
bolt-rear
Shoulder
bolt-center
Shoulder
bolt-front
Nylon
lock
nut-rear
Nylon
lock
nut-center
Nylon locknut-front
Self-tapping
screw
Nose
piece
Right
side
plate
(metal)
Right
handle
body
(plastic)
Left
side
plate
(metal)
Left
handle
body
(plastic)
Cassette
Staple
guide
Staple
guide
handle
Staple
advance
spring
Staple
advance
bracket
Anvil
Anvil
guide
(plastic)
Main
spring
Pivot
arm
Lever
spring
Dowel
pin
Lever
(metal)
Lever
handle
(plastic)
Self-tapping
screws
(2)
Staples
1
2
3
4
5
6
7
8
9
10
11
12
13
14
15
16
17
18
19
20
21
22
23
24
25
26
27
360
360
360
180
180
180
360
360
360
360
360
360
360
360
360
360
360
360
360
360
360
360
180
360
360
360
90
0
0
0
0
0
0
360
360
360
360
360
360
360
360
360
360
360
360
360
360
360
360
0
360
360
0
180
Note: Alpha
and
Beta
are
summed
to
determine
the
total reorientation restrictions
on
each part
for the
purpose
of
coding
handling
difficulty.
self-tapping
screws.
In
addition, there
are two
shoulder
bolts
of the
same
length
and one
that
is
slightly
longer.
15.F.6.
Chamfers
and
Lead-ins
The
only chamfers
are
located
on the
dowel pin.
The
cas-
sette
has
lead-ins
on the
keyway tabs
to
help manual
po-
sitioning.
The
right-
and
left-hand plates have
a
type
of
chamfer
that helps
to
guide
the
plastic guide handle
lo-
cator.
It is
surprising that
the
shoulder bolts
do not
have
chamfers
to
help locate them during
the
assembly process.
This should
be
considered
as an
assembleability design
improvement.
15.F.7.
Fixture
and
Mating
Features
to
Fixture
The
staple
gun can be
categorized
as a
Type
1 as-
sembly. However,
fixturing is
recommended
to aid in
preloading
of the
main spring
and to fix firmly the un-
secured parts during
the
assembly process. Otherwise
the
410
15
DESIGN
FOR
ASSEMBLY
AND
OTHER
"ILITIES"
TABLE
15-11.
Codes
for
Manual
Handling
Gross
Motions
for the
Staple
Gun
Code
00
04
08
09
30
36
38
80
88
First Digit: Symmetry
Each
part beginning
with
0 is of
nominal size
and
weight,
can be
grasped without tools,
and can
be
maneuvered with
one
hand. Part symmetry
is
<
360°
Each
part beginning with
3 is of
nominal size
and
weight,
can be
grasped without tools,
and can
be
maneuvered with
one
hand. Part symmetry
=
720°
Parts
severely nest
or
tangle
but can be
grasped
with
one
hand
Second
Digit:
Difficulty
Easy
to
grasp
with
thickness
> 2 mm and
size
> 15 mm
Easy
to
grasp
with thickness
< 2 mm and
size
< 6 mm
Difficult
to
grasp
with
thickness
< 2 mm and
size
> 6 mm
Difficult
to
grasp with thickness
< 2 mm and
size
< 6 mm
Easy
to
grasp
with
thickness
> 2 mm and
size
> 15 mm
Difficult
to
grasp with thickness
> 2 mm and 2 mm <
size
< 15 mm
Difficult
to
grasp
with
thickness
< 2 mm and
size
> 6 mm
No
additional grasping
difficulties:
a <
180, size
> 15 mm
Additional
handling
difficulties:
a =
360°,
size
> 6 mm
Note:
The
codes
in
this table correspond
to an
earlier version
of the
Boothroyd method
and
thus
do not
match
the
codes
in
Figure
15-1.
Nevertheless,
the
handling
times
are
similar.
TABLE
15-12.
Codes
for
Manual
Assembly
Fine
Motions
for the
Staple
Gun
Code
00
02
08
12
30
38
39
40
44
98
First Digit
Part
is
added
but not
secured immediately
and is
easily maneuvered into position
Part
is
added
but
part can't easily reach desired location
Part
is
secured immediately,
can
reach desired
location easily
and
tool
can be
operated easily
Part secured immediately, location cannot
be
reached easily
due to
obstruction
or
blocked view
Separate operation
after
parts
are in
place
Second
Digit
No
holding required, easy
to
align,
no
resistance
to
insertion
No
holding required, easy
to
align,
no
resistance
to
insertion
Holding
required,
not
easy
to
align,
no
resistance
to
insertion
No
holding required,
not
easy
to
align,
no
resistance
to
insertion
No
screw operation, easy
to
align,
no
resistance
Screw
tightening, easy
to
align,
no
torsional resistance
Screw tightening,
not
easy
to
align, resistance
No
screw operation, easy
to
align,
no
resistance
Plastic deformation,
not
easy
to
align, resistance
Nonfastening
process (manipulation
of
parts, grease)
Note:
The
codes
in
this table correspond
to an
earlier version
of the
Boothroyd method
and
thus
do not
match
the
codes
in
Figure
15-2.
Nevertheless,
the
assembly
times
are
similar.
assembly tends
to
spring apart before
it can be
completed.
Figure
15-27
is a CAD
drawing
of the
staple
gun in the
proposed assembly
fixture,
highlighting
the
locating
pin
configuration.
In
Figure 15-27, part number
11,
the
left
side plate,
locates
the
assembly
to the
plane
of the
fixture.
The
pins
are
designed
to
prevent
the
parts
from moving
and
pro-
vide alignment during assembly.
The
locator pins
on the
bottom
and
right hand side have clearance
so as not to
over constrain
the
assembly
in the
fixture.
The top
four
pins provide
a
resisting force against
the
force required
to
preload
the
main spring, while
the
left-hand side pins
resist
the
force
required
to
attach
the
nose
piece.
The
fix-
ture also contains
fixed
Philips head screwdriver tips
to
hold shoulder bolts
1 and 2
while
the
nuts
4 and 5 are
tightened.
A
clamp
is
required
to
hold
the
subassembly down
during
the
assembly
of the
subsequent
parts
and the
mainspring loading process.
The
clamp
is
shown
in
Fig-
ure
15-28.
A
test
was
conducted
to
confirm that this clamp
will
secure subassembly
1
during
the
loading
of the
spring
and
the
attachment
of the
nose
piece.


![[Xây Dựng] Giáo Trình Hệ Thống Đường Ống Cấp Thoát Nước - Ks.Đỗ Trọng Miên phần 8 potx](https://media.store123doc.com/images/document/2014_07/14/medium_xjf1405275661.jpg)


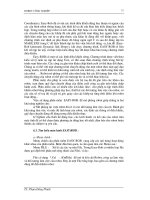
![[Toán Học Cao Cấp] Rút - Tối Ưu Phương Trình Phần 8 potx](https://media.store123doc.com/images/document/2014_07/27/medium_rny1406427655.jpg)
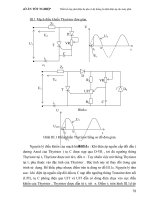
![[Slide] Kết Cấu Thép-Gỗ - Ths. Tạ Thanh Vân phần 8 potx](https://media.store123doc.com/images/document/2014_08/02/medium_mnb1406913622.jpg)