Design and Optimization of Thermal Systems Episode 2 Part 3 pdf
Bạn đang xem bản rút gọn của tài liệu. Xem và tải ngay bản đầy đủ của tài liệu tại đây (264.04 KB, 25 trang )
272
Design and Optimization of Thermal Systems
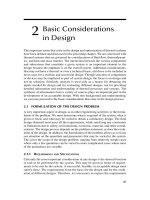
FIGURE 4.32 The results by the Newton-Raphson method for Example 4.7.
where the increments ( R)i and ( P)i are calculated from the equations
F
R
G
R
( R) i
i
( R) i
i
F
P
i
G
P
i
( P )i
F ( Ri , Pi )
( P )i
G ( Ri , Pi )
The four partial derivatives in the above equations are calculated for the R and
P values at the ith iteration, using analytical differentiation of the functions F and
G. The iterative process is continued until a convergence criterion of the form
F 2 G2
is satisfied. Figure 4.32 shows the computer output for
10 –4 and
starting values of 2 and 100 for R and P, respectively. The results obtained are very
close to those obtained earlier by the successive substitution method. The program
is simpler to write for the successive substitution method. However, the NewtonRaphson method converges at a faster rate, due to its second-order convergence.
It usually converges if the initial guessed values are not too far from the solution.
Nevertheless, if divergence occurs, the initial guessed values may be varied and
iteration repeated until convergence is achieved.
4.5.2 DYNAMIC SIMULATION OF LUMPED SYSTEMS
Dynamic simulation of thermal systems is used for studying the system characteristics at start-up and shutdown, for investigating the system response to changes
in operating conditions, and for design and evaluation of a control scheme. We are
interested in ensuring that the system does not go beyond acceptable limits under
such transient conditions. For instance, at start-up, the cooling system of a furnace
may not be completely operational, resulting in temperature rise beyond safe levels. This consideration is particularly important for electronic systems since their
performance is very sensitive to the operating temperature [see Figure 3.6(b)].
Similarly, at shutdown of a nuclear reactor, the heat removal subsystems must
remain effective until the temperature levels are sufficiently low. In many cases,
sudden fluctuations in the operating conditions occur due to, for instance, power
Numerical Modeling and Simulation
273
surge, increase in thermal load, change in environmental conditions, change in
material flow, etc., and it is important to determine if the system exceeds safety
limits under these conditions.
Analytical Solution
If the various parts of the system can be treated as lumped, the resulting equations
are coupled ODEs. Modeling of a component as lumped was discussed in Chapter
3 and the resulting energy equations, such as Equation (3.7), Equation (3.10), and
Equation (3.11), were given. For a lumped body governed by the equation
CV
dT
d
qA hA(T
Ta )
(4.41)
the temperature T( ) is given by
T
Ta
q
h
o
q
exp
h
hA
CV
(4.42)
where the symbols are the same as those employed for Equation (3.7) through
Equation (3.10). In the analytical solution given by Equation (4.42), the steadystate temperature is q/h, obtained for time
∞. The initial temperature at
0
is To, represented by o To – Ta. This solution gives the basic characteristics of
many dynamic simulation results in which the steady-state behavior is achieved
at large time. If q 0, the convective transport case of Equation (3.7) is obtained,
with Equation (3.9) as the solution. The quantity CV/hA is the response time in
that case, as given earlier in Equation (3.1). If convective heat loss is absent, only
qA is left on the right-hand side of Equation (4.41) and the solution is T – To
(qA/ CV) , indicating a linear increase if the heat input q is held constant.
The simulation of a system involves a set of ODEs, rather than a single ODE.
These equations may be linear or nonlinear. Most nonlinear equations, such as
Equation (3.11), require a numerical solution. Even with linear equations, the presence of several coupled ODEs makes it difficult to obtain an analytical solution.
As an example, let us consider two lumped bodies, denoted by subscripts 1 and 2,
exchanging energy through convection. The governing equations are
( CV )2
dT2
d
dT1
d
h1 A1 (T2 T1 )
(4.43a)
h2 A2 (Ta T2 ) h1 A1 (T2 T1 )
(4.43b)
( CV )1
274
Design and Optimization of Thermal Systems
Lumped body 2
Lumped body 1
Area
A1
h2
Area
A2
Ambient
medium,
Ta
h1
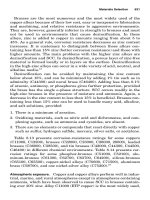
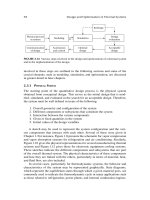
FIGURE 4.33 System consisting of two lumped bodies exchanging energy by convection
with each other and with the ambient medium.
where Ta is the temperature of the ambient with which body 2 exchanges energy
by convection. The convective heat transfer coefficients h1 and h2 refer to the
inner and outer surfaces, as shown in Figure 4.33. The initial temperature is To
at time
0. Employing
T – Ta, these equations may be written, with 1
T1 – Ta, 2 T2 – Ta, and o To – Ta, as
d 1
d
d
d
H1 (
2
2
H2
1
2
)
F ( 1,
H3 (
2
2
1
(4.44a)
)
) G( 1,
2
)
(4.44b)
where
H1
h1 A1
, H2
1C1V1
h2 A2
2C2V2
h1 A1
2C2V2
H3
Then the analytical solution for these equations is obtained as
1
o
2
o
be a
b a
ab
[e a
H1 (b a)
ae b
b a
eb ]
(4.45a)
1
o
(4.45b)
Numerical Modeling and Simulation
275
0
1
2
0
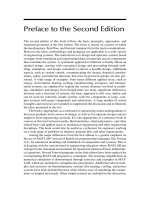
FIGURE 4.34 Variation of the temperatures of the two lumped bodies of Figure 4.33
with time.
where
K1 K 2
2
a
with K1
H1
H2
and b
H3 and K 2
K1 K 2
2
K12 4H1H 2
1/2
Figure 4.34 shows the temperature variation with time for the two lumped
bodies in this dynamic problem. The dimensionless temperatures start at o, at
time
0, and decay to zero with time because of heat loss to the environment. The gradient d 1/d is zero at
0 because 2
1
o at the beginning
of the process. Three first-order ODEs arise if three lumped bodies in energy
exchange with each other are considered, four equations for four bodies, and so
on. Analytical solutions may be obtained as given here or by using other analytical techniques such as the Laplace transform method, for a few idealized cases,
particularly if the equations are linear.
Numerical Solution
If the ordinary differential equations are nonlinear, analytical solutions are generally not possible and numerical methods must be employed for the simulation.
The use of Runge-Kutta and predictor-corrector methods to solve a single ODE
was discussed earlier. For solving a system of equations, such as that given by
Equation (4.44), let us consider two simultaneous first-order equations for dependent variables y and z:
dy
d
dz
d
F ( , y, z ) and
(4.46)
G ( , y, z )
Then the fourth-order Runge-Kutta method gives yi 1 and zi 1 as
yi
1
yi
K1 2 K 2
2K 3
6
K4
zi
1
zi
K1 2 K 2
2K 3
6
K4
(4.47)
276
Design and Optimization of Thermal Systems
where
K1
F ( i , yi , zi )
K2
F
i
2
K3
F
i
2
K4
F(
K1
, yi
K1
, zi
2
K1
2
K2
G
i
2
, yi
K2
, zi
2
K2
2
K3
G
i
2
K4
G(
, yi
i
G ( i , yi , zi )
K 3 , zi
K3 )
i
, yi
K1
, zi
2
K1
2
, yi
K2
, zi
2
K2
2
, yi
K 3 , zi
K3 )
(4.48)
The computations are carried out in the sequence just given to obtain the
values of y and z at the next step. This procedure may be extended to a system of
three or more first-order differential equations, and thus also to higher-order equations. All the conditions, in terms of the dependent variables and their derivatives,
must be known at the starting point to use this method. Therefore, the scheme,
as given here, applies to initial-value problems. If conditions at a different time
must also be satisfied, a boundary-value problem arises and the shooting method,
which employs a correction scheme to satisfy the boundary conditions, may be
employed (Jalluria, 1996).
Finite difference methods may also be applied to solve a system of ODEs.
Algebraic equations are generated for each ODE by the finite difference approximation and the combined set of equations is solved by the methods outlined earlier to obtain the desired simulation of the system. Considering, again, Equation
(4.46), we may write the finite difference equations as
yi
1
yi
F ( i , yi , zi )
zi
1
zi
G ( i , yi , zi )
(4.49)
where time
i , subscripts i and i 1 represent values at time and
,
respectively, and the functions F and G may be linear or nonlinear. Therefore,
values at
may be determined explicitly from values at . This is the explicit
formulation, which is particularly useful for nonlinear equations. However, F and
G are often evaluated at
or at some other time between and
, particularly at
/2, for greater accuracy and numerical stability, as mentioned
earlier for PDEs. This is the implicit formulation that gives rise to a set of simultaneous algebraic equations, linear ODEs generating linear algebraic equations,
and nonlinear ODEs generating nonlinear ones. Other, more accurate, finitedifference formulations are obviously possible for Equation (4.49). This set of
equations is then solved to simulate the thermal system. Higher-order equations
arise in some cases, particularly in the analysis of dynamic stability of systems.
These may similarly be simulated using the finite difference method.
Numerical Modeling and Simulation
277
Dynamic simulation is particularly valuable in areas such as materials processing, which inevitably involve variations with time. Lumping is commonly
used in thermodynamic systems, such as energy conversion and refrigeration systems, and the simulation outlined here helps in ensuring that the system behavior
and performance are satisfactory under time-varying conditions. The dynamic
simulation of large systems such as power and steel plants is particularly important because of changes in demand and in the inputs to the systems. Some of
these aspects are considered in detail, employing examples, in Chapter 5. Let us
consider a typical manufacturing system to illustrate these ideas.
Example 4.8
Numerically simulate the casting of a metal plate of thickness L 0.2 m in a mold of
wall thickness W 0.05 m, assuming one-dimensional solidification, no energy storage in the solid formed, uniform temperature in the mold, and initial liquid temperature at the melting point Tm 1200 K. A convective loss at heat transfer coefficient
h 20 W/(m2·K) occurs at the outer surface of the mold on both sides of the plate to
an ambient at temperature Ta 20 C. Find the total time needed for casting. Determine the effect of varying h, using values of 10 and 40 W/(m2·K), and of varying W,
using values of 0.02 and 0.1 m. Take density, specific heat, and thermal conductivity
of the cast material as 9000 kg/m3, 400 J/kg·K, and 50 W/m·K, respectively. The
corresponding values for the mold are 8000, 500, and 200, respectively. The latent
heat of fusion is 80 kJ/kg.
Solution
The problem concerns solidification of a molten material in an enclosed region,
as shown in Figure 1.3. However, a very simple, one-dimensional mathematical
model is used, as sketched in Figure 4.35. The liquid is at the melting temperature
Tm , a linear temperature distribution exists in the solid since energy storage in it is
Tm
Tc
h Ta
Tc
h Ta
FIGURE 4.35 Simple mathematical model for casting considered in Example 4.8.
278
Design and Optimization of Thermal Systems
neglected, and the mold is at uniform temperature Tc( ), where is time. The governing equations are obtained from energy balance as
( C )c
s
dTc
d
ks
d
d
k
Lf
Tm Tc
h(Tc Ta )
Tm Tc
where the subscript c refers to the mold and s refers to the solid, is the thickness
of the solid formed, and Lf is the latent heat of fusion. The first equation gives the
energy balance for the mold, which gains energy from the solid and loses to the ambient. The second equation balances the energy removed by conduction in the solid
to the latent heat for phase change.
Therefore, two coupled ODEs are obtained for this dynamic problem, one for Tc
and the other for . The material property values are substituted in the equations,
which are then rewritten in the form of Equation (4.46) as
dTc
d
F ( , Tc , )
d
d
G ( , Tc , )
These can easily be solved by the Runge-Kutta method, as outlined in the preceding section. However, a small, finite, non-zero value of must be taken at time
0
to start the calculations. It must be ensured that the results are essentially independent of the value chosen. Some of the characteristic results obtained are shown in
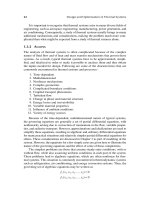
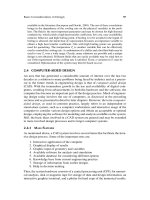
Figure 4.36 and Figure 4.37, in terms of the variation of Tc and with time. Casting
is complete when
0.1 m because heat removal occurs on both sides of the plate.
It is found that a variation in the heat transfer coefficient has no significant effect
on the temperature or the solidification rate, over the range considered. However,
the mold thickness W is an important design variable and substantially affects the
solidification time and the temperature of the mold. From these results, the casting
time at h 20 W/(m2·K) and W 0.05 m is 110 s. A thicker mold removes energy
faster and thus reduces the casting time. Therefore, this example illustrates the
use of dynamic simulation, which is particularly important for manufacturing processes, and for modeling the time-dependent behavior of the system.
4.5.3 DISTRIBUTED SYSTEMS
In the preceding sections, we considered the relatively simple circumstances in
which lumping may be employed for modeling the different parts of a given system. This approximation leads to algebraic equations in the steady-state case and
to ODEs in the time-dependent or dynamic simulation case. Even though the
assumption of lumping or uniform conditions in each system part has been and
still is very widely used because of the resulting simplicity, the easy availability
of powerful computers and versatile software has made it quite convenient to
model and simulate the more general distributed circumstance in which the quantities vary with location and time. Of course, if the lumped model is appropriate
Numerical Modeling and Simulation
279
Temperature
(K)
600
550
500
450
Heat transfer coefficient = 10
= 20
= 40 W/m2K
400
350
300
0
10
20
30
40
50
60
70
80
90
100
Time, (s)
(a)
0.1
Solid thickness, (m)
0.08
0.06
0.04
Heat transfer coefficient = 10
= 20
= 40 W/m2K
0.02
0
10
20
30
40
50
60
70
80
90
100
Time, ( )
(b)
FIGURE 4.36 Calculated mold temperature Tc and solid region thickness as functions of
time for different values of the heat transfer coefficient h, at W 0.05 m, in Example 4.8.
for a given problem because of, say, the very low Biot number involved, there is
no reason to complicate the analysis and the results by using a distributed model.
However, there are many problems of practical interest in which large variations
occur over the domain and the lumped approximation cannot be used. Temperature variation in the wall and in the insulation of a furnace is an example of
this circumstance. Similarly, the velocity and temperature fields in an electronic
system, in the cylinder of an internal combustion engine, in the combustor of a
280
Design and Optimization of Thermal Systems
1100
Temperature
(K)
1000
900
800
700
Mold thickness = 2 cm
=5
= 10
600
500
400
300
0
50
100
150
200
250
300
Time, (s)
(a)
0.1
Solid thickness, (m)
0.08
0.06
Mold thickness = 2 cm
=5
= 10
0.04
0.02
0
20
40
60
80
100
120
140
160
180
200
Time, (s)
(b)
FIGURE 4.37 Calculated mold temperature Tc and solid region thickness as functions of time for different values of the mold wall thickness W, at h 20 W/(m2·K), in
Example 4.8.
gas turbine, and in the molten plastic in an injection mold are strong functions of
location and time, making it essential to simulate these as distributed, dynamic
systems for accurate results.
The governing equations for distributed systems are PDEs, which are frequently nonlinear due to material property changes, coupling with fluid flow and
the presence of radiative transport. Several types of simple, linear PDEs, along
Numerical Modeling and Simulation
281
with the corresponding solution procedures, were discussed in Section 4.2.4.
Finite difference, finite element, and other approaches to obtain simultaneous
algebraic equations from the governing PDEs and to solve these were outlined.
Again, nonlinear PDEs lead to nonlinear algebraic equations and linear PDEs to
linear algebraic equations. Once the set of algebraic equations is derived, the solution is obtained by the various methods for linear and nonlinear equations given
earlier. Nonlinear equations are often linearized, as discussed below, so that new
values may be calculated using the known values from previous time steps or
iterations. In addition, commercially available software such as Fluent and Ansys
is generally employed in industry to simulate practical thermal systems.
Linearization
Consider the transient one-dimensional conduction problem governed by the
equation
(T )C (T )
T
x
k (T )
T
x
(4.50)
where the material properties are functions of temperature T. If these are taken as
constant, the linear equation given by Equation (4.27) is obtained. Then this equation may be solved conveniently by explicit or implicit finite difference methods
if the geometry and boundary conditions are relatively simple. For complicated
domains and boundary conditions, finite element or boundary element methods
may be used, as discussed earlier.
If the properties are taken as variable due to material characteristics or temperature range involved, the governing equation is nonlinear because the terms
are nonlinear in T. For instance, if the term on the right-hand side of Equation
(4.50) is expanded, we get
x
k (T )
T
x
T
x2
2
k (T )
k (T ) T
x
x
T
x2
2
k (T )
k (T )
T
T
x
2
(4.51)
indicating the nonlinearity that exists in the equation. There are several methods
of simulating systems in which such nonlinear equations arise. In an iterative or
time-marching process, the terms are commonly linearized by approximating the
coefficients, such as k(T) and ∂k(T)/∂x in the preceding equation, which cause the
nonlinearity in the terms, by the following three approaches:
1. Using the values of the coefficients from the previous iteration or time
step
2. Using extrapolation to obtain an approximation of these coefficients
3. Starting with values at the previous time step and then iterating at the
present time step to improve the approximation
282
Design and Optimization of Thermal Systems
If extrapolation is used, the value of k at the (n
may be approximated as
k (n
1)
k (n)
k
T
1)th time or iteration step
(n)
(T ( n ) T ( n 1) )
(4.52)
Similarly, other properties may be approximated. A larger time step may be taken
for a desired accuracy level if extrapolation is used instead of using values at the
previous time step. The third approach, which requires iteration, is more involved
but allows still larger time steps. Thus, nonlinear problems are linearized and
then solved by the various methods discussed earlier for linear PDEs (Jaluria and
Torrance, 2003).
4.5.4 SIMULATION OF LARGE SYSTEMS
All the aspects considered in this chapter can easily be extended to large thermal
systems that involve relatively large sets of algebraic and differential equations.
Such systems may range from a blast furnace for steel to an entire steel plant,
from a cooling tower to a power plant, from the cooling system of a rocket to the
entire rocket, and so on. Though many of the examples considered here involved
relatively small sets of equations for simplicity and convenience, the basic ideas
presented here are equally applicable to large and more complicated systems.
The two main features that distinguish large thermal systems from simpler
ones are the presence of a large number of parts that leads to large sets of governing equations and relatively independent subsystems that make up the overall
system. These aspects are treated by
1. Development of efficient approaches for solving large sets of equations
2. Better techniques for storing the relevant data
3. Subdivision of the system into subsystems that may be treated independently and then merged to obtain the simulation of the full system
All these considerations have been discussed earlier in this chapter and
need not be repeated. Methods such as Gauss-Seidel are particularly useful for
handling large sets of algebraic equations while keeping the computer storage
requirements small. Similarly, modularization of the simulation process has been
stressed at several places because this allows building up of the system simulation
package while ensuring that each subsystem is treated satisfactorily. Chapter 5
presents the overall design process for such large systems.
Several specialized computer languages have been developed for the simulation of engineering systems. These are usually designed for certain types of
systems and, as such, are more convenient to use than a general-purpose language
such as C or Fortran. Many of these simulation languages are particularly suited
for manufacturing systems. The general-purpose simulation system (GPSS) is
Numerical Modeling and Simulation
283
a simulation language suited for scheduling and inventory control applications
dealing with different steps in a process. Other languages that may be mentioned
are SIMAN, SIMSCIPT, MAST, and MAP. Each of these is particularly oriented
to a specific application, making it easier to enter the relevant data for simulation
and to obtain the desired outputs for design, operation, and control of the system.
Other computational environments, such as those provided by specialized software for computer simulation and design (e.g., such as MATLAB MATHCAD,
Maple, and other CAD programs) are also useful
4.5.5 NUMERICAL SIMULATION VERSUS REAL SYSTEM
It would be worthwhile to conclude the discussion on system simulation by stressing the most important element, namely, that the simulation must accurately and
closely predict the behavior of the actual system. A satisfactory simulation of a
system is achieved when the response of the simulated system to variations in
operating conditions and to changes in the design hardware follows the expected
physical trends and is a faithful representation of the given system. Unfortunately, the real system is rarely available to check the predictions of the simulation because one of the main uses of simulation is to study system behavior for
a variety of designs without actually fabricating the system for these different
designs. Therefore, other methods must generally be employed to validate the
models and to ensure that accurate predictions of system behavior are obtained
from the simulation.
As discussed in this and preceding chapters, the development of system simulation involves several steps. These include mathematical modeling, which generally also contains the correlating equations representing the results from physical
modeling, material property data, and component characteristics; numerical solution to the governing equations; numerical modeling of different system parts;
merging of separate models to yield an overall model for the system; variation of
operating conditions to consider design and off-design conditions; and investigation of system behavior for different design parameters. Therefore, the validation
of the simulation can be based on the validation of these ingredients that lead
to overall system simulation and on any available results obtained from similar
existing systems. Finally, when a prototype is developed and fabricated based on
the design obtained, the experimental results from the prototype can be employed
to provide a valuable check on the accuracy of the predictions.
In conclusion, a validation of the numerical simulation of the system is carried out
to confirm a close representation of the real system by considering the following:
1.
2.
3.
4.
5.
Validation of mathematical model
Validation of numerical schemes
Validation of the numerical models for system parts
Physical behavior of the simulated system
Comparison of results from simulation of simpler systems with available analytical and experimental results
284
Design and Optimization of Thermal Systems
6. Comparison of results from simulation of existing systems with experimental data
7. Use of prototype testing results for final validation of simulation
It must also be reiterated that the results from future operation of the designed
system are usually fed back into the model and the simulation in order to continually
make improvements for design and optimization efforts to be undertaken at later
times. Once the system simulation is thoroughly validated and the accuracy of its
predictions determined, it is used to obtain the numerical inputs needed for design
and optimization, for studying off-design conditions, establishing safety limits,
and investigating the sensitivity of the system to various design parameters.
4.6 SUMMARY
This chapter has considered the important topics of numerical modeling and
system simulation. For most practical thermal systems, numerical methods are
essential for obtaining a solution to the governing equations because of the inherent complexity in these systems arising from the nonlinear nature of transport
mechanisms, complicated domains and boundary conditions, material property variations, coupling between flow and heat transfer mechanisms, transient
and distributed nature of most processes, and a wide range of energy sources.
Additional aspects such as those due to combined heat and mass transfer, phase
change, chemical reactions as in combustion processes, strong coupling between
material characteristics and the process, etc., further complicate the analysis of
thermal processes and systems.
The basic considerations involved in numerical modeling, particularly those
concerned with accuracy and validation, are discussed, first with respect to a
part or component and then the entire system. Various aspects such as the use of
computer programs available in the public domain and commercially available
software are considered in the context of a thermal system. The decoupling of the
parts of the system in order to develop the appropriate mathematical and numerical models, followed by a thorough validation, is presented as the first step in the
development of the numerical model for the complete system. The numerical solution procedures for different types of mathematical equations such as algebraic
and ordinary, as well as partial, differential equations are outlined, largely to indicate the applicability and limitations of the various commonly used approaches for
solving these equations. Of particular interest here were the techniques for solving
nonlinear equations that are commonly encountered in thermal systems.
The basic strategy for developing a numerical model for a thermal system is
presented in detail, considering the treatment for individual parts and subsystems
and the merging of these individual models to obtain the complete model. Again,
the validation of the overall numerical model for the system is emphasized. The
physical characteristics of the results obtained from the model, their independence
of the numerical scheme and of arbitrarily chosen parameters, comparisons with
Numerical Modeling and Simulation
285
available analytical and numerical results, and comparisons with experimental
data from existing systems and finally from prototype testing are all discussed as
possible approaches to ensure the accuracy and validity of the model. It is crucial
to obtain a model that is a close and accurate representation of the actual, physical
system under consideration.
The simulation of a thermal system is considered next. The importance and
uses of simulation are presented. Of particular interest is the use of simulation
to evaluate different designs and for optimization of the system. However, the
application of simulation to investigate off-design conditions, to modify existing
systems for improved performance, and to investigate the sensitivity to different
variables is valuable in the design and implementation of the system as well. Various types of simulation are outlined, including physical and analog simulation.
The focus of the chapter is on numerical simulation, which is discussed in detail.
Different classes of thermal problems encountered in practice are considered.
These include steady or transient cases and lumped or distributed ones, resulting
in different types of governing equations and consequently different techniques
for numerical modeling. Simulation of large systems is considered in terms of the
basic strategy for modeling and simulation. The relationship between the simulation and the real system is a very important consideration and is confirmed at
various stages of model development and simulation.
REFERENCES
Atkinson, K. (1978) An Introduction to Numerical Analysis, Wiley, New York.
Boyle, J., Butler, R., Disz, T., Glickfeld, B., Lusk, E., Overbeek, R., Patterson, J., and
Stevens, R. (1987) Portable Programs for Parallel Processors, Holt, Rinehart and
Winston, New York.
Brebbia, C.A. (1978) The Boundary Element Method for Engineers, Wiley, New York.
Carnahan, B.H., Luther, H.A., and Wilkes, J.O. (1969) Applied Numerical Methods,
Wiley, New York.
Chapra, S.C. (2005) Applied Numerical Methods with MATLAB for Engineers and Scientists, McGraw-Hill, New York.
Chapra, S.C. and Canale, R.P. (2002) Numerical Merthods for Engineers, 4th ed.,
McGraw-Hill, New York.
Dieter, G.E. (2000) Engineering Design: A Materials and Processing Approach, 3rd ed.,
McGraw-Hill, New York.
Ertas, A. and Jones, J.C. (1996) The Engineering Design Process, 2nd ed., Wiley, New York.
Ferziger, J.H. (1998) Numerical Methods for Engineering Applications, 2nd ed., Wiley,
New York.
Gerald, C.F. and Wheatley, P.O. (1994) Applied Numerical Analysis, 5th ed., AddisonWesley, Reading, MA.
Hornbeck, R.W. (1975) Numerical Methods, Prentice-Hall, Englewood Cliffs, NJ.
Howell, J.R. and Buckius, R.O. (1992) Fundamentals of Engineering Thermodynamics,
2nd ed., McGraw-Hill, New York.
Huebner, K.H. and Thornton, E.A. (2001) The Finite Element Method for Engineers, 4th
ed., Wiley, New York.
286
Design and Optimization of Thermal Systems
Incropera, F.P. and Dewitt, D.P. (2001) Fundamentals of Heat and Mass Transfer, 5th ed.,
Wiley, New York.
Jaluria, Y. (1996) Computer Methods for Engineering, Taylor & Francis, Washington, DC.
Jaluria, Y. and Torrance, K.E. (2003) Computational Heat Transfer, 2nd ed., Taylor &
Francis, Washington, DC.
James, M.L., Smith, G.M., and Wolford, J.C. (1985) Applied Numerical Methods for
Digital Computation, 3rd ed., Harper & Row, New York.
Kernighan, B.W. and Ritchie, D.M. (1978) The C Programming Language, Prentice-Hall,
Englewood Cliffs, NJ.
Moran, M.J. and Shapiro, H.N. (2000) Fundamentals of Engineering Thermodynamics,
4th ed., Wiley, New York.
Parker, S.P. (1993) Encyclopedia of Chemistry, 2nd ed., McGraw-Hill, New York.
Patankar, S.V. (1980) Numerical Heat Transfer and Fluid Flow, Taylor & Francis,
Washington, DC.
Rauwendaal, C. (1986) Polymer Extrusion, Hanser, New York.
Reddy, J.N. (2004) An Introduction to the Finite Element Method, 3rd ed., McGraw-Hill,
New York.
Smith, G.D. (1965) Numerical Solution of Partial Differential Equations, Oxford University Press, Oxford, U.K.
Stoecker, W.F. (1989) Design of Thermal Systems, 3rd ed., McGraw-Hill, New York.
Tadmor, Z. and Gogos, C. (1979) Principles of Polymer Processing, Wiley, New York.
Tannehill, J.C., Anderson, D.A., and Pletcher, R.B. (1997) Computational Fluid Mechanics
and Heat Transfer, 2nd ed., Taylor & Francis, Washington, DC.
PROBLEMS
4.1. The mass balance for three items x, y, and z in a chemical reactor is
governed by the following linear equations:
2.2x
4.5y
1.1z
11.14
y
2.5z
1.62
10.1z
15.57
4.8x
2.1x
3.1y
Solve this system of equations by the Gauss-Seidel method to obtain
the values of the three items. You may arrange the equations in any
appropriate order. Do you expect convergence? Justify your answer.
The initial guess may be taken as x y z 0.0 or 1.0.
4.2. An industrial system has three products whose outputs are represented
by x, y, and z. These are described by the following three equations:
1.8x – 3.1y
4.8x
3.3x
7.6z
12.2
6y – 1.1z
24.8
1.7y
0.9z
13.0
(a) Give the block representation for each of these subsystems.
(b) Draw the information-flow diagram for the system.
Numerical Modeling and Simulation
287
(c) Set up this system of equations for an iterative solution by any
appropriate method, starting with an initial guess of x y z 0.
(d) Show at least 5 iterative steps to obtain the solution to simulate the
system.
4.3. The mass balance for three items a, b, and c in a reactor is given by the
following linear equations:
4a
2b
a
2a
2c
17
c
5
6c
12
5b
3b
Solve this system of equations by the Gauss-Seidel iteration method.
The initial guess may be taken as a b c 0.0 or 1.0.
4.4. Solve the following set of linear equations by the Gauss-Seidel iteration method. The initial guess may be taken as 0.0 or 1.0.
5x
y
2z
17
x
3y
z
8
y
6z
23
2x
Vary the convergence parameter to ensure that results are independent
of the value chosen.
4.5. A firm produces four items, x1, x2, x3, and x4. A portion of the amount
produced for each is used in the manufacture of the other items. The balance between the output and the production rate yields the equations
x1 2 x2
5 x4
32
3 x1 2 x2
6 x3
36
x7
41
2 x2 10 x3 8 x4
58
3 x1 5 x2
2 x3
Solve these equations by the SOR method and determine the optimum
value of the relaxation factor . Obtain the production rates of the four
items. Compare the number of iterations needed for convergence at the
optimum with that for the Gauss-Seidel method (
1).
4.6. Using the successive substitution and the Newton-Raphson methods,
solve the following equation for the value of x, which is known to be
real and positive:
x5
[10(10
x)0.5
8]3
288
Design and Optimization of Thermal Systems
The equation may be recast in any appropriate form for the application of the methods. Compare the solution and the convergence of the
numerical scheme in the two cases.
4.7. The solidification equation for casting in a mold at temperature Ta, considering energy storage in the solid, is obtained as
C(Tm
Ta)/L
1/2
exp( 2) erf( )
where C is the material specific heat, Tm is the melting point, L is the
latent heat, and
/[2( )1/2], being the interface location, as shown
in Figure P4.7, is the thermal diffusivity, and is the time. Take
10 5 m2/s, L 110 kJ/kg, Tm 925 C, Ta 25 C, and C 700 J/kg·K
for the material being cast. Approximate the error function erf( )
,
for 0
1, and erf( ) 1.0 for
1. Solve this equation for and
calculate the interface location as a function of time . What is the
casting time for a 0.4-m-thick plate, with heat removal occurring on
both sides of the plate?
Interface
Solid
Mold
Liquid
Motion
FIGURE P4.7
4.8. For the casting of a plate 10 cm thick, use the graphs presented in
Example 4.8 to determine the total solidification times for the cases
when the mold is 2 cm or 10 cm thick. Also, determine the time needed
to solidify 75% of the plate. The heat transfer coefficient h is given as
40 W/m2K.
4.9. A spherical casting of diameter 10 cm has a total solidification time
(TST) of 5 min. Assuming Chvorinov’s model, TST C(V/A)2, where
V is the volume, A is the surface area, and C is a constant, calculate the
diameter of a long cylindrical runner with a TST of 12 min.
4.10. The speed V of a vehicle under the action of various forces is given by
the equation
5.0 exp(V/3)
2.5V 2
2.0V
20.5
Numerical Modeling and Simulation
289
Compute the value of V, using any appropriate method. Justify your
choice of method. Suggest one other method that could also have been
used for this problem.
4.11. The temperature T of an electrically heated wire is obtained from its
energy balance. If the energy input into the wire, per unit surface area,
due to the electric current is 1000 W/m2, the heat transfer coefficient
h is 10 W/(m2·K), and the ambient temperature is 300 K, as shown in
Figure P4.11, the resulting equation is obtained as
1000
0.5
5.67
10
8
[T 4
(300)4]
10
(T
300)
Calculate the temperature of the wire by the secant method. Using this
numerical simulation, determine the effect of the energy input on the
temperature by varying the input by 200 W/m2. Also, vary the ambient temperature by 50 K to determine its effect on the temperature.
Do the results follow the expected physical trends?
Ta
h
FIGURE P4.11
4.12. A cylindrical container of diameter D is placed in a stream of air and
the energy transfer from its surface is measured as 100 W. The energy
balance equation is obtained using correlations for the heat transfer
coefficient as
60 0.466
D
50
D
D 100
Find the diameter of the container using any root-solving method. Also,
use this simulation to determine the diameter needed for losing a given
amount of energy in the range 100 20 W by varying the heat lost.
4.13. Use the bisection method to determine the root of the equation
x 1 exp
10
1 4x
1 0
290
Design and Optimization of Thermal Systems
4.14. Use the successive substitution method to determine the variable v
from the equation
v
14
72 * 10
0.65
0.5
85
6
10.8
4.15. Use Newton’s method or the secant method to solve the equation
exp(x) – x2
0
4.16. Use Newton’s method to find the real roots of the equation
x4 – 4x3
7x2 – 6x
2
0
4.17. The root of the equation
[exp( 0.5x)] x1.8
1.2
is to be obtained. It is given that a real root, which represents the location of the maximum heat flux, lies between 0 and 6.0. Using any suitable method, find this root. Give reasons for your choice of method.
What is the expected accuracy of the root you found?
4.18. The generation of two quantities, F and G, in a chemical reactor is
governed by the equations
2.0F 2G 2
3.0G
F2
2.0G 3
13.8
16.6
Solve this system of equations using the Newton-Raphson method and
starting with F G 1.0 as the initial guess. What is the nature of these
equations and do you expect the scheme to converge? Set the system up
also as a root-solving problem. Suggest a method to solve it and obtain
the solution.
4.19. In a chemical treatment process, the concentrations c1, c2, c3, and c4 in
four interconnected regions are governed by the system of nonlinear
equations
c2
2
c3
c4
3.7
8c2
3c3
c4
4.9
2c2
5c3
c2
4
8.8
7c1
2
c1
2c1
c1
c2
2
c3
14c4
18.2
Numerical Modeling and Simulation
291
Solve these equations by the modified Gauss-Seidel method to obtain
the concentrations.
4.20. A manufacturing system consists of a hydraulic arrangement and
an extrusion chamber. The two are governed by the following two
equations:
1.3P – F 2.1
P
1.6
– (900 – 95F)
0.5
10
0
0
Show the flow of information for this system. Set up the system of
equations for an iterative solution, starting with an initial guess of P
F 1. Show at least three iterative steps toward the solution.
4.21. Solve the following nonlinear system by Newton’s method:
3X 3
2X 2
Y
Y2
11
4
0
Try solving these equations by the successive substitution method as
well.
4.22. In a metal forming process, the force F and the displacement x are
governed by
F
250
70 1 exp
1000
21(5 20 x )
4.2 Fx
Solve for F and x, applying the Newton-Raphson method to this system of equations. Also, determine the sensitivity of the force F to a
variation in the total input S, ∂F/∂S, where S is the given value of 250,
by slightly varying this input.
4.23. A copper sphere of diameter 5 cm is initially at temperature 200 C.
It cools in air by convection and radiation. The temperature T of the
sphere is governed by the energy equation
CV
dT
d
T 4 Ta4
h(T Ta ) A
where is the density of copper, C is its specific heat, V is the volume
of the sphere, is the time taken as zero at the start of the cooling process, is the surface emissivity, is the Stefan-Boltzmann constant, Ta
is the ambient temperature, and h is the convective heat transfer coefficient. Compute the temperature variation with time using the RungeKutta method and determine the time needed for the temperature to
292
Design and Optimization of Thermal Systems
drop below 100 C. The following values may be used for the physical
variables:
9000 kg/m3, C 400 J/(kg·K),
0.5,
5.67 10 –8
W/(m2·K4), Ta 25 C, and h 15 W/(m2·K).
4.24. Consider the preceding problem for the negligible radiation case,
0,
with h 100 W/(m2·K). Nondimensionalize this simpler problem and
obtain the solution in dimensionless terms. Thus, obtain the results for
a 10-cm-diameter sphere.
4.25. The temperature variation in an extended surface, or fin, for the onedimensional approximation, is given by the equation
d 2T
dx 2
hP
(T
kA
Ta )
0
where x is the distance from the base of the fin, as shown in Figure
P4.25. Here P is the perimeter, being D for a cylindrical fin of diameter D, A is the cross-sectional area, being D2/4 for a cylindrical fin, k
is the material thermal conductivity, Ta is the ambient temperature, and
h is the heat transfer coefficient. The boundary conditions are shown in
the figure and may be written as
at x
0: T
To
and at x
L:
dT
dx
0
where L is the length of the fin. Simulate this component, which is commonly encountered in thermal systems, for D 2 cm, h 20 W/(m2·K),
k 15 W/m·K, L 25 cm, To 80 C, and Ta 20 C. Nondimensionalize this problem to obtain the governing dimensionless parameters.
Use the shooting method to obtain the temperature distribution, and
discuss expected trends at different parameteric values.
h, Ta
Heat loss
Fin
To
dT = 0
dx
T(x)
x
L
FIGURE P4.25
4.26. If radiative heat loss is included in the preceding problem, the governing equation becomes
d 2T
dx 2
hP
(T
kA
Ta )
P
kA
T 4 Ta4
0
Solve this problem with
0.5 and
5.67 10 –8 W/(m2·K4), using the
finite difference approach, and compare the results with the preceding
Numerical Modeling and Simulation
293
problem. Increase the emissivity to 1.0 (black body) in this simulation and compare the results with those at 0.5. Are the observed trends
physically reasonable?
4.27. The temperature distribution in a moving cylindrical rod, shown in
Figure P4.27, is given by the energy equation
d 2T
dx 2
1
U
dT
dx
2h
(T
kR
Ta )
0
where U is the velocity of the moving rod of radius R, is the thermal
diffusivity, and the other variables are the same as the preceding problem. The boundary conditions are
at x
0: T
To
at x
and
∞: T
Ta
Employing the finite difference approach, compute T(x). Take U
1 mm/s, h 20 W/(m2·K),
10 –4 m2/s, k 100 W/(m·K), To
600 K, Ta 300 K, and R 2 cm. Numerically simulate x ∞ by taking a
large value of x and ensuring that the results are independent of a further
increase in this value. Also, nondimensionalize this problem and determine the governing dimensionless variables. If the material and dimensions are fixed, what are the main design variables? Discuss how these
may be varied to control the temperature decay over a given distance.
h, Ta
Heat loss
Die
To
T(x)
U
x
FIGURE P4.27
4.28. For the manufacturing process considered in Problem 3.6, set up the
mathematical system for numerical simulation. Take each bolt to have
surface area A, volume V, density , and specific heat C. Outline a
scheme for simulating the process. What outputs do you expect to
obtain from such a simulation?
4.29. In the simulation of a thermal system, the temperatures in two subsystems are denoted by T1 and T2 and are given by
dT1
d
hA
CV
1
dT2
d
hA
CV
2
(T1 Ta )
(T2 Ta )
294
Design and Optimization of Thermal Systems
Under what conditions will the response of T1 be much slower than that
of T2? Write down the finite difference equations for solving this set
of equations and outline the numerical procedure if the time step 1,
for T1, is taken as much larger than the time step 2, for T2. Note that
(hA/ CV) is a function of temperature.
4.30. An experimental study is performed on a plastic screw extruder along
with a die to determine the relationship between the mass flow rate m
and the pressure difference P. The relationship for the die is found to be
m
0.5 P0.5
and the relationship for the screw extruder is
P
2
3.5m1.4 – 5m2.2
First, give the block representation for each of these subsystems. Then
show the flow of information for the system. Set up this system of equations for an iterative solution by successive substitution, starting with
an initial guess of m 0 and P 1. Obtain the solution to simulate the
extruder.
4.31. In an injection molding process, the flow of plastic in two parallel circuits is governed by the algebraic equations
m
m1 m2
p 68 + 8m 2
2
550 5m1 10m1 .5
3
700 10m2 15m2
where m is the total mass flow rate, m1 and m2 are the flow rates in the
two circuits, and p is the pressure difference. Simulate the system,
employing the Newton-Raphson method. Study the effect of varying
the zero-flow pressure levels (550 and 700 in the preceding equations)
by 10% on the total flow rate m.
4.32. Solve the preceding problem using the successive substitution method.
The number of equations may be reduced by elimination and substitution to simplify the problem. Compare the results and the convergence
characteristics with those for the preceding problem.
4.33. The dimensionless temperature x and heat flux y in a thermal system
are governed by the nonlinear equations
x3
3y2
21
x2
2y
2
Solve this system of equations by the Newton-Raphson and the successive substitution methods, comparing the results and the convergence
in the two cases.
Numerical Modeling and Simulation
295
4.34. Simulate the ammonia production system discussed in Example 4.6
to determine the change in the ammonia production if the bleed (23.5
moles/s) and the entering argon flow (0.9 moles/s) are varied by 25%.
What happens if the bleed is turned off? Can this circumstance be
numerically simulated?
4.35. The gross production of four substances by an engineering concern
is denoted by a, b, c, and d. A balance between the net output and the
production of each quantity leads to the following equations:
4a – 2b
5d
22
–2a
8b – c
16
3b
4c – 3d
30
–3c
12d
6
Solve these equations by the SOR method to simulate the system. The
constants on the right-hand side of the equations represent the net production of the four items. If the net production of x2 is to be increased
from 16 to 24 (50% increase), calculate the gross production of all the
items to achieve this.
4.36. A water pumping system consists of pipe connections and pumping
stations, each of which has the following characteristics:
P
1850
17.5 m 0.7 m 2
where m is the mass flow rate of water and P is the pressure rise in
each pumping station. The mass flow rate is measured as 32 kg/s with
all eight pumping stations in the pipeline operating. The pressure drop
in the pipe is given as proportional to the square of the mass flow rate.
Obtain the governing equations to determine the flow rate if a few stations are inoperative and are bypassed. Then calculate the resulting
flow rate if one or two stations fail.
4.37. The height H of water in a tank of cross-sectional area A is a function of
time due to an inflow volume flow rate qin and an outflow rate qout. The
governing differential equation is obtained from a mass balance as
A
dH
d
qin
qout
The initial height H at
0 is zero. Calculate the height as a function
of time, with A 0.03 m2, qin 6 10 –4 m3/s, and qout 3 10 –4 H
m3/s. Use both Euler’s and Heun’s methods with a step size of 10 s. Plot
H as a function of time . Give the times taken by the height to reach
2 m and 3.5 m in your answer. Why does the increase in H become
very slow as time increases?
296
Design and Optimization of Thermal Systems
4.38. The temperature of a metal block being heated in an oven is governed
by the equation
dT
d
10 0.05T
Solve this equation by Euler’s and Heun’s method to get T as a function
of time . Take the initial temperature as 100 C at
0.
4.39. A stone is dropped at zero velocity from the top of a building at time
0. The differential equation that yields the displacement x from the
top of the building is (with x 0 at
0)
d 2x
d 2
g 5V
where g is the magnitude of gravitational acceleration, given as 9.8
m/s2, and V is the downward velocity dx/d . Using Euler’s method,
calculate the displacement x and velocity V as functions of time, taking
the time step as 0.5 s.
4.40. Simulate the hot water storage system considered in Example 3.5 for a
flow rate of 0.01 m3/s, with the heat transfer coefficient h given as 20
W/(m2·K) and ambient temperature Ta as 25 C. The inlet temperature
of the hot water To is 90 C. Obtain the time-dependent temperature
distribution, reaching the steady-state conditions at large time. Study
the effect of the flow rate on the temperature distribution by considering flow rates of 0.02 and 0.005 m3/s.
4.41. Consider one-dimensional conduction in a plate that is part of a thermal system. The plate is of thickness 3 cm and is initially at a uniform temperature of 1000 C. At time
0, the temperature at the two
surfaces is dropped to 0 C and maintained at this value. The thermal
diffusivity of the material is
5 10 –6 m2/s. Solve this problem by
any finite difference method to obtain the temperature distribution as a
function of time.
4.42. A cylindrical rod of length 40 cm is initially at a uniform temperature
of 15 C. Then, at time
0, its ends are raised to 100 C and held at
this value. For one-dimensional conduction in the rod, the temperature
distribution T(x) is governed by the equation
1 T
T
x2
2
H (T
Ta )
where H is a heat loss parameter. Using any suitable method, solve this
problem to obtain the time-dependent temperature distribution for Ta
15 C,
10 –6 m2/s, and H 100 m–2. Discuss how this simulation