Ozren Ocic Oil Refineries in the 21st CenturyOil phần 9 pot
Bạn đang xem bản rút gọn của tài liệu. Xem và tải ngay bản đầy đủ của tài liệu tại đây (268.48 KB, 20 trang )
Semi-product Cost price of
charge in US$/t
unit operating
costs in US$/t
Cost prices in US$/t
Fuel gas 138.54 46.46 185.00
Jet fuel 210.20 46.46 256.66
White spirit 212.61 46.46 259.07
Light gas oil 198.09 46.46 244.63
The cost price of slop is determined at the level of feedstock average cost.
4.10
Instruments for Determining Energy and Processing Efficiency of Alkylation Unit
4.10.1
Technological Characteristics of the Process
In alkylation of iso-butane with olefins, the hydrocarbon isomers in the boiling ran-
ge of gasoline are obtained in the presence of sulfuric acid as a catalyst. Reaction occurs
in the liquid phase when olefins come into contact with acid and large excess of iso-
butane, the bigger portion of which has an impact on improvement of alkylate quality.
In this process, a high-octane component – raw alkylate – is produced, which is then
used in motor gasoline blending, (see Fig. 19).
C
4
hydrocarbon olefin feed is mixed with isobutane and introduced into a reactor to
mix with sulfuric acid (98.5%). This mixture goes from the reactor into a settler where
acid is separated and circulated from the settler bottom back into the reactor.
The hydrocarbon phase mixture is introduced into the expansion vessel via the re-
actor (tube bundle), at a reduced pressure, hence a large expansion and concurrent
reactor section cooling occurs, due to flashing.
The expansion vessel consists of two parts. In the first part, a mixture of alkylate and
iso-butane is separated and in the second part, mainly iso-butane, which is sent back
Fig. 19 Technological characteristics of alkylation process
4 Instruments for Determining Energy and Processing Efficiency of an Oil Refinery116
into the reactor to provide the necessary excess of iso-butane and to maintain the
process optimum temperature (4–7
o
C).
The expansion vessel is under pressure (higher than 1 bar) so the complete vapour
phase, mainly propane, butane and iso-butane, is fed into the compressor absorber to
introduce a part of the phase into the other part of the expansion vessel where iso-
butane is employed as a cooling agent, whereas the remaining steam phase is fed
via a cooler and a separator back to the gas concentration depropanizer to serve as
the alkylation process feed.
Alkylate and iso-butane mixture from the first part of the expansion vessel is
charged, via a heat exchanger, to the washing system. First, washing is performed
by caustic, to remove residual acid, and then by water to remove residual caustic.
Then, the mixture is introduced into the column-debutanizer. Isobutane is separated
on the top of the column and is partly sent, via the cooler and separator, back to the
column as a reflux and partly returned to the process as a recycle with make-up iso-
butane from the storage. n-Butane, as a side-stream product, is discharged to storage,
via the cooler and separator.
The column bottoms’ product, alkylate, can be used in motor gasoline blending or
can be separated in the redistillation column, as light and heavy distillates.
4.10.2
Energy Characteristics of the Process
In alkylation with sulfuric acid, iso-butane and butane fractions are introduced into a
reactor where an exothermic reaction occurs.
High-pressure steam is used for the main pump and compressor drive, through the
high-pressure steam condensing turbines.
Medium-pressure steam is used to heat the auxiliary column, through heaters, and
to drive pumps and compressors, through medium-pressure steam turbines.
Low-pressure steam (LpS) is obtained by reduction of medium-pressure steam
(MpS) on the medium-pressure steam turbines.
The total amount of steam is used for heating of tubes, equipment and other require-
ments.
Electric energy is used to drive pumps, fans and other equipment.
The main energy characteristics of the alkylation process are shown in Fig. 20.
For the purpose of this process a block energy-flow scheme is presented in Scheme
10 and Senky’s diagram for the energy balance in Diagram 9. The values given for the
energy consumption refer to the annual volume of production amounting to about
60 000 t/y.
High-pressure steam consumption is 80 000 t or 258 TJ. The consumption of me-
dium-pressure steam is 140 000 t or 419 TJ. Internal generation of low-pressure steam,
obtained by reduction on back-pressure turbines, is 20 000 t or 55 TJ and it is used
internally.
4.10 Instruments for Determining Energy and Processing Efficiency of Alkylation Unit 117117
4.10.3
Determining the Steam Cost Price
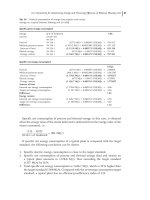
The cost prices of high-, medium- and low-pressure steam, which are used or pro-
duced on the alkylation unit, are shown in Tables 60, 61 and 62. It should be empha-
sized that high- and medium-pressure steam is supplied from refinery power plant at
10.83 US$/t, i.e. 9.66 US$/t, while low-pressure steam is generated on the alkylation
unit, by reduction of medium-pressure steam, and internally used.
Fig. 20 Energy characteristics of alkylation process
Scheme 10 Energy flows of alkylation process
4 Instruments for Determining Energy and Processing Efficiency of an Oil Refinery118
From Tab. 62 it can be seen that the cost price of LP steam that is generated by
reduction of MP steam, is very high (11.78 US$/t). It is higher than the cost price
of medium-pressure steam (9.66 US$/t) and high-pressure steam (10.83 US$/t).
Diagram 9 Senky’s diagram of energy flows of alkylation process, in TJ/y
Tab. 60 Cost prices of high-pressure steam HpS (consumption)
Item no. Elements for calculation High-pressure steam generation (HpS)
Annual
q’ty in t
Cost price
US$/t
Total in US$
12 3 4 5
1 HP steam supplied from Refinery Power Plant 80 000 10.83 866 400
Tab. 61 Cost prices of medium-pressure steam MpS (consumption)
Item no. Elements for calculation Medium-pressure steam generation (MpS)
Annual
q’ty in t
Cost price
US$/t
Total in US$
12 3 4 5
1 MP steam supplied from Refinery Power Plant 120 000 9.66 1 159 200
4.10 Instruments for Determining Energy and Processing Efficiency of Alkylation Unit 119119
This price of LP steam is firstly effected by the price of MP steam that is provided
from the refinery power plant at the price of 9.66 US$/t and added by fixed costs, i.e.
depreciation, current and investment maintenance, breakage and fire insurance of the
equipment used to convert the MP steam into LP steam, at the total costs of 2.21 US$/t,
so the final LP steam price is 11.78 US$/t.
4.10.4
Energy Efficiency of the Process
Specific consumption of steam related to the amount of feedstock is:
gross:
338 kg of steam
t of feedstock
or: 939:6
MJ
t of feedstock
net: 0kg=tor: 0MJ=t
The target standard of net energy consumption and specific gross and net energy
consumption, on a typical alkylation unit, is outlined in Tab. 63 while Tab. 64 is
the financial presentation of energy consumption and money savings that can be
achieved by eliminating the differences between the target standard (average energy
consumption of Western European refineries) and energy consumption of this refin-
ery unit.
The difference between gross and net energy consumption appears in the case of LP
steam, by reason of internal generation in the process.
If specific net energy consumption of a typical plant is compared with the target
standard, the following conclusion can be drawn:
1. Specific electric energy consumption is close to the target standard.
Tab. 62 Cost price of low-pressure steam (production-consumption)
Item.
no.
Elements for calculation LpS production (US$) LpS for int.
consumption
Annual
q’ty in t
Cost price
US$/t
Total
in US$
12 34 5 6
1 MP steam supplied from Refinery
Power Plant
20 000 9.66 193 200 193 200
2 LP steam by reduction of MP steam 20 000 9.66 193 200 193 200
3 Depreciation 35 453 35 453
4 Current and investment maintenance 4 145 4 145
5 Insurance premium for equipment 2 763 2 763
6 Total (2-5) 20 000 11.78 235 561 235 561
7 Quantity in t 20 000 20 000
8 Cost price in US$/t 11.78 11.78
4 Instruments for Determining Energy and Processing Efficiency of an Oil Refinery120
Tab. 63 Target standard of net energy consumption and specific
energy consumption on a typical alkylation unit (quantity of energy per
one tonne of feedstock)
Energy carriers Target standard
of net energy
consumption
Specific energy consumption in the plant
Specific gross energy
consumption
Specific net energy
consumption
(kg/t)
1
(kWh/t)
(MJ/t) (kg/t)
1
(kWh/t)
(MJ/t)
(MJ/t) (kWh/t)
per unit total per unit total
Heat carriers 12 394.8 11 455.2
LP steam * – 338 939.6
MP steam * – 2 370 7 095.3 2 370 7 095.3
HP steam * – 1 354 4 359.9 1 354 4 359.9
Sources of heat 5 866.8 –––12394.8 – – 11 455.2
Electric energy 133.2 37 39.0
1
140.4 140.4 39.0
1
140.4 140.4
Energy carriers 6 000 –––12535.2 – – 11 595.6
Tab. 64 Financial presentation of energy consumption and money
savings on a typical alkylation unit (in US$)
Specific gross energy consumption
Energy carriers Q’ty of feedstock
(light residue)
US$
59 053 t
Low-pressure steam 59 053 t (939.6 MJ/t  0.0042374 US$/MJ) = 235 117
Medium-pressure steam 59 053 t (7 095.3 MJ/t  0.0032308 US$/MJ) = 1 353 701
High-pressure steam 59 053 t (4 359.9 MJ/t  0.003363 US$/MJ) = 865 855
Sources of heat 59 053 t (12 394.8 MJ/t  0.0033536 US$/MJ) = 2 454 673
Electric energy 59 053 t (140.4 MJ/t  0.0167 US$/MJ) = 138 460
Energy carriers 59 053 t (12 535.2 MJ/t  0.00350309 US$/MJ) = 2 593 133
Specific net energy consumption
US$/t
Medium-pressure steam (7 095.3 MJ/t  0.0032388 US$/MJ) = 22.980258
High-pressure steam (4 359.9 MJ/t  0.003363 US$/MJ) = 14.662343
Sources of heat (11 455.2 MJ/t  0.00328607 US$/MJ) = 37.642601
Electric energy (140.4 MJ/t  0.0167 US$/MJ) = 2.344680
Energy carriers (11 595.6 MJ/t  0.00344849 US$/MJ) = 39.987281
Sources of heat:
Internal net energy consumption (11 455.2 MJ/t  0.00328607 US$/MJ) = 37.64
Target net energy consumption (5 866.8 MJ/t  0.00328607 US$/MJ) = 19.29
Difference: 18.36
Energy carriers:
Internal net energy consumption (11 595.6 MJ/t  0.00344849 US$/MJ) = 39.99
Target net energy consumption (6 000 MJ/t  0.00344849 US$/MJ) = 20.69
Difference: 19.30
4.10 Instruments for Determining Energy and Processing Efficiency of Alkylation Unit 121121
2. Specific net consumption of process and thermal energy (steam) amounts to 11
455.2 MJ/t thus exceeding the target standard (5866.8 MJ/t) by 95 %.
3. Total specific net energy consumption is 11 596.6 MJ/t being 93% higher than the
target standard (6000 MJ/t). Compared with the net energy target consumption, a
typical plant has an efficiency/inefficiency index of 193.
Increased consumption of process and thermal energy on a typical plant is caused by
different factors, the most important being:
– non-economical utilization of high-pressure steam for pump and compressor drive,
by means of steam condensing turbines, and
– non-economical utilization of medium-pressure steam for pump and compressor
drive by means of steam turbines.
4.10.5
Determining the Refinery Product Cost Prices
Considering the feedstock of this unit is butane, which is obtained on the catalytic
cracking unit, and iso-butane, which is obtained on the gas concentration unit, it is
necessary to first determine the cost prices of these products. The process is based on
catalyst reaction of iso-butane with light olefins due to the production of alkylate, which
presents about 90% of output, and that is blended, as an octane component, into
gasolines.
The cost prices of semi-products produced on the alkylation unit are determined by
equivalent numbers obtained by means of the density method, as the best method,
although equivalent numbers can be determined by the following methods as well:
– thermal value method, and
– average production cost method.
By analysing the results obtained by the different calculation bases for determining
equivalent numbers, significant differences in the cost prices of oil products generated
on this unit can be noticed.
Tab. 65 Cost prices of semi-products on alkylation unit in US$/t
(per calculating bases)
Item
no.
Semi-products Base for determining the equivalent number for calculating the cost prices
Product Density
Method
Thermal Value
Method
Average Production Cost
Method
12 3 4 5
1 Light alkylate 197.58 197.53 197.51
2 Heavy alkylate 183.75 194.03 197.51
4 Instruments for Determining Energy and Processing Efficiency of an Oil Refinery122
These differences are presented in Tab. 65 and Graphics 25 and 26.
Besides the significant differences in cost prices of the same refinery product that
depend on the calculating bases for determining the equivalent numbers, different
ranges in the feedstock cost prices can be noted even with the same calculating base.
Besides the influence of calculating base, the choice of reference derivate is also
important.
The stated examples of the calculating bases’ effects on determining the equivalent
numbers do not present all the dilemmas that experts dealing with process-industry
calculations can face. The effects of the choice of reference derivatives (light alkylate
whose density is 0.699 g/cm
3
and heavy alkylate whose density is 0.754 g/cm
3
) on de-
termining the equivalent numbers, in the case of using the same calculating base for
determining the equivalent numbers (density method) are shown in Tab. 66 and Gra-
phics 27 and 28.
Graphic 25 Cost prices of semi-products on alkylation unit, per products
(in US$/t)
Graphic 26 Cost prices of semi-products on alkylation unit, per calculating
bases (in US$/t)
4.10 Instruments for Determining Energy and Processing Efficiency of Alkylation Unit 123123
It can be seen that the differences appearing in this case are smaller than those
appearing in the previous example of determining the equivalent numbers by the
different calculating bases (density, thermal value and quantity of products).
Tab. 66 Cost prices of semi-products on alkylation unit in US$/t
(per reference products)
Item
no.
Semi products Reference products
Light alkylate Heavy alkylate
12 3 4
1 Light alkylate 197.58 191.86
2 Heavy alkylate 183.75 206.31
Graphic 27 Cost prices of semi-products on alkylation unit, per different
reference products (in US$/t)
Graphic 28 Cost prices of semi-products on alkylation unit, per same reference
products (in US$/t)
4 Instruments for Determining Energy and Processing Efficiency of an Oil Refinery124
Tab. 6 7 Determining the equivalent numbers for distributing the proportional costs on alkylation unit
Item
no.
Oil products Quantity in
tonnes
Q’ty from
1 tonne
Density
g/cm
3
Equivalent
numbers
Condition
units
Cost of
1 condition
unit
Cost price
in US$/t
Cost of feed-
stock in US$
(%) for
proportional
costs
Cost of feed-
stock in US$
(entry-exit)
12
34
56
7(4 Â 6) 8 9(6 Â 8) 10(3 Â 9) 11 12
1 Isobutane 379.8 – 0.564 – 0.00 197.581 197.581 75 032 – 75 032
2 n-Butane 550.7 – 0.584 – 0.00 197.581 197.581 108 800 – 108 800
3 Light alkylate 11 188.9 994.92 0.699 1.00 994.92 197.581 197.580 2 210 718 0.99527785 2 262 918
4 Heavy alkylate 57.1 5.08 0.754 0.93 4.72 197.581 183.750 10 488 0.00472187 10 736
5 Total 12 176.4 1 000.00 994.64
11 246.00
2 405 039 2 457 487
–183 832 –183 832
2 221 207 1.000000000 2 273 655
6 Loss
265.9
7 Total 12 442.3
The cost of one conditional unit is as follows:
Feedstock 2 457 487 US$ : 12 442.3 t = 197.51 US$/t
Feedstock 197.51 : 999.64 = 0.197581 i.e. 197.581 US$/t
4.10 Instruments for Determining Energy and Processing Efficiency of Alkylation Unit 125125
Tab. 68 Determining the cost prices of refinery products on alkylation unit
Item no. Elements for calculation Q’ty in tonnes Total in US$ Cost price US$/t Isobutane
n
-Butane Light alkylate Heavy alkylate
12 3 4 5 678 9
1 Q’ty in tons 12 176 379.8 550.7 11 188.9 57.1
2 (%) from equivalent numbers – – 0.99527785 0.004721865
3 (%) from q’ty – – 0.994924528 0.00507547
4 Entering charge 12 442 2 457 487 197.51
5 Feedstock 12 442 2 457 487 197.51 75 032 108 800 2 262 918 10 736
6 Chemicals 46 463 46 244 219
7 Water 1 264
282 1
8 Steam 755 478 373 143 1 770
9 Electric power 229 277 67 161 319
10 Fuel –
11 Depreciation 43 744 613 064 3 127
12 Other production costs 685 936 564 355 2 879
13 Wages 1 627 536 1 339 058 6 831
14 Taxes 715 913 589 019 3 005
15 Unit management costs 1 243 385 1 022 997 5 219
16 Laboratory and maintenance costs 152 512 130 912 668
17 Common services costs 151 288 129 861 662
18 Total costs 39 945 986 75 032 108 800 7 139 015 35 437
19 Cost price in US$/t 221.68 190.57 260.07 638.04 620.84
4 Instruments for Determining Energy and Processing Efficiency of an Oil Refinery126
The cost prices of semi-products generated on the alkylation unit, were calculated in
the following manner, using the product density method:
*
Proportional costs are distributed to semi-products generated in this unit according
to the percentages obtained from equivalent numbers by means of the density
method and a reference product named light alkylate whose density is 0.699 g/
cm
3
(Tab. 67, Column 5).
*
Fixed costs of the unit are distributed to semi-products according to yields, that is,
in equal amounts per tonne of derivatives obtained on this unit (Tab. 68, Line 3).
*
The loss is calculated in the refinery cost price.
By using the mentioned methodology for distributing the proportional and fixed
costs of this unit to the bearers of costs, i.e. to the products obtained in this unit,
the following cost prices of semi-products are established:
Semi-product US$/t
Iso-butane 197.58
n-Butane 197.58
Light alkylate 638.04
Heavy alkylate 620.84
4.10 Instruments for Determining Energy and Processing Efficiency of Alkylation Unit 127127
5
Blending of Semi-Products into Finished Products
and Determining Finished Product Cost Prices
The procedure of blending semi-products into finished products can begin after
determining the semi-product cost prices on each refinery unit (primary and secon-
dary units). Determining the cost prices of finished products is simpler than those of
the semi-products.
Once semi-product cost prices are determined, the cost price of finished products is
calculated by multiplying the semi-product quantity by its cost price. It is also neces-
sary to define the cost prices of initial and final stocks both for semi- and finished
products.
In this particular case, the cost prices of stocks are defined at the level of cost prices
of semi-products and/or finished products, because a typical oil refinery is taken as an
example for demonstrating the cost prices, in the case when the cost prices in oil
refineries do not exist. Considering that semi-product blending is performed at a spe-
cial place of costs, it is necessary to distribute the costs of this place to the cost bearers,
i.e. the products, in order to obtain the full cost price. Thus-determined full cost prices
of finished products, in comparison with the finished-product selling prices, provide
the possibility of determining the profit, i.e. loss per derivative. In such a way, the
profit is considered as a function of choosing the optimum mode of managing the
crude-oil processing technology.
The procedure of blending the semi-products into finished products is demon-
strated by taking the blending of gasoline, diesel fuel and fuel-oil medium as an ex-
ample (see Tables 69, 70 and 71).
The profit or loss, depending on the achieved ratio between selling and cost prices, is
a result of the positive and/or negative difference in prices, on the one hand, and the
difference between the produced and sold products, on the other.
Oil Refineries. O. Ocic
Copyright ª 2005 WILEY-VCH Verlag GmbH & Co. KGaA, Weinheim
ISBN: 3-527-31194-7
129129
Tab. 69 Determining the cost price of gasoline premium; quantity:
504 273.1 t
Item
no.
Semi products Refinery unit Quantity in
tonnes
Cost price
US$/t
Total in 10
3
US$
12 3 4 5 6
1 Butane Catalytic Cracking and
Gas Concentration Unit
23 540.4 207.82 4 892
2 Iso-butane Alkylation and Gas
Concentration Unit
232.3 217.3 51
3 Aliphatic solvent Redistillation Unit 715.4 426.24 305
4 Benzene (aromatic) Aromatics Extraction 82.8 354.84 29
5 Stabilized gasoline Gas Concentration Unit 22 912.8 209.36 4 797
6 Merox gasoline Crude Unit 3 035.2 207.87 631
7 Raffinate Aromatics Extraction 3 376.5 279.99 945
8 Light p latformate Catalytic Reforming 5 750.5 232.44 1 337
9 Heavy platformate Catalytic Reforming 120 954.3 268.96 32 532
10 Light gasoline Crude Unit 12 923.9 253.75 3 279
11 Pyrolytic gasoline Purchasing 53 472.6 241.75 12 927
12 Light alkylate Alkylation 3 873.9 638.06 2 472
13 Light cracked gasoline Catalytic Cracking 45 832.5 280.62 12 862
14 Heavy cracked gasoline Catalytic Cracking 181 400.6 244.93 44 430
15 Platformate Catalytic Reforming 23 052.2 261.13 6 020
16 Light and heavy cracked
gasoline
Catalytic Cracking 1 640.6 262.78 431
17 Toluene Aromatics Extraction 75.8 347.76 26
18 Dyes Purchasing 889.7 3 920.00 3 488
19 Unifinate Catalytic Reforming 128.8 245.50 32
20 Visbreaking gasoline Visbreaking 186.6 139.00 26
21 FCC gasoline Purchasing 8.4 249.45 2
22 Heavy alkylate Alkylation 34.6 620.87 21
23 Paraffin Purchasing 152.6 46.55 7
24 Total cost price 504 273.1 260.85 131 542
25 Cost of blending 504 273.1 5.58 2 814
26 Cost price of Gasoline
Premium
504 273.1 266.43 134 356
27 Selling price 400.40
28 Made profit/loss 504 273.1 133.97 67 555
29 Initial stock 13 947.0 400.40 5 584
30 Sales 476 785.0 400.40 194 909
31 Final stock 31 435.1 400.40 12 587
5 Blending of Semi-Products into Finished Products and Determining Finished Product Cost Prices130
Tab. 70 Determining the cost price of diesel fuel D-1; quantity: 100
364.9 t
Item
no.
Semi-products Refinery unit Quantity in
tonnes
Cost price
US$/t
Total in 10
3
US$
12 3 4 5 6
1 Petroleum Crude Unit 325.9 210.20 69
2 Jet fuel Hydrodesulfurization 6 992.0 237.67 1 662
3 Diesel fuel Crude Unit 23 469.5 189.20 4 440
4 Light gas oil Crude Unit 48 283.5 196.52 9 489
5 Light gas oil Hydrodesulfurization 12 569.4 244.63 3 075
6 Jet fuel Crude Unit 2 873.1 210.20 604
7 White-spirit Hydrodesulfurization 5 581.5 191.27 1 119
8 Total 100 364.9 203.83 20 457.39
9 Costs of blending 100 364.9 5.58 560
10 Cost price of Diesel D-1 100 364.9 209.41 21 017
11 Selling price 276.70
12 Made profit/loss 100 364.9 67.29 6 754
13 Initial stock 3 378.4 276.70 935
14 Sale of Diesel D-1 96 452.1 276.70 26 688
15 Final stock 7 291.2 276.70 2 017
Tab. 71 Determining the cost price of fuel-oil medium; quantity:
662 612.4 t
Item
no.
Semi-products Refinery unit Quantity in
tonnes
Cost price
US$/t
Total in 10
3
US$
12 3 4 5 6
1 Light gas oil Crude Unit 6 874 198.09 › 1 362
2 Heavy gas oil Crude Unit 35 011.4 190.83 6 681
3 Light residue Crude Unit 19 992.5 173.89 3 476
4 Light vacuum gas oil Vacuum Distillation 18 964.4 190.56 3 614
5 Heavy vacuum gas oil Vacuum Distillation 1 132.1 186.79 211
6 Vacuum residue Vacuum Distillation 116 399.5 169.83 19 768
7 Visbreaking residue Visbreaking 333 103.1 187.70 62 523
8 Non-conditioned fraction Vacuum Distillation 3 351.8 171.73 576
9 Light recycled gas oil Catalytic Cracking 73 434.8 211.79 15 553
10 Decanted oil Catalytic Cracking 54 301.1 201.68 10 951
11 Paraffin Purchasing 47.7 44.55 2
12 Total 662 612.4 188.22 124 718.2
13 Costs of blending 662 612.4 5.58 3 697
14 Cost price of Fuel-oil
medium
662 612.4 193.80 128 416
15 Selling price 161.60
16 Made profit/loss 662 612.4 –32.20 –21 337
17 Initial stock 23 126.7 161.60 3 737
18 Sale of Fuel-oil medium 627 017.7 161.60 101 326
19 Final stock 58 721.4 161.60 9 489
131131
The mentioned differences are presented by taking fuel-oil medium as an example:
Fuel-oil medium t US$/t Total in 10
3
US$/t
1234
Production 662 612.4 193.80 128 414
Sales 627 017.7 161.60 101 326
Difference 35 594.7 32.20 27 088
The difference based on the quantity: 35 594.7 t x 161.60 US$/t = –5 752 000 US$
The difference based on the prices: 662 612.4 t x 32.20 US$/t = –21 336 000 US$
Total: –27 088 000 US$
The cost prices of products, determined by the procedure applicable in determining
the cost prices of gasoline, diesel fuel and fuel-oil medium are as follows:
Item no. Products Cost price US$/t
12 3
1 Propane 228.41
2 Butane 214.44
3 Propane-butane mixture 218.36
4 Aliphatic solvent 60/80 431.82
5 Aliphatic solvent (medical) 440.77
6 Aliphatic solvent 65/105 348.47
7 Aliphatic solvent 80/120 432.42
8 Aliphatic solvent 140/200 432.42
9 Benzene (aromat ic) 356.42
10 Toluene 353.34
11 Gasoline regular 256.90
12 Gasoline premium 266.43
13 Unleaded gasoline 277.66
14 Gasoline G-92 266.27
15 Pyrolytic gasoline 247.33
16 Straight-run gasoline 240.04
17 Fuel gas 164.51
18 Gasoline G-92/0.4 289.94
19 Propylene 191.06
20 Cracked gasoline 222.50
21 Lighting kerosene 243.77
22 Diesel special DS 205.30
23 Jet fuel 244.20
24 Diesel fuel D-1 209.41
25 Diesel fuel D-2 202.37
26 Fuel oil EL 202.07
27 Low sulfur fuel 184.60
28 Ecological fuel EL 250.21
29 Fuel-oil medium 193.80
30 Sulfur 125.59
31 bitumen 209.60
5 Blending of Semi-Products into Finished Products and Determining Finished Product Cost Prices132
The cost prices of finished products, obtained by applying the proposed methodol-
ogy, are in the range of 1:3.6 between the highest and the lowest cost prices, so it can be
considered as a satisfactory range. At the same time, the cost prices of semi-products
are in the range of 1:4.6. The range of product cost prices is the result of the parti-
cipation of semi-products in the structure of finished products. The cost prices of
semi-products depend on the unit and the number of units the crude oil passes
through. The finished products obtained on the crude unit, or that are mainly blended
from the semi-products obtained on the primary sections, have lower cost prices
(for example: motor gasoline, diesel, jet fuel, the cost prices of which range from
200 to 250 US$/t) than the products produced on the final refinery units (for exam-
ple: aliphatic solvents produced on an alkylation unit, the cost prices of which can be
up to 650 US$/t).
Taking gasoline premium as an example, it can be seen that the semi-products, the
cost prices of which range from 200 to 270 US$/t, contribute 87 % to the gasoline
premium structure, while the semi-products with the cost prices ranging from 630
to 650 US$/t contribute only 0.8%. The cost price of gasoline premium is 266.43
US$/t as a result.
Taking diesel fuel as an example, it can be seen that the semi-products generated
mainly on the primary sections, the cost prices of which range from 185 to 210 US$/t,
are the main cause for the cost price of diesel fuel to be 209.41 US$/t (about 75 % of
semi-products blended into diesel fuel are generated on the crude unit).
In the end, determining the profit or loss per individual refinery product, by com-
paring the finished product cost prices, obtained by the proposed methodology, to
their selling prices, represents a simple procedure.
5 Blending of Semi-Products into Finished Products and Determining Finished Product Cost Prices 133133
6
Management in the Function of Increasing Energy
and Processing Efficiency and Effectiveness
6.1
Management in the Function of Increasing Energy Efficiency and Effectiveness
Determining the efficiency and effectiveness of an oil refinery, by way of the instru-
ments mentioned in the previous chapter, is analysed from the aspect of energy and
technology.
From the aspect of energy, the efficiency of refinery units is determined through the
cost prices of high-, medium- and low-pressure steam, while effectiveness is presented
through the savings possibly achieved by eliminating the differences between the tar-
get standard (average energy consumption standard of Western European refineries)
and the specific energy consumption of a typical refinery, which is the subject of this
study.
Energy efficiency is analysed through the cost prices of steam generated in the fol-
lowing refinery units: crude-distillation unit, vacuum-distillation unit, vacuum-residue
visbreaking unit, bitumen, catalytic reforming, fluid catalytic cracking, gas concentra-
tion unit, hydrodesulfurization of jet fuel and gas oil and alkylation.
By comparing the cost prices of medium- and low-pressure steam generated in the
mentioned refinery units, and the cost prices of steam generated in refinery power
plant, substantial differences can be observed. These differences are presented in
Tab. 72.
At the same unit depreciation level, the main reason for such cost-price trends lies in
the savings achieved on fuel, as the most important component in the cost-price cal-
culation in the units being observed, as well as in the surplus of steam supplied to
other consumers. For example, the cost of fuel is completely eliminated on the crude
unit and vacuum-residue visbreaking unit and partially eliminated on the catalytic
cracking unit, while in the cost-price calculation for the steam generated in refinery
power plant, fuel consumption contributes about 80 % to the total costs structure. This
comparison is given in Tab. 73.
In oil refineries, internal energy consumption depends on the level of the complexity
of a refinery. Complexity, i.e. “the depth of crude-oil processing” is increased by en-
larging the product slate and by a number of so-called secondary units.
Oil refineries with the same level of complexity can have low and high levels of
energy efficiency. The difference between energy-efficient and energy-inefficient
Oil Refineries. O. Ocic
Copyright ª 2005 WILEY-VCH Verlag GmbH & Co. KGaA, Weinheim
ISBN: 3-527-31194-7
6.1 Management in the Function of Increasing Energy Efficiency and Effectiveness 135135
oil refineries, on each level of complexity, presents the possibility for rationalization of
energy consumption in inefficient refineries.
Comparison of energy-efficient and energy-inefficient oil refineries is presented by
taking an average energy consumption standard in oil refineries from the former Yu-
goslavia, and the average energy consumption standard of Western European refi-
neries (the target standard), as an example. Energy (in)efficiency indices of refinery
units are presented in Tab. 74 and Graphic 29.
From Tab. 74 and Graphic 29, it can be seen that significant savings may be achieved
on each refinery unit. It has been calculated that for the analysed refinery complex, the
possible savings amount to about 9.2 million US$ per year (see Tab. 75).
Tab. 72 Cost prices of high-, medium- and low-pressure steam in US$/t
Item no. Refinery unit Cost price of steam in US$/t
HpS MpS LpS
12 3 4 5
1 Crude Unit – 0.47 –
2 Vacuum Distillation – 0.44 –
3 Vacuum-re sidue visbreaking Unit – 0.22 0.05
4 Bitumen – 9.89
5 Catalytic Reforming – 0.45
6 Catalytic Cracking 3.10 2.53 1.94
7 Gas Concentration Unit – – –
8 Jet-fuel hydrodesulfurization – – –
9 Gas Oil Hydrodesulfurization – 11.13 6.60
10 Alkylation – – 11.78
11 Refinery Power Plant 10.83 9.66 9.29
Tab. 73 Steam cost prices and fuel oil consumption in US$/t
Item
no.
Refinery unit HpS MpS LpS
Cost
price
Fuel con-
sumption
Cost
price
Fuel con-
sumption
Cost
price
Fuel con-
sumption
12 3 4 5 6 7 8
1 Crude Unit – – 0.47 – – –
2 Vacuum Distillation – – 0.44 – – –
3 Vacuum-residue visbreaking Unit – – – – 0.05 –
4 Bitumen – – – – 9.89 –
5 Catalytic Reforming – – 0.45 – – –
6 Catalytic Cracking 3.10 2.98 2.53 2.40 1.94 1.83
7 Gas Concentration Unit – – – – – –
8 Jet-fuel hydrodesulfurization – – – – – –
9 Gas Oil Hydrodesulfurization – – 11.13 – 6.60 –
10 Alkylation – – – – 11.78 –
11 Refinery Power Plant 10.83 9.45 9.66 8.09 9.29 7.02
6 Management in the Function of Increasing Energy and Processing Efficiency and Effectiveness136
These savings can be achieved by applying more efficient-energy and technological
solutions.
Namely, substantial possibilities for rationalization of energy consumption exist
because present refineries were built at the time when energy was cheap, and
when the investors did not pay any attention to the cost of energy. These possibilities
include the following actions:
– continuous monitoring of energy consumption and costs,
– identification of the places of irrational energy consumption and preparation of the
energy-saving programmes,
– modernization of equipment and introduction of computer management,
Graphic 29 Total specific net energy consumption and target standard
of net energy consumption in crude-oil processes
Tab. 74 Total specific net energy consumption and target net energy
consumption standard in crude-oil processing
Item
no.
Refinery unit Total specific
net energy
consumption
MJ/t
Target net
energy
consumption
standard MJ/t
(In)efficiency
index
12 3 4 5
1 Crude Unit 1 095.5 800 137
2 Vacuum Distillation 630.9 450 140
3 Vacuum-residue visbreaking Unit 1 325.2 1 200 110
4 Bitumen 1 626.7 1 300 125
5 Catalytic Reforming 3 232.2 2 800 115
6 Catalytic Cracking with 1 508.7 1 300 116
Gas Concentration Unit
7 Jet-fuel hydrodesulfurization 1 471.8 900 164
8 Gas Oil Hydrodesulfurization 1 130.4 800 141
9 Alkylation 11 595.6 6 000 193
10 Total refinery complex 2 384.9 1 824.3 131
6.1 Management in the Function of Increasing Energy Efficiency and Effectiveness 137137