Ozren Ocic Oil Refineries in the 21st CenturyOil phần 7 potx
Bạn đang xem bản rút gọn của tài liệu. Xem và tải ngay bản đầy đủ của tài liệu tại đây (248.73 KB, 15 trang )
used for heating the stripper bottom reflux for stripping and preheating the reactor
reflux charge. The steam from the stripper is returned to the fractionator.
Decanted oil, as a product from the fractionator bottom, is cooled in the heat ex-
changers and led out of the unit.
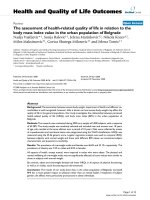
The temperatures in the reactor are 510–520 8C, in the regenerator 700–710 8C and
in the fractionator 130–500 8C.
Technological characteristics of the process are shown in Fig. 12.
4.6.2
Energy Characteristics of the Process
In a typical fluidized catalytic cracking process, the heavy vacuum gas oil from the
vacuum-distillation process is preheated in heat exchangers by means of product
reaction heat, before entering the process heater.
The high-pressure steam (HpS) is produced in the boiler by utilization of flue-gas
heat flux from the regenerator. One portion of the steam generated is used for the
main pump drive and compressors, through the high-pressure turbines. The medi-
um-pressure steam (MpS) is generated in the heat exchangers and it can also be gen-
erated by reduction of high-pressure steam through the high-pressure turbines. A total
amount of generated medium-pressure steam is used for this unit, but this makes only
40 % of the total requirements. The medium-pressure steam is used for the pump
drive through the medium-pressure turbines, for blowing in the regenerator, for strip-
ping, etc.
Fig. 12 Technological characteristics of catalytic cracking process
4 Instruments for Determining Energy and Processing Efficiency of an Oil Refinery82
The low-pressure steam (LpS) is obtained by reduction of medium-pressure steam
in the medium-pressure turbines. One portion of this steam is used for heating tubes,
some other equipment, etc.
Electric energy is used to drive the pumps, fans and other equipment and, also, some
auxiliary facilities.
Compressed air is preheated in the heat exchanger by means of the medium-pres-
sure steam, and introduced into the regenerator.
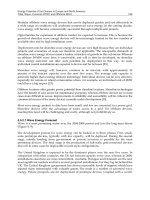
The main energy characteristics of the fluidized catalytic cracking process are given
in Fig. 13 where the more important alternatives of supplying the energy required for
the process are also shown. Each of these alternatives is one of the possible solutions
for such a process [20].
For the purpose of this process a block energy-flow scheme, and Senky’s diagram for
the energy balance are shown in Scheme 7 and Diagram 6.
The values given for the energy consumption refer to the annual volume of produc-
tion amounting to 821 239 t of inlet charge for a specific slate of products.
The difference between gross and net energy consumption appears in the case of
high-, medium- and low-pressure steam due to the internal generation of these heat
carriers in the same process.
Internal generation of high-pressure steam is 570000 t or 1835 TJ and meets the
process requirements of 410000 t or 1 320 TJ. One part of this steam, 150 000t or
483 TJ is used for pump drive and compressors over turbines, and the other part
of 260 000 t or 837 TJ for other process requirements. Gross consumption totals
410 000 t or 1320 TJ, and net consumption is zero. The difference between internal
generation and gross consumption, which amounts to 160 000 t or 515 TJ, is given
to the other consumers within the refinery [21].
Fig. 13 Energy characteristics of catalytic cracking process with gas concentration unit
4.6 Instruments for Determining Energy and Processing Efficiency of Catalytic Cracking Unit 8383
Scheme 7 Energy flows of catalytic cracking process with gas concentration unit
Diagram 6 Senky’s diagram of energy flows of catalytic cracking process with gas concentration unit, in TJ/y
4 Instruments for Determining Energy and Processing Efficiency of an Oil Refinery84
4.6.3
Determining the Steam Cost Price
The cost prices of high-, medium- and low-pressure steam are determined by the
methodology for determining the cost prices of by-products, considering that the main
activity of this refinery unit, as well as the other refinery units, is crude-oil processing
and the production of refinery derivatives.
The cost of internal generation of high-pressure steam is 5.09 US$/t. Considering
the fact that 160 000 t/y, out of the total steam generated (570 000 t/y), is intended for
the other consumers within the refinery, the costs of internal steam generation
amount to 3.10 US$/t, which is approximately three times lower than those of
high-pressure steam generated in the refinery power plant (Tab. 38).
Internal generation of medium-pressure steam is 190 000 t or 568 TJ. Out of this
quantity, 40 000 t or 120 TJ is obtained in heat exchangers, and 150 000 t or 448 TJ by
reduction of high-pressure steam on back-pressure turbines. Gross consumption of
this steam is 450 000 t or 1345 TJ. The difference between the gross consumption and
internal generation is the net consumption of medium-pressure steam brought to this
process from the outside. Net consumption is 260 000 t or 777 TJ.
Internal generation of medium-pressure steam (MpS) in the amount of 190 000 t/y
is achieved in two ways: 150 000 t of MpS is achieved by reduction of high-pressure
steam on back-pressure turbines at the cost of 3.16 US$/t, and 40 000 t in heat ex-
changers at the cost of 0.19 US$/t.
The average cost price of medium-pressure steam, generated in this unit, is 2.53
US$/t however, because of the consumption of the steam brought from the power
plant at the cost price of 10.19 US$/t, the average cost price for gross medium-pres-
sure steam consumption is 6.96 US$/t (Tab. 39).
Tab. 38 Cost price of high-pressure steam (HpS)
Item
no.
Elements for
calculation
Annual
q’ty in t
US$/t Generation
of HpS
in US$
HpS consumption (US$)
for
process
HpS!
MpS
other
consumers
(%) from q’ty 100.000000 45.614036 26.315789 28.070175
1 Fuel gas in boiler 20 347 135.0 2 746 845 1 252 947 722 854 771 044
2 Demineralized water 570 000 0.165 94 050 42 900 24 750 26 400
3 Depreciation 46 965 21 423 12 359 13 183
4 Current and investment
maintenance
5 636 2 571 1 483 1 582
5 Insurance premium 3 757 1 713 989 1 055
6 Gross wages 3 360 1 533 884 943
7 Other costs 1 792 817 472 503
8 Cost prices (1-7) 2 902 405 1 323 904 763 791 814 710
9 Quantity in t/y 570 000 260 000 150 000 160 000
10 Cost prices US$/t 5.09 5.09 5.09 5.09
11 Cost prices reduced for other consumers US$/t 3.10 3.10
4.6 Instruments for Determining Energy and Processing Efficiency of Catalytic Cracking Unit 8585
Internal generation of low-pressure steam (LpS) amounts to 150 000 t or 417 TJ and
it is obtained by reduction of MpS on back-pressure turbines. Gross consumption
totals 120 000 t or 334 TJ, and net consumption is zero. The difference between in-
ternal generation and gross consumption in the amount of approximately 30 000 t or
83 TJ is given to the other consumers within the refinery.
Tab. 39 Cost price of medium-pressure steam (MpS)
Item
no.
Elements for
calculation
Annual
q’ty in t
US$/t MpS
generation
in US$
MpS consumption (US$)
for
process
MpS!LpS
steam
(%) from quantity 100.00 66.67 33.33
1 Entrance of HP steam 150 000 3.10 465 000 310 016 154 985
2 Depreciation 7 215 4 810 2 405
3 Current and investment 866 577 289
maintenance
4 Insurance premium 577 385 192
5 MP steam by reduction 150 000 3.16 473 658 315 788 157 870
of HP steam
6 Demin water in heat exchanger 40 000 0.165 6 600 4 400 2 200
7 Depreciation 838 559 279
8 Current and investment 101 67 34
maintenance
9 Insurance premium 67 45 22
10 MP steam from heat exchanger 40 000 0.19 7 606 5 071 2 535
11 Internal generation (5+10) 190 000 2.53 481 264 320 859 160 405
12 Steam from Power Plant 260 000 10.19 2 649 400 1 766 355 883 045
13 Total MP steam (11+12) 3 130 664 2 087 214 1 043 450
14 Quantity in t/y 450 000 300 000 150 000
15 Cost price in US$/t 6.96 6.96 6.96
Tab. 40 Cost price of low-pressure steam (LpS)
Item
no.
Elements for calculation Annual
q’ty in t
US$/t LpS
generation
in US$
LpS consumption (US$)
for
process
for other
consumers
(%) from quantity 100.00 80.00 20.00
1 Entrance of HP steam 150 000 2.53 379 500 303 600 75 900
2 Depreciation 7 213 5 770 1 403
3 Current and investment
maintenance
866 693 173
4 Insurance premium 577 462 115
5 Total LP steam 150 000 388 156 310 525 77 631
6 Quantity in t/y 150 000 120 000 30 000
7 Cost price in US$/t 2.59 2.59 2.59
8 Cost prices reduced for other consumers US$/t 1.94
4 Instruments for Determining Energy and Processing Efficiency of an Oil Refinery86
The cost price of low-pressure steam obtained by reduction of medium-pressure
steam on back-pressure turbines amounts to 1.94 US$/t (after the medium-pressure
steam supplied from the refinery power plant has been excluded from the calculation,
and after the costs of 30 000 t of low-pressure steam supplied to the other consumers
within the refinery have been cleared) (Tab. 40).
4.6.4
Energy Efficiency of the Process
Specific steam consumption is related to the quantity of incoming feedstock of 821
239 t. As already explained, the surplus of high- and low-pressure steam generated in
this process is supplied to the other processes within the refinery. Because of this, in
the procedure of calculating the specific net energy consumption the energy value of
the delivered steam should be subtracted from that of the fuel consumed, i.e.:
1015 Àð515 þ 83Þ TJ
821 239 t of feedstock
¼ 507:4
MJ
t of feedstock
The target standard of net energy consumption and specific gross and net energy
consumption are outlined in Tab. 41, and Tab. 42 is the financial presentation of en-
ergy consumption and money savings that can be achieved by eliminating the differ-
ences between the target standard and specific gross and net energy consumption of
this refinery unit.
If the specific net energy consumption of a typical plant is compared with the target
standard, the following conclusions can be drawn:
Tab. 41 Target standard of net energy consumption and specific
energy consumption on a typical catalytic cracking unit with gas con-
centration unit (quantity of energy per one tonne of feedstock)
Energy carriers Target standard
of net energy
consumption
Specific energy consumption in the plant
Specific gross energy
consumption
Specific net energy
consumption
(kg/t)
1
(kWh/t)
(MJ/t) (kg/t)
1
(kWh/t)
(MJ/t)
(MJ/t) (kWh/t)
per unit total per unit total
Fuel
Fuel gas * – 24.8 1 235.6 1 235.6 * * 507.4
Heat carriers 3 696.2 944.8
LP steam * – 146 450.9 – – –
MP steam * – 548 1 638.5 316 944.8
HP steam * – 499 1 606.8 – – –
Sources of heat 1 246 –––4931.8 – – 1 452.2
Electric energy 54 15 15.7
1
56.5 56.5 15.7
1
56.5 56.5
Energy carriers 1 300 –––4988.3 – – 1 508.7
4.6 Instruments for Determining Energy and Processing Efficiency of Catalytic Cracking Unit 8787
1. Specific electric energy consumption is close to the target standard.
2. Specific net process and thermal energy consumption (fuel and steam) of 1452.2
MJ/t is 17 % higher than the target standard that amounts to 1246 MJ/t, i.e. 0.51
US$ per tonne of feedstock.
3. Total specific net energy consumption of 1508.7 MJ/t is 16% higher than the target
standard (1300 MJ/t, i.e. 0.62 US$ per tonne of feedstock). This means that, in
comparison with the target standard of net energy consumption, the typical plant
has an efficiency/inefficiency index of 116.
The cause of the relatively high energy efficiency of the unit is the production of a
considerable quantity of steam in the heat exchangers by using the heat of products,
and in the boiler by using the heat of gases from the catalyst regenerator [22].
Regardless of the relatively high energy efficiency of the unit, there are certain fac-
tors, by elimination of which, the energy efficiency could be increased further. The
most important factors are:
Tab. 42 Financial presentation of energy consumption and money
savings on a typical catalytic cracking unit with gas concentration unit
(in US$)
Specific gross energy consumption
Energy carriers Q’ty of feedstock US$
821 239 t
Fuel gas 821 239 t (1 235.6 MJ/t  0.0027 US$/MJ) = 2 739 752
Low-pressure steam 821 239 t 450.9 MJ/t  0.001906 US$/MJ) = 705 785
Medium-pressure steam 821 239 t (1 638.5 MJ/t  0.002328 US$/MJ) = 3 132 557
High-pressure steam 821 239 t (1 606.8 MJ/t  0.000963 US$/MJ) = 1 270 743
Sources of heat 821 239 t (4 931.8 MJ/t  0.001938 US$/MJ) = 7 848 837
Electric energy 821 239 t (56.5 MJ/t  0.0167 US$/MJ) = 774 880
Energy carriers 821 239 t (4 988.3 MJ/t  0.002105 US$/MJ) = 8 623 717
Specific net energy consumption
US$/t
Fuel gas (507.4 MJ/t  0.0027 US$/MJ) = 1.369980
Medium-pressure steam (944.8 MJ/t  0.002328 US$/MJ) = 2.199494
Sources of heat (1 452.2 MJ/t  0.002458 US$/MJ) = 3.569474
Electric energy (56.5 MJ/t  0.0167 US$/MJ) = 0.943550
Energy carriers (1 508.7 MJ/t  0.002991 US$/MJ) = 4.513024
Sources of heat:
Internal net energy consumption (1 452.2 MJ/t  0.002458 US$/MJ) = 3.57
Target net energy consumption (1 246 MJ/t  0.002458 US$/MJ) = 3.06
Difference: 0.51
Energy carriers:
Internal net energy consumption (1 508.7 MJ/t  0.002991 US$/MJ) = 4.51
Target net energy consumption (1 300 MJ/t  0.002991 US$/MJ) = 3.89
Difference: 0.62
4 Instruments for Determining Energy and Processing Efficiency of an Oil Refinery88
– non-economical combustion in the process heater,
– nonexistence of the air preheating before entering the process heater,
– inefficient preheating of feedstock before entering the process heater (high level of
heat exchanger fouling), and
– nonutilization of the flue gas flux in the process heater.
4.6.5
Determining the Refinery Cost Prices
The main purpose of the catalytic cracking unit is to convert heavy hydrocarbons into
light, more valuable hydrocarbons by a cracking process in the presence of a catalyst
and at high temperature.
For determining the cost prices of semi-products obtained on this unit, it is neces-
sary first to determine the cost prices of semi-products obtained on the crude unit and
vacuum-distillation unit (considering that light residue from the crude unit presents a
feedstock for vacuum distillation and vacuum gas oils are the products obtained on the
vacuum-distillation unit).
The cost prices of semi-products produced on the catalytic cracking unit are deter-
mined by equivalent numbers obtained by means of the density method, as the best
method, although equivalent numbers can be determined by the following methods as
well:
– thermal value method, and
– average production cost method.
By analysing the results obtained by using different calculation bases for determin-
ing the equivalent numbers, taking feedstock in the catalytic cracking unit, which
presents 86.84 % of total costs, as an example, considerable differences per tonne
can be seen. These differences are presented in Tab. 43 and Graphics 17 and 18.
Tab. 43 Cost prices of semi-products on catalytic cracking unit in
US$/t (per calculating bases)
Item
no.
Semi products Base for determining the equivalent number
for calcul ating the cost prices
Product Density
Method
Thermal Value
Method
Average Production
Cost Method
12 3 4 5
1 Light cracked gasoline 199.75 192.01 185.48
2 Heavy cracked gasoline 171.79 187.70 185.48
3 Light cycle gas oil 145.82 181.09 185.48
4 Decanted oil 137.90 177.15 185.48
4.6 Instruments for Determining Energy and Processing Efficiency of Catalytic Cracking Unit 8989
Besides the significant differences in cost prices of the same refinery products that
depend on the calculating bases for determining the equivalent numbers, for example,
the cost price of light cracked gasoline is from 199.75 US$/t (the base for determining
the equivalent numbers is product density) to 185.48 US$/t (the base for determining
the equivalent numbers is quantity of production), different ranges in oil-product cost
prices can be noted even with the same calculating bases. For example, when product
density is the base for determining the equivalent numbers, the cost prices range from
199.75 US$ (light cracked gasoline) to 137.90 US$ (decanted oil).
The stated examples of the calculating bases’ effects on determining the equivalent
numbers do not present all the dilemmas that experts dealing with process-industry
Graphic 17 Cost prices of semi-products on catalytic cracking unit,
per products (in US$/t)
Graphic 18 Cost prices of semi-products on catalytic cracking unit,
per calculating bases (in US$/t)
4 Instruments for Determining Energy and Processing Efficiency of an Oil Refinery90
calculations can face. The choice of reference derivatives on determining the equiva-
lent numbers is also important. The effects of the choice of reference derivatives (light
cracked gasoline whose density is 0.667 g/cm
3
, heavy cracked gasoline whose density
is 0.773 g/cm
3
and light cycle gas oil whose density is 0.905 g/cm
3
) on determining the
equivalent numbers, in the case of using the same calculating bases for determining
the equivalent numbers (density method) are shown in Tab. 44.
It can be seen that the differences appearing in this case are smaller than those
appearing in the previous example of determining the equivalent numbers by diffe-
rent calculating bases (density, thermal value and quantity of products).
The results obtained by using the different reference derivatives, but the same cal-
culating base, i.e. density method, are shown in Tab. 44 and Graphics 19 and 20).
The cost prices of semi-products generated on the catalytic cracking unit were cal-
culated in the following manner, using the product density method:
Tab. 44 Cost prices of semi-products on catalytic cracking unit in
US$/t (per reference products)
Item
no.
Semi-products Reference products
Light cracked
gasoline
Heavy cracked
gasoline
Light recycled
gas oil
12 3 4 5
1 Light cracked gasoline 199.75 202.53 205.47
2 Heavy cracked gasoline 171.79 174.59 176.76
3 Light recycled gas oil 145.82 148.41 151.08
4 Decanted oil 137.90 138.67 142.01
Graphic 19 Cost prices of semi-products on catalytic cracking unit,
per different reference products (in US$/t)
4.6 Instruments for Determining Energy and Processing Efficiency of Catalytic Cracking Unit 9191
*
Proportional costs are distributed to semi-products generated in this unit according
to the percentages obtained from equivalent numbers by means of the density
method and reference product, i.e. light cracked gasoline whose density is
0.667 g/cm
3
(Tab. 45, Column 5).
*
Fixed costs are distributed to semi-products according to the percentages obtained
from the quantity (Tab. 46, Line 3).
*
Liquid petroleum gas, dry gas and slop are expressed on the level of the average
feedstock price.
*
From a methodological aspect, the loss (coke in this case as well) is included in the
refinery cost prices.
By using the mentioned methodology, the following cost prices of semi-products,
i.e. refinery products obtained in this unit, are set:
Semi-products Cost prices in US$/t
Dry gas 185.48
Propane 185.48
Propylene 185.48
Butane 185.48
Propane-butane mixture 185.48
Light crack ed gasoline 280.63
Heavy cracked gasoline 244.94
Light recycled gas oil 211.80
Decanted oil 201.60
Sulfur 120.02
Slop 185.48
Graphic 20 Cost prices of semi-products on catalytic cracking unit,
per same reference products (in US$/t)
4 Instruments for Determining Energy and Processing Efficiency of an Oil Refinery92
Tab. 45 Determining the equivalent numbers for distributing the proportional costs on catalytic cracking unit
Item
no.
Oil products Quantity
in tonnes
Q’ty from
1 tonne
Density
g/cm
3
Equivalent
numbers
Condition
units
Cost of
1 condition
unit
Cost price
in US$/t
Cost of
feedstock
in US$
(%) for
prortional
costs
Cost of feed-
stock in US$
(entry-exit)
1 2 3 4 5 6 7(4 Â 6) 8 9(6 Â 8) 10(3 Â 9) 11 12
1 Dry gas 64 989.9 – 0.410 – 0.00 224.159 185.48 12 054 332 – 12 054 332
2 Propane 16 436.9 – 0.508 – 0.00 224.159 185.48 3 048 710 – 3 048 710
3 Propylene 34 939.3 – 0.518 – 0.00 224.159 185.48 6 480 539 – 6 480 539
4 Butane 90 342.5 – 0.583 – 0.00 224.159 185.48 16 756 720 – 16 756 720
5 Propane-butane mix 1 737.6 – 0.545 – 0.00 224.159 185.48 322 291 – 322 291
6 Light cracked gasoline 109 231.9 139.90 0.667 1.00 137.90 224.159 224.16 24 485 313 0.166656406 24 485 313
7 Heavy cracked gasoline 403 642.9 509.58 0.773 0.86 438.24 224.159 192.78 77 812 967 0.529624822 77 812 967
8 Light recycled gas oil 177 346.3 223.89 0.905 0.73 163.44 224.159 163.64 29 020 253 0.197522945 29 020 253
9 Decanted oil 99 700.2 125.87 0.973 0.69 86.85 224.159 154.67 15 420 607 0.104958553 15 420 607
10 Sulfur 2 191.8 2.77 1.800 0.37 1.02 224.159 82.94 181 782 0.001237277 181 782
11 Slop 23 134.7 – – – 0.00 224.159 185.48 4 291 026 – 4 291 026
12 Total 1 023 694.0 1 000.00 827.45
792113.10
189 874 539 200 069 966
–42 953 617 –42 953 617
146 920 922 1.000000000 157 116 349
13 Loss 0.0
14 Total 1 023 694.0
The costs of one conditional unit are as follows:
Feedstock 200 069 966 US$ : 1 078 661 t = 185.48 US$/t
Feedstock 185.48 : 827.45 = 0.224158559 i.e. 224.159 US$/t
4.6 Instruments for Determining Energy and Processing Efficiency of Catalytic Cracking Unit 9393
Tab. 46 Determining the cost prices of refinery products on catalytic cracking unit
Item
no.
Elements for
calculation
Q’ty in
tonnes
Total
in US$
Cost price
US$/t
Dry gas Propane Propylene Butane Propane-
butane
mixture
Light
cracked
gasoline
Heavy
cracked
gasoline
Light
recycled
gas oil
Decanted
oil
Sulfur Slop
12 3 4 5 6 7 8 9 10111213 14 15 16
1 Q’ty in tons 1 023 694 64 989.9 16 436.9 34 939.3 90 342.5 1 737.6 109 231.9 403 642.9 177 346.3 99 700.2 2 191.8 23 134.7
2 (%) from equiva-
lent numbers
– – – – – 0.16665641 0.52962482 0.19752294473 0.104958553 0.00123728
3 (%) from q’ty – – – – – 0.13789936 0.50957737 0.22389012736 0.12586616384 0.00276698
4 Vacuum light
gas oil
8 378 1 596 582 190.56
5 Vacuum heavy
gas oil
974 349 181 998 633 186.79
6 Non-conditioned
fraction
95 934 16 474 752 171.73
7 Feedstock 1 078 661 200 069 966 185.48 12 054 332 3 048 710 6 480 539 16 756 720 322 291 26 184 446 83 212 719 31 034 084 16 490 705 194 396 4 291 026
8 Chemicals 2 587 644
431 247 1 370 480 511 119 271 595 3 202
9 Water 5 317
886 2 816 1 050 558 7
10 Steam 4 031 731
671 914 2 135 305 796 359 423 165 4 988
11 Electric power 1 382 497
230 402 732 205 273 075 145 105 1 711
12 Fuel 1 973 960
328 973 1 045 458 389 902 207 184 2 442
13 Depreciation 2 162 021
298 141 1 101 717 484 055 272 125 5 982
14 Other production
costs
2 656 757 366 365 1 353 823 594 822 334 396 7 351
15 Wages 6 303 747
869 283 3 212 247 1 411 347 793 428 17 442
16 Taxes 2 772 862
382 376 1 412 988 620 817 349 010 7 672
17 Unit management
costs
4 815 859 664 104 2 454 053 1 078 223 606 154 13 325
18 Laboratory and
maintenance costs
822 373 113 405 419 063 184 121 103 509 2 275
19 Common services
costs
815 771
112 494 415 698 182 643 102
678 2 257
20 Total costs 230 400 504 12 054 332 3 048 710 6 480 539 16 756 720 322 291 30 654 036 98 868 571 37 561 617 20 099 611 263 052 4 291 026
21 Cost price in
US$/t
213.60 185.48 185.48 185.48 185.48 185.48 280.63 244.94 211.80 201.60 120.02 185.48
4 Instruments for Determining Energy and Processing Efficiency of an Oil Refinery94
4.7
Instruments for Determining Energy and Processing Efficiency
of Gas Concentration Unit
4.7.1
Technological Characteristics of the Process
Treatment of liquid and gas products from the top separator of a catalytic cracking
fractionator is performed in the gas concentration unit with fractionation. In such a
way, all liquid products of light hydrocarbons are separated and other gas products are
sent to the fuel-gas system.
The products of this process are as follows:
– fuel gas,
– liquid propylene for the storage,
– liquid propane for the storage,
– liquid butane for alkylation unit or for the storage,
– light gasoline for the storage (after sulfur removal),
– heavy gasoline for the storage (after sulfur removal).
All the above-mentioned technological characteristics of this process are shown in
Fig. 14.
Energy characteristics of the gas concentration process, the cost prices of steam, as
well as energy efficiency of the unit, are given in the part of this book dealing with the
energy efficiency of the catalytic cracking unit with gas concentration and fractiona-
tion.
Fig. 14 Technological characteristics of gas concentration process
4.7 Instruments for Determining Energy and Processing Efficiency of Gas Concentration Unit 9595
4.7.2
Determining the Refinery Product Cost Prices
The feedstock for this unit is wet gas and light gasoline from the catalytic reforming
unit, liquid petroleum gas and light gasoline from the crude unit and light gasoline
from gasoline redistillation. In this unit, the following products are obtained by the
fractionation process: propane, butane and stabilized gasoline (about 40% of the total
production).
The cost prices of semi-products obtained in the gas concentration unit are deter-
mined by equivalent numbers obtained by means of the density method, although
equivalent numbers can be determined by the following methods as well:
– thermal value method, and
– average production cost method.
By analysing the results obtained by using the different calculation bases for deter-
mining equivalent numbers, taking feedstock of gas concentration as an example,
considerable differences in the cost prices of oil products generated in this unit
can be noted. These differences are presented in Tab. 47 and Graphics 21 and 22.
Besides the significant differences in cost prices of the same refinery product that
depend on the calculating bases for determining the equivalent numbers, for example,
the cost price of stabilized gasoline is 174.47 US$/t (the base for determining the
equivalent numbers is product density) to 190.66 US$/t (the base for determining
the equivalent numbers is quantity of products), the different ranges in oil-product
cost prices can be noted even with the same calculating base. For example, when pro-
duct density is the base for determining the equivalent numbers, the cost prices range
from 174.47 US$/t (stabilized gasoline) to 223.68 US$/t (propane).
The stated examples of the calculating bases’ effects on determining the equivalent
numbers do not present all the dilemmas that experts dealing with process-industry
calculations can face. The effects of the choice of reference derivatives (propane whose
Tab. 47 Cost prices of semi-products on gas concentration unit in
US$/t (per calculating bases)
Item
no.
Semi products Base for determining the equivalent number
for calcul ating the cost prices
Product Density
Method
Thermal Value
Method
Average Production
Cost Method
12 3 4 5
1 Propane 223.68 194.42 190.66
2 Butane 194.60 192.18 190.66
3 Iso-butane 201.31 191.68 190.66
4 Propane-butane mixture 205.78 193.13 190.66
5 Stabilized gasoline 174.47 187.92 190.66
4 Instruments for Determining Energy and Processing Efficiency of an Oil Refinery96