HPLC for Food Analysis phần 5 docx
Bạn đang xem bản rút gọn của tài liệu. Xem và tải ngay bản đầy đủ của tài liệu tại đây (288.12 KB, 14 trang )
45
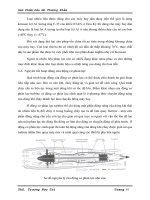
Fat-soluble vitamins
Column 100 x 2.1 mm
Hypersil MOS, 5 µm
Mobile phase A = water
B = ACN (70 %)
Gradient at 15 min 90 % B
at 16 min 95 % B
Post time 3 min
Flow rate 0.5 ml/min
Column compartment 40 ºC
Injection volume 2–5 µl
Detector UV-DAD
detection wavelengths
230/30 nm, 400/100 nm;
reference wavelengths
280/40 nm, 550/100 nm
HPLC method performance
Limit of detection 1 ppb with S/N = 2
Repeatability of
RT over 10 runs < 0.82 %
areas over 10 runs < 2.2 %
Sample preparation
Different food matrices require different extraction
procedures. These procedures include alkaline hydrolysis,
enzymatic hydrolysis, alcoholysis, direct solvent extraction,
and supercritical fluid extraction of the total lipid content.
Chromatographic conditions for UV detection
The HPLC method presented here was used in the analysis
of a vitamin standard.
2 4 6 8 10 12 14
mAU
0
100
200
300
400
500
600
700
Vitamin D
α-tocopherol
β-and
Time [min]
Standards
3
δ-tocopherol
γ-tocopherol
Figure 35
Analysis of fat-soluble vitamins with UV detection
Water Methanol
Column
compart-
ment
Auto-
sampler
Quaternary
pump +
vacuum
degasser
Control and
data evaluation
Diode-
array
detector
46
3
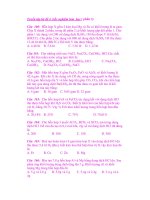
Chromatographic conditions for electrochemical detection
The HPLC method presented here was used in the analysis
of a vitamin standard.
20
-tocopherol
mV
0
246810
Time [min]
Standard
118.5
118.0
117.5
117.0
116.5
Figure 36
Analysis of a fat-soluble vitamin with electrochemical detection
Auto-
sampler
Isocratic
pump +
vacuum
degasser
Control and
data evaluation
Water
Column
compart-
ment
Auto-
sampler
Electro-
chemical
detector
Tocopherols cannot be separated completely using
reversed-phase chromatography. However, normal-phase
chromatography can separate isocratically all eight
tocopherols (T) and tocotrienols (T
3
) naturally occurring in
fats, oils, and other foodstuffs. Fluorescence detection is
recommended for the analysis of total lipid extraction
because UV absorbance detection is not selective enough to
prevent detection of coeluting peaks.
Analysis of tocopherols
on normal-phase
column
Column 125 x 4 mm
Lichrospher RP18, 5 µm
Mobile phase methanol + 5 g/l
lithiumperchlorate +
1 g/l acetic acid
Stop time 20 min
Flow rate 1 ml/min
Oven temperature 30 ºC
Injection volume 1 µl standard
Detector electrochemical
Working electrode: glassy carbon
Operation mode: amperometry
Working potential: 0.9 V
Range: 0.5 µA
Reference
electrode: AgCl/KCl
Response time: 8 s
HPLC method performance
Limit of detection 80 pg (injected amount),
S/N = 2
Repeatability of
RT over 10 runs < 0.5 %
areas over 10 runs < 5 %
Linearity 30 pg to 1 ng
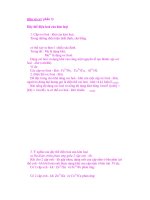
Chromatographic conditions for analysis of
tocopherols on normal-phase column
The HPLC method presented here was used in the analysis
of margarine.
47
Time [min]
1234567
mAU
0
5
10
15
20
FLD
DAD
γ-tocopherol
δ-tocopherol
β-tocopherol
α-tocopherol
Figure 37
Analysis of tocopherols on normal phase using UV and fluorescence
detection
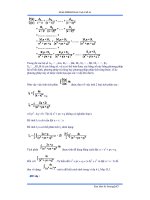
Time [min]
123456
%F
10
30
50
70
90
77.3 %
9.5 %
1.9 %
11.2 %
β-tocopherol
α-tocopherol
γ-tocopherol
δ-tocopherol
Standard
Margarine
Figure 38
Analysis of tocopherol concentration in margarine fat extract with
fluorescence detection
Hexane
Column
compart-
ment
Auto-
sampler
Isocratic
pump +
vacuum
degasser
Control and
data evaluation
Diode-
array
detector
Fluores-
cence
detector
Sample preparation 20 g sample dissolved
in 15 ml hexane
Column 100
x 2.1 mm
Hypersil SI 100, 5 µm
Mobile phase hexane + 2 %
isopropanol
Stop time 8 min
Flow rate 0.3 ml/min
Column compartment 25 ºC
Injection volume 0.5 µl
Detector
UV-DAD 295/80 nm
Fluorescence excitation wavelength
295 nm,
emission wavelength
330 nm
HPLC method performance
Limit of detection 10–20 ng, S/N = 2
for diode-array
Limit of detection 0.5–2 ng S/N = 2
for fluorescence
Repeatability of
RT over 10 runs < 2 %
areas over 10 runs < 2 %
Biogenic amines
The following amines were analyzed: ammonia, amylamine,
1-butylamine, 1,4-diaminobutane, 1,5-diaminopentane,
diethylamine, ethanolamine, ethylamine, hexylamine,
histamine, isobutylamine, isopropylamine, methylamine,
3-methylbutylamine, morpholine, phenethylamine,
propylamine, pyrrolidine, and tryptamine.
Free amines are present in various food products and
beverages, including fish, cheese, wine, and beer.
High concentrations of specific amines can have toxic
properties. As a result, several countries have set maximum
tolerance levels for these compounds in foodstuffs. HPLC is
now preferred for the analysis of amines in food matrices
because of its shorter analysis time and relatively simple
sample preparation.
Sample preparation
Amines can be extracted from different matrixes using
liquid/liquid extraction or solid-phase extraction followed
by derivatization.
48
3
Quaternary
pump +
vacuum
degasser
Control and
data evaluation
Water
Acetonitrile
Column
compart-
ment
Auto-
sampler
Variable
wavelength
detector
Chromatographic conditions for UV detection
The HPLC method presented here was used to analyze
amines in wine.
21
49
1 ethanolamine
2 ammonia
3 methylamine
4ethylamine
5 morpholine
6 i-propylamine
7 propylamine
8 pyrrolidine
9 i-butylamine
10 1-butylamine
11 tryptamine
12 diethylamine
13 phenethylamine
14 3-methylbutylamine
15 amylamine
16 1,4-diaminobutane
17 1,5-diaminopentane
18 hexylamine
19 histamine
20 heptylamine
(internal standard)
20
40
60
2.0e
4
6.0e
4
8.0e
4
4.0e
4
mAU
Time [min]
Standard
1
2
3
4
5
6
7
8
9
10
11
12
13
14
15
16
17
18
19
20
Figure 39
Analysis of amine standard with UV detection after derivatization
21. O. Busto, et al., “Solid phase extraction applied to the determination of
biogenic amines in wines by HPLC”, Chromatographia, 1994, 38(9/10),
571–578.
Sample preparation
25 ml wine was decolored with
polyvinylpyrrolidoine. After filtration, the
amines (5 ml sample, pH = 10.5) were
derivatized with 2 ml dansyl chloride
solution (1 %). The reaction solution was
cleaned with solid-phase extraction using
C18 cartridges (500 mg). After elution
with 2 ml ACN, the solution was
concentrated to 100 µl.
Column 250
x 4.6 mm
Spherisorb ODS2, 5 µm
Mobile phase A = water + 5 % ACN =
75 %
B = ACN (25 %)
Gradient at 5 min 45 % B
at 30 min 45 % B
at 50 min 60 % B
at 55 min 80 % B
at 60 min 80 % B
Stop time 60 min
Post time 4 min
Flow rate 1 ml/min
Column compartment 60 ºC
Detector UV-VWD
250 nm
HPLC method performance
Recovery rate > 85 %
Limit of detection 50–150 µg/l
Method repeatability for
5 red wine analyses < 5 %
Linearity 500 µg/l to 20 mg/l
Amino acids
Both primary and secondary amino acids were analyzed in
one run.
The amino acid composition of proteins can be used to
determine the origin of meat products and thus to detect
adulteration of foodstuffs. Detection of potentially toxic
amino acids is also possible through such analysis. Through
the use of chiral stationary phases as column material, D
and L forms of amino acids can be separated and quanti-
fied.
HPLC in combination with automated online derivatization
is now a well-accepted method for detecting amino acids
owing to its short analysis time and relatively simple sample
preparation.
Sample preparation
Hydrolyzation with HCl or enzymatic hydrolysis is used to
break protein bonds.
Chromatographic conditions
The HPLC method presented here was used in the analysis
of secondary and primary amino acids in beer with
precolumn derivatization and fluorescence detection.
22, 23
50
3
Quaternary
pump +
vacuum
degasser
Control and
data evaluation
Water
Acetonitrile
Column
compart-
ment
Auto-
sampler
Diode-
array
dete
Fluores-
cence
detector
ctor
51
ASP
GLU
GLN
HIS
GLY
ALA
ARG
TYR
VAL
MET
PRO
LEU
ILE
ASN
SER
CIT
PHE
LYS
WL
switch
Time [min]
mAU
70
60
50
40
30
20
10
2
4
6
8
10
12
0
γ−ABA
Figure 40
Analysis of amino acids in beer after online derivatization
22. ”Sensitive and reliable amino acid analysis in protein hydrolysates
using the Agilent 1100 Series”, Agilent Technical Note 5968-5658E, 1999
23. R. Schuster, “Determination of amino acids in biological,
pharmaceutical, plant and food samples by automated precolumn
derivatization and HPLC”, J. Chromatogr., 1988, 431, 271–284.
Sample preparation filtration
Column 200
x 2.1 mm
Hypersil ODS, 5 µm
Mobile phase A = 0.03 M sodium acetate
pH = 7.2 + 0.5% THF
B = 0.1 M sodium acetate/
ACN (1:4)
Gradient
at 0 min 0 % B at 0.45 ml/min flow rate
at 9 min 30 % B
at 11 min 50 % B at 0.8 ml/min flow rate
at 13 min 50 % B
at 14 min 100 % B at 0.45 ml/min flow rate
at 14.1 min at 0.45 ml/min flow rate
at 14.2 min at 0.8 ml/min flow rate
at 17.9 min at 0.8 ml/min flow rate
at 18 .0 min at 0.45ml/min flow rate
at 18 min 100 % B
at 19 min 0 % B
Post time 4 min
Flow rate 0.45 ml/min
Column compartment 40 ºC
Injection volume 1 µl standard
Detector
UV -DAD 338 nm and 266 nm
Fluorescence
Excitation wavelength: 230 nm
Emission wavelength: 450 nm
at 11.5 min
Excitation wavelength: 266 nm
Emission wavelength: 310 nm
Photomultiplier gain: 12
Response time: 4 s
Injector program for online derivatization
1. Draw 3.0 µl from vial 2 (borate buffer)
2. Draw 1.0 µl from vial 0 (OPA reagent)
3. Draw 0.0 µl from vial 100 (water)
4. Draw 1.0 µl from sample
5. Draw 0.0 µl from vial 100 (water)
6. Mix 7.0 µl (6 cycles)
7. Draw 1.0 from vial 1 FMOC reagent
8. Draw 0.0 µl from vial 100 (water)
9. Mix 8.0 µl (3 cycles)
10. Inject
HPLC method performance
Limit of detection DAD < 5 pmol
FLD < 100 fmol
Repeatability of
RT over 6 runs < 1 %
areas over 6 runs < 5 %
Linearity DAD 1 pmol to 4 nmol
Peptides
Peptide mapping of phytochrome from dark grown oat
seedlings using capillary liquid chromatography
The analyzed phytochrome is a photoreceptor protein
that controls light-dependent morphogenesis in plants. For
example, potato clod forms pale long sprouts if it germi-
nates in a dark cellar. However, if this process takes place
in the light, a normal plant with green leaves grows and
photosynthesis occurs. Phytochrome proteins are present
in very low concentrations in potato clod, and sample
volume and concentration of these proteins is rather low
following sample preparation. In this case, columns or
capillaries with a small internal diameter are preferred
because sensitivity increases with decreasing internal
diameter of the column. The use of capillaries with an
internal diameter of 100–300 µm enables flow rates as low
as 0.5–4.0 µl/min, which reduces solvent consumption.
Such flow rates are well-suited to liquid chromatography-
mass spectroscopy (LC/MS) electrospray ionization.
In our experience, the appropriate conversion of standard
HPLC equipment to a capillary HPLC system is cost-effective
and yields the highest performance for running capillary
columns. For conversion, a flow stream-split device, a
35-nL capillary flow cell for the detector, and capillary con-
nections between system modules are required. System
delay volume should be as low as possible. To meet the
demands of such a system, the Agilent 1100 Series binary
pump, which has inherently low delay volume, was selected
as a pumping system. The flow splitter, the capillary flow
cell for the detector, and the column were purchased from
LC Packings in Amsterdam.
24
With this design, a standard flow rate (for example, 100 or
50 µl/min) can be set for the pump. This flow then can be
reduced by calibrated splitters between 0.5 and 4 µl/min, for
example. This flow rate is optimal for capillary columns
with an internal diameter of 300 µm.
52
3
Chromatographic conditions
Capillary HPLC with UV and MS detection has been used in
the analysis of phytochrome protein from dark grown oat
seedlings. Figures 41, 42 and 43 show the UV and total ion
chromatogram together with two mass spectra of selected
fragments. The Agilent 1100 Series LC system was used
without mixer. All tubings were as short as possible, with an
internal diameter of 75–120 µm id.
Sample preparation
The extracted protein was reduced and alkylated prior to
digestion with trypsin.
53
Time [min]
40 60 80 100
mAU
20
40
60
80
100
120
Figure 41
Capillary LC-MS of a phytochrome tryptic digest (17.5 pmol)—UV trace
Flow
split
device
Control and
data evaluation
Water
iAcetonitr le
Column
compart-
ment
Auto-
sampler
Mass
spectrome-
ter or VWD
detector
Binary
pump +
vacuum
degasser
Sample tryptic digest of
phytochrome from oat
seedlings, 7 pmol/µl
Capillary column 300 µm
x 25 cm, C18
Mobile phase A = 0.025 % TFA in water
B = 0.02 % TFA in ACN
Gradient 0.35 % B/min
Flow rate 100 µl/min split to
4 µl/min
Column compartment 25 ºC
Injection volume 2.5 µl
Detector UV-VWD
wavelength 206 nm with
a 35-nl, 8-mm flow cell
HPLC method performance
Limit of detection 1 pmol
Repeatability of
RT over 10 runs < 0.7 %
areas over 6 runs < 1 %
MS data was used for further evaluation. Some of the tryptic
mass fragments of the phytochrome are signed. As an
example, figure 42 shows two mass spectra.
54
3
Time [min]
20000
40000
60000
80000
100000
120000
140000
160000
Abundance
40
50
60
70 80
90
100
110
T46
T92
T15
T12
T14
T58
T60-61
T8
T42
Figure 42
Capillary LC-MS of a phytochrome tryptic digest (17.5 pmol)—total ion
chromatography (TIC)
Abundance
450 550 650 750 850 m/z
0
2000
4000
6000
8000
10000
415.4
829.7
T12 (MW = 828.5)
1000
2000
3000
4000
5000
6000
796.6
1194.7
700 900 1100 1300500 m/z
T58 (MW = 2387.2)
Time [min]
Time [min]
Abundance
Figure 43
Mass spectra of T12 and T58
24. “Capillary Liquid Chromatography with the Agilent 1100 Series Modules
and Systems for HPLC”, Agilent Technical Note 5965-1351E , 1996.
Voltages Vcyl -5500, Vend -3500,
Vcap -4000, CapEx 150
Scan 400–1800 m/z
Threshold 150
Sampling 1
Stepsize 0.15 amu
Drying gas nitrogen, 150 °C
Nebulizer gas nitrogen, < 20 psi
The Agilent 5989B MS engine was equipped
with an Iris™ Hexapole Ion Guide
55
The
Equipment
Basics
An overview of the
hardware and the software
components needed
for successful HPLC,
and an introduction to
the analytical techniques
that have become
routine in food analysis
Part Two
Chapter 4
Separation in
the liquid phase
Separation
mechanisms
Reversed-phase materials
Ion-exchange materials
Liquid chromatography offers a wide variety of
separation modes and mobile phases for optimizing
your separation system.
Stationary phases can be classified according to the
mechanism by which they separate molecules:
• partition phases
• adsorption phases
• ion-exchange phases
• size-exclusion phases
Nowadays the most popular column material is reversed
phase, in which separation is achieved through partition
and through adsorption by unprotected silanol groups. In
reversed-phase chromatography, the stationary phase is
nonpolar (or less polar than in the mobile phase) and the
analytes are retained until eluted with a sufficiently polar
solvent or solvent mixture (in the case of a mobile-phase
gradient).
Reversed-phase materials have wide application and a long
lifetime. Moreover, these media have good batch-to-batch
reproducibility, low equilibration times, high mechanical
stability, and predictable elution times and elution order.
Reversed-phase chromatography is frequently used in food
analysis, as shown in part one of this primer.
Compared with reversed-phase media, ion-exchange
materials have a shorter lifetime, are less mechanically
stable, and take longer to equilibrate. These columns have
limited application in food analysis and are used primarily
for inorganic cations and anions or for glyphosate.
58
4