Engineering Statistics Handbook Episode 8 Part 11 pptx
Bạn đang xem bản rút gọn của tài liệu. Xem và tải ngay bản đầy đủ của tài liệu tại đây (51.82 KB, 18 trang )
6. Process or Product Monitoring and Control
6.4. Introduction to Time Series Analysis
6.4.4. Univariate Time Series Models
6.4.4.1. Sample Data Sets
6.4.4.1.1.Data Set of Monthly CO2
Concentrations
Source and
Background
This data set contains selected monthly mean CO2 concentrations at the
Mauna Loa Observatory from 1974 to 1987. The CO2 concentrations were
measured by the continuous infrared analyser of the Geophysical
Monitoring for Climatic Change division of NOAA's Air Resources
Laboratory. The selection has been for an approximation of 'background
conditions'. See Thoning et al., "Atmospheric Carbon Dioxide at Mauna
Loa Observatory: II Analysis of the NOAA/GMCC Data 1974-1985",
Journal of Geophysical Research (submitted) for details.
This dataset was received from Jim Elkins of NOAA in 1988.
Data
Each line contains the CO2 concentration (mixing ratio in dry air,
expressed in the WMO X85 mole fraction scale, maintained by the Scripps
Institution of Oceanography). In addition, it contains the year, month, and
a numeric value for the combined month and year. This combined date is
useful for plotting purposes.
CO2 Year&Month Year Month
333.13 1974.38 1974 5
332.09 1974.46 1974 6
331.10 1974.54 1974 7
329.14 1974.63 1974 8
327.36 1974.71 1974 9
327.29 1974.79 1974 10
328.23 1974.88 1974 11
329.55 1974.96 1974 12
330.62 1975.04 1975 1
331.40 1975.13 1975 2
331.87 1975.21 1975 3
6.4.4.1.1. Data Set of Monthly CO2 Concentrations
(1 of 5) [5/1/2006 10:35:18 AM]
333.18 1975.29 1975 4
333.92 1975.38 1975 5
333.43 1975.46 1975 6
331.85 1975.54 1975 7
330.01 1975.63 1975 8
328.51 1975.71 1975 9
328.41 1975.79 1975 10
329.25 1975.88 1975 11
330.97 1975.96 1975 12
331.60 1976.04 1976 1
332.60 1976.13 1976 2
333.57 1976.21 1976 3
334.72 1976.29 1976 4
334.68 1976.38 1976 5
334.17 1976.46 1976 6
332.96 1976.54 1976 7
330.80 1976.63 1976 8
328.98 1976.71 1976 9
328.57 1976.79 1976 10
330.20 1976.88 1976 11
331.58 1976.96 1976 12
332.67 1977.04 1977 1
333.17 1977.13 1977 2
334.86 1977.21 1977 3
336.07 1977.29 1977 4
336.82 1977.38 1977 5
336.12 1977.46 1977 6
334.81 1977.54 1977 7
332.56 1977.63 1977 8
331.30 1977.71 1977 9
331.22 1977.79 1977 10
332.37 1977.88 1977 11
333.49 1977.96 1977 12
334.71 1978.04 1978 1
335.23 1978.13 1978 2
336.54 1978.21 1978 3
337.79 1978.29 1978 4
337.95 1978.38 1978 5
338.00 1978.46 1978 6
336.37 1978.54 1978 7
334.47 1978.63 1978 8
332.46 1978.71 1978 9
332.29 1978.79 1978 10
6.4.4.1.1. Data Set of Monthly CO2 Concentrations
(2 of 5) [5/1/2006 10:35:18 AM]
333.76 1978.88 1978 11
334.80 1978.96 1978 12
336.00 1979.04 1979 1
336.63 1979.13 1979 2
337.93 1979.21 1979 3
338.95 1979.29 1979 4
339.05 1979.38 1979 5
339.27 1979.46 1979 6
337.64 1979.54 1979 7
335.68 1979.63 1979 8
333.77 1979.71 1979 9
334.09 1979.79 1979 10
335.29 1979.88 1979 11
336.76 1979.96 1979 12
337.77 1980.04 1980 1
338.26 1980.13 1980 2
340.10 1980.21 1980 3
340.88 1980.29 1980 4
341.47 1980.38 1980 5
341.31 1980.46 1980 6
339.41 1980.54 1980 7
337.74 1980.63 1980 8
336.07 1980.71 1980 9
336.07 1980.79 1980 10
337.22 1980.88 1980 11
338.38 1980.96 1980 12
339.32 1981.04 1981 1
340.41 1981.13 1981 2
341.69 1981.21 1981 3
342.51 1981.29 1981 4
343.02 1981.38 1981 5
342.54 1981.46 1981 6
340.88 1981.54 1981 7
338.75 1981.63 1981 8
337.05 1981.71 1981 9
337.13 1981.79 1981 10
338.45 1981.88 1981 11
339.85 1981.96 1981 12
340.90 1982.04 1982 1
341.70 1982.13 1982 2
342.70 1982.21 1982 3
343.65 1982.29 1982 4
6.4.4.1.1. Data Set of Monthly CO2 Concentrations
(3 of 5) [5/1/2006 10:35:18 AM]
344.28 1982.38 1982 5
343.42 1982.46 1982 6
342.02 1982.54 1982 7
339.97 1982.63 1982 8
337.84 1982.71 1982 9
338.00 1982.79 1982 10
339.20 1982.88 1982 11
340.63 1982.96 1982 12
341.41 1983.04 1983 1
342.68 1983.13 1983 2
343.04 1983.21 1983 3
345.27 1983.29 1983 4
345.92 1983.38 1983 5
345.40 1983.46 1983 6
344.16 1983.54 1983 7
342.11 1983.63 1983 8
340.11 1983.71 1983 9
340.15 1983.79 1983 10
341.38 1983.88 1983 11
343.02 1983.96 1983 12
343.87 1984.04 1984 1
344.59 1984.13 1984 2
345.11 1984.21 1984 3
347.07 1984.29 1984 4
347.38 1984.38 1984 5
346.78 1984.46 1984 6
344.96 1984.54 1984 7
342.71 1984.63 1984 8
340.86 1984.71 1984 9
341.13 1984.79 1984 10
342.84 1984.88 1984 11
344.32 1984.96 1984 12
344.88 1985.04 1985 1
345.62 1985.13 1985 2
347.23 1985.21 1985 3
347.62 1985.29 1985 4
348.53 1985.38 1985 5
347.87 1985.46 1985 6
346.00 1985.54 1985 7
343.86 1985.63 1985 8
342.55 1985.71 1985 9
342.57 1985.79 1985 10
344.11 1985.88 1985 11
6.4.4.1.1. Data Set of Monthly CO2 Concentrations
(4 of 5) [5/1/2006 10:35:18 AM]
345.49 1985.96 1985 12
346.04 1986.04 1986 1
346.70 1986.13 1986 2
347.38 1986.21 1986 3
349.38 1986.29 1986 4
349.93 1986.38 1986 5
349.26 1986.46 1986 6
347.44 1986.54 1986 7
345.55 1986.63 1986 8
344.21 1986.71 1986 9
343.67 1986.79 1986 10
345.09 1986.88 1986 11
346.27 1986.96 1986 12
347.33 1987.04 1987 1
347.82 1987.13 1987 2
349.29 1987.21 1987 3
350.91 1987.29 1987 4
351.71 1987.38 1987 5
350.94 1987.46 1987 6
349.10 1987.54 1987 7
346.77 1987.63 1987 8
345.73 1987.71 1987 9
6.4.4.1.1. Data Set of Monthly CO2 Concentrations
(5 of 5) [5/1/2006 10:35:18 AM]
1.1 1956.54 1956 7
1.0 1956.63 1956 8
0.0 1956.71 1956 9
1.9 1956.79 1956 10
0.1 1956.88 1956 11
0.9 1956.96 1956 12
0.4 1957.04 1957 1
-0.4 1957.13 1957 2
-0.4 1957.21 1957 3
0.0 1957.29 1957 4
-1.1 1957.38 1957 5
-0.4 1957.46 1957 6
0.1 1957.54 1957 7
-1.1 1957.63 1957 8
-1.0 1957.71 1957 9
-0.1 1957.79 1957 10
-1.2 1957.88 1957 11
-0.5 1957.96 1957 12
-1.9 1958.04 1958 1
-0.7 1958.13 1958 2
-0.3 1958.21 1958 3
0.1 1958.29 1958 4
-1.3 1958.38 1958 5
-0.3 1958.46 1958 6
0.3 1958.54 1958 7
0.7 1958.63 1958 8
-0.4 1958.71 1958 9
-0.4 1958.79 1958 10
-0.6 1958.88 1958 11
-0.8 1958.96 1958 12
-0.9 1959.04 1959 1
-1.5 1959.13 1959 2
0.8 1959.21 1959 3
0.2 1959.29 1959 4
0.2 1959.38 1959 5
-0.9 1959.46 1959 6
-0.5 1959.54 1959 7
-0.6 1959.63 1959 8
0.0 1959.71 1959 9
0.3 1959.79 1959 10
0.9 1959.88 1959 11
0.8 1959.96 1959 12
6.4.4.1.2. Data Set of Southern Oscillations
(2 of 12) [5/1/2006 10:35:19 AM]
0.0 1960.04 1960 1
-0.2 1960.13 1960 2
0.5 1960.21 1960 3
0.9 1960.29 1960 4
0.2 1960.38 1960 5
-0.5 1960.46 1960 6
0.4 1960.54 1960 7
0.5 1960.63 1960 8
0.7 1960.71 1960 9
-0.1 1960.79 1960 10
0.6 1960.88 1960 11
0.7 1960.96 1960 12
-0.4 1961.04 1961 1
0.5 1961.13 1961 2
-2.6 1961.21 1961 3
1.1 1961.29 1961 4
0.2 1961.38 1961 5
-0.4 1961.46 1961 6
0.1 1961.54 1961 7
-0.3 1961.63 1961 8
0.0 1961.71 1961 9
-0.8 1961.79 1961 10
0.7 1961.88 1961 11
1.4 1961.96 1961 12
1.7 1962.04 1962 1
-0.5 1962.13 1962 2
-0.4 1962.21 1962 3
0.0 1962.29 1962 4
1.2 1962.38 1962 5
0.5 1962.46 1962 6
-0.1 1962.54 1962 7
0.3 1962.63 1962 8
0.5 1962.71 1962 9
0.9 1962.79 1962 10
0.2 1962.88 1962 11
0.0 1962.96 1962 12
0.8 1963.04 1963 1
0.3 1963.13 1963 2
0.6 1963.21 1963 3
0.9 1963.29 1963 4
0.0 1963.38 1963 5
-1.5 1963.46 1963 6
-0.3 1963.54 1963 7
6.4.4.1.2. Data Set of Southern Oscillations
(3 of 12) [5/1/2006 10:35:19 AM]
-0.4 1963.63 1963 8
-0.7 1963.71 1963 9
-1.6 1963.79 1963 10
-1.0 1963.88 1963 11
-1.4 1963.96 1963 12
-0.5 1964.04 1964 1
-0.2 1964.13 1964 2
0.6 1964.21 1964 3
1.7 1964.29 1964 4
-0.2 1964.38 1964 5
0.7 1964.46 1964 6
0.5 1964.54 1964 7
1.4 1964.63 1964 8
1.3 1964.71 1964 9
1.3 1964.79 1964 10
0.0 1964.88 1964 11
-0.5 1964.96 1964 12
-0.5 1965.04 1965 1
0.0 1965.13 1965 2
0.2 1965.21 1965 3
-1.1 1965.29 1965 4
0.0 1965.38 1965 5
-1.5 1965.46 1965 6
-2.3 1965.54 1965 7
-1.3 1965.63 1965 8
-1.4 1965.71 1965 9
-1.2 1965.79 1965 10
-1.8 1965.88 1965 11
0.0 1965.96 1965 12
-1.4 1966.04 1966 1
-0.5 1966.13 1966 2
-1.6 1966.21 1966 3
-0.7 1966.29 1966 4
-0.6 1966.38 1966 5
0.0 1966.46 1966 6
-0.1 1966.54 1966 7
0.3 1966.63 1966 8
-0.3 1966.71 1966 9
-0.3 1966.79 1966 10
-0.1 1966.88 1966 11
-0.5 1966.96 1966 12
1.5 1967.04 1967 1
6.4.4.1.2. Data Set of Southern Oscillations
(4 of 12) [5/1/2006 10:35:19 AM]
1.2 1967.13 1967 2
0.8 1967.21 1967 3
-0.2 1967.29 1967 4
-0.4 1967.38 1967 5
0.6 1967.46 1967 6
0.0 1967.54 1967 7
0.4 1967.63 1967 8
0.5 1967.71 1967 9
-0.2 1967.79 1967 10
-0.7 1967.88 1967 11
-0.7 1967.96 1967 12
0.5 1968.04 1968 1
0.8 1968.13 1968 2
-0.5 1968.21 1968 3
-0.3 1968.29 1968 4
1.2 1968.38 1968 5
1.4 1968.46 1968 6
0.6 1968.54 1968 7
-0.1 1968.63 1968 8
-0.3 1968.71 1968 9
-0.3 1968.79 1968 10
-0.4 1968.88 1968 11
0.0 1968.96 1968 12
-1.4 1969.04 1969 1
0.8 1969.13 1969 2
-0.1 1969.21 1969 3
-0.8 1969.29 1969 4
-0.8 1969.38 1969 5
-0.2 1969.46 1969 6
-0.7 1969.54 1969 7
-0.6 1969.63 1969 8
-1.0 1969.71 1969 9
-1.4 1969.79 1969 10
-0.1 1969.88 1969 11
0.3 1969.96 1969 12
-1.2 1970.04 1970 1
-1.2 1970.13 1970 2
0.0 1970.21 1970 3
-0.5 1970.29 1970 4
0.1 1970.38 1970 5
1.1 1970.46 1970 6
-0.6 1970.54 1970 7
0.3 1970.63 1970 8
6.4.4.1.2. Data Set of Southern Oscillations
(5 of 12) [5/1/2006 10:35:19 AM]
1.2 1970.71 1970 9
0.8 1970.79 1970 10
1.8 1970.88 1970 11
1.8 1970.96 1970 12
0.2 1971.04 1971 1
1.4 1971.13 1971 2
2.0 1971.21 1971 3
2.6 1971.29 1971 4
0.9 1971.38 1971 5
0.2 1971.46 1971 6
0.1 1971.54 1971 7
1.4 1971.63 1971 8
1.5 1971.71 1971 9
1.8 1971.79 1971 10
0.5 1971.88 1971 11
0.1 1971.96 1971 12
0.3 1972.04 1972 1
0.6 1972.13 1972 2
0.1 1972.21 1972 3
-0.5 1972.29 1972 4
-2.1 1972.38 1972 5
-1.7 1972.46 1972 6
-1.9 1972.54 1972 7
-1.1 1972.63 1972 8
-1.5 1972.71 1972 9
-1.1 1972.79 1972 10
-0.4 1972.88 1972 11
-1.5 1972.96 1972 12
-0.4 1973.04 1973 1
-1.5 1973.13 1973 2
0.2 1973.21 1973 3
-0.4 1973.29 1973 4
0.3 1973.38 1973 5
1.2 1973.46 1973 6
0.5 1973.54 1973 7
1.2 1973.63 1973 8
1.3 1973.71 1973 9
0.6 1973.79 1973 10
2.9 1973.88 1973 11
1.7 1973.96 1973 12
2.2 1974.04 1974 1
1.5 1974.13 1974 2
6.4.4.1.2. Data Set of Southern Oscillations
(6 of 12) [5/1/2006 10:35:19 AM]
2.1 1974.21 1974 3
1.3 1974.29 1974 4
1.3 1974.38 1974 5
0.1 1974.46 1974 6
1.2 1974.54 1974 7
0.5 1974.63 1974 8
1.1 1974.71 1974 9
0.8 1974.79 1974 10
-0.4 1974.88 1974 11
0.0 1974.96 1974 12
-0.6 1975.04 1975 1
0.4 1975.13 1975 2
1.1 1975.21 1975 3
1.5 1975.29 1975 4
0.5 1975.38 1975 5
1.7 1975.46 1975 6
2.1 1975.54 1975 7
2.0 1975.63 1975 8
2.2 1975.71 1975 9
1.7 1975.79 1975 10
1.3 1975.88 1975 11
2.0 1975.96 1975 12
1.2 1976.04 1976 1
1.2 1976.13 1976 2
1.3 1976.21 1976 3
0.2 1976.29 1976 4
0.6 1976.38 1976 5
-0.1 1976.46 1976 6
-1.2 1976.54 1976 7
-1.5 1976.63 1976 8
-1.2 1976.71 1976 9
0.2 1976.79 1976 10
0.7 1976.88 1976 11
-0.5 1976.96 1976 12
-0.5 1977.04 1977 1
0.8 1977.13 1977 2
-1.2 1977.21 1977 3
-1.3 1977.29 1977 4
-1.1 1977.38 1977 5
-2.3 1977.46 1977 6
-1.5 1977.54 1977 7
-1.4 1977.63 1977 8
-0.9 1977.71 1977 9
6.4.4.1.2. Data Set of Southern Oscillations
(7 of 12) [5/1/2006 10:35:19 AM]
-1.4 1977.79 1977 10
-1.6 1977.88 1977 11
-1.3 1977.96 1977 12
-0.5 1978.04 1978 1
-2.6 1978.13 1978 2
-0.8 1978.21 1978 3
-0.9 1978.29 1978 4
1.3 1978.38 1978 5
0.4 1978.46 1978 6
0.4 1978.54 1978 7
0.1 1978.63 1978 8
0.0 1978.71 1978 9
-0.8 1978.79 1978 10
-0.1 1978.88 1978 11
-0.2 1978.96 1978 12
-0.5 1979.04 1979 1
0.6 1979.13 1979 2
-0.5 1979.21 1979 3
-0.7 1979.29 1979 4
0.5 1979.38 1979 5
0.6 1979.46 1979 6
1.3 1979.54 1979 7
-0.7 1979.63 1979 8
0.1 1979.71 1979 9
-0.4 1979.79 1979 10
-0.6 1979.88 1979 11
-0.9 1979.96 1979 12
0.3 1980.04 1980 1
0.0 1980.13 1980 2
-1.1 1980.21 1980 3
-1.7 1980.29 1980 4
-0.3 1980.38 1980 5
-0.7 1980.46 1980 6
-0.2 1980.54 1980 7
-0.1 1980.63 1980 8
-0.5 1980.71 1980 9
-0.3 1980.79 1980 10
-0.5 1980.88 1980 11
-0.2 1980.96 1980 12
0.3 1981.04 1981 1
-0.5 1981.13 1981 2
-2.0 1981.21 1981 3
6.4.4.1.2. Data Set of Southern Oscillations
(8 of 12) [5/1/2006 10:35:19 AM]
-0.6 1981.29 1981 4
0.8 1981.38 1981 5
1.6 1981.46 1981 6
0.8 1981.54 1981 7
0.4 1981.63 1981 8
0.3 1981.71 1981 9
-0.7 1981.79 1981 10
0.1 1981.88 1981 11
0.4 1981.96 1981 12
1.0 1982.04 1982 1
0.0 1982.13 1982 2
0.0 1982.21 1982 3
-0.1 1982.29 1982 4
-0.6 1982.38 1982 5
-2.5 1982.46 1982 6
-2.0 1982.54 1982 7
-2.7 1982.63 1982 8
-1.9 1982.71 1982 9
-2.2 1982.79 1982 10
-3.2 1982.88 1982 11
-2.5 1982.96 1982 12
-3.4 1983.04 1983 1
-3.5 1983.13 1983 2
-3.2 1983.21 1983 3
-2.1 1983.29 1983 4
0.9 1983.38 1983 5
-0.5 1983.46 1983 6
-0.9 1983.54 1983 7
-0.4 1983.63 1983 8
0.9 1983.71 1983 9
0.3 1983.79 1983 10
-0.1 1983.88 1983 11
-0.1 1983.96 1983 12
0.0 1984.04 1984 1
0.4 1984.13 1984 2
-0.8 1984.21 1984 3
0.4 1984.29 1984 4
0.0 1984.38 1984 5
-1.2 1984.46 1984 6
0.0 1984.54 1984 7
0.1 1984.63 1984 8
0.1 1984.71 1984 9
-0.6 1984.79 1984 10
6.4.4.1.2. Data Set of Southern Oscillations
(9 of 12) [5/1/2006 10:35:19 AM]
0.3 1984.88 1984 11
-0.3 1984.96 1984 12
-0.5 1985.04 1985 1
0.8 1985.13 1985 2
0.2 1985.21 1985 3
1.4 1985.29 1985 4
-0.2 1985.38 1985 5
-1.4 1985.46 1985 6
-0.3 1985.54 1985 7
0.7 1985.63 1985 8
0.0 1985.71 1985 9
-0.8 1985.79 1985 10
-0.4 1985.88 1985 11
0.1 1985.96 1985 12
0.8 1986.04 1986 1
-1.2 1986.13 1986 2
-0.1 1986.21 1986 3
0.1 1986.29 1986 4
-0.6 1986.38 1986 5
1.0 1986.46 1986 6
0.1 1986.54 1986 7
-0.9 1986.63 1986 8
-0.5 1986.71 1986 9
0.6 1986.79 1986 10
-1.6 1986.88 1986 11
-1.6 1986.96 1986 12
-0.7 1987.04 1987 1
-1.4 1987.13 1987 2
-2.0 1987.21 1987 3
-2.7 1987.29 1987 4
-2.0 1987.38 1987 5
-2.7 1987.46 1987 6
-1.8 1987.54 1987 7
-1.7 1987.63 1987 8
-1.1 1987.71 1987 9
-0.7 1987.79 1987 10
-0.1 1987.88 1987 11
-0.6 1987.96 1987 12
-0.3 1988.04 1988 1
-0.6 1988.13 1988 2
0.1 1988.21 1988 3
0.0 1988.29 1988 4
6.4.4.1.2. Data Set of Southern Oscillations
(10 of 12) [5/1/2006 10:35:19 AM]
1.1 1988.38 1988 5
-0.3 1988.46 1988 6
1.1 1988.54 1988 7
1.4 1988.63 1988 8
1.9 1988.71 1988 9
1.5 1988.79 1988 10
1.9 1988.88 1988 11
1.1 1988.96 1988 12
1.5 1989.04 1989 1
1.1 1989.13 1989 2
0.6 1989.21 1989 3
1.6 1989.29 1989 4
1.2 1989.38 1989 5
0.5 1989.46 1989 6
0.8 1989.54 1989 7
-0.8 1989.63 1989 8
0.6 1989.71 1989 9
0.6 1989.79 1989 10
-0.4 1989.88 1989 11
-0.7 1989.96 1989 12
-0.2 1990.04 1990 1
-2.4 1990.13 1990 2
-1.2 1990.21 1990 3
0.0 1990.29 1990 4
1.1 1990.38 1990 5
0.0 1990.46 1990 6
0.5 1990.54 1990 7
-0.5 1990.63 1990 8
-0.8 1990.71 1990 9
0.1 1990.79 1990 10
-0.7 1990.88 1990 11
-0.4 1990.96 1990 12
0.6 1991.04 1991 1
-0.1 1991.13 1991 2
-1.4 1991.21 1991 3
-1.0 1991.29 1991 4
-1.5 1991.38 1991 5
-0.5 1991.46 1991 6
-0.2 1991.54 1991 7
-0.9 1991.63 1991 8
-1.8 1991.71 1991 9
-1.5 1991.79 1991 10
-0.8 1991.88 1991 11
6.4.4.1.2. Data Set of Southern Oscillations
(11 of 12) [5/1/2006 10:35:19 AM]
-2.3 1991.96 1991 12
-3.4 1992.04 1992 1
-1.4 1992.13 1992 2
-3.0 1992.21 1992 3
-1.4 1992.29 1992 4
0.0 1992.38 1992 5
-1.2 1992.46 1992 6
-0.8 1992.54 1992 7
0.0 1992.63 1992 8
0.0 1992.71 1992 9
-1.9 1992.79 1992 10
-0.9 1992.88 1992 11
-1.1 1992.96 1992 12
6.4.4.1.2. Data Set of Southern Oscillations
(12 of 12) [5/1/2006 10:35:19 AM]
location and scale. Although seasonality also violates stationarity,
this is usually explicitly incorporated into the time series model.
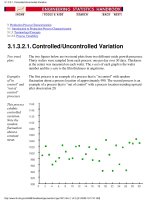
Example
The following plots are from a data set of monthly CO2
concentrations.
Run Sequence
Plot
The initial run sequence plot of the data indicates a rising trend. A
visual inspection of this plot indicates that a simple linear fit should
be sufficient to remove this upward trend.
This plot also shows periodical behavior. This is discussed in the
next section.
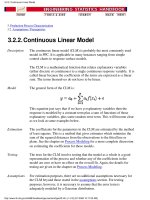
Linear Trend
Removed
6.4.4.2. Stationarity
(2 of 3) [5/1/2006 10:35:19 AM]
This plot contains the residuals from a linear fit to the original data.
After removing the linear trend, the run sequence plot indicates that
the data have a constant location and variance, although the pattern
of the residuals shows that the data depart from the model in a
systematic way.
6.4.4.2. Stationarity
(3 of 3) [5/1/2006 10:35:19 AM]