Seventy Years of Exploration in Oceanography Part 4 pdf
Bạn đang xem bản rút gọn của tài liệu. Xem và tải ngay bản đầy đủ của tài liệu tại đây (382.43 KB, 17 trang )
Chapter 3
Bikini (1946) and Eniwetok (1951)
Hasselmann: Your clearance paved the way for your participation in the American
Atomic Bomb Tests?
Munk: Yes, the 20-kiloton fission bombs in Bikini in 1946, and the 17-megaton fu-
sion bomb in 1951 (called Ivy Mike). Let me talk about Bikini first. William Van
Arx of Woods Hole and I were tasked to estimate the rate at which radioactive
contamination would be flushed from Bikini Lagoon [13]. When viewed on Pacific
maps, the lagoon appeared as an insignificant speck, but it was not so small when
we got there. We were given 10 days to do our job. We requisitioned a Navy recon-
naissance plane and rigged up a simple bombsite. Van Arx was navigator and I was
bombardier. We dropped dye markers filled with a highly concentrated mixture of
green hexafluoride (used to locate downed fliers) into the lagoon openings, and the
colored spots were photographed over the subsequent half tidal cycle. These spots
gave a rough idea of the in and outflow. There are about ten lagoon openings, and
by the end of the week we had monitored nine, each showing a net inflow! The tenth
(and last) channel came to our rescue, with a large net outflow. (The night before
we had despaired as to how to report a violation to the principle of mass conser-
vation.) In spite of great care, some tiny volume of the green dye would rub into
my trousers. Our bunks were on USS (United States Ship) Allen M. Sumner (DD-
692). After a few days, I noticed that the uniforms of the hundred or so officers and
crew had taken on a greenish tinge. On the last day, Captain Ciano invited Van Arx
and me to his quarters for hearts-of palm hors d’oeuvres. He received us in (not so
perfect) dress-whites with the words, “I don’t know what’s wrong with the ship’s
laundry ”
Bikini was also the site of the perfect oceanographic experiment. The problem was
to measure the maximum h eight of the waves caused by the underwater explosion
(Bikini Baker). One member of our team, Jeff Holter, purchased a case of beer,
emptied the contents, and then nailed the empty beer cans on a nearby palm tree.
Following the test, the lower cans were found filled with lagoon water, the upper
ones were empty, with the boundary constituting a reliable estimate of the highest
run up.
H. von Storch, K. Hasselmann, Seventy Year s of Exploration in Oceanography 25
DOI 10.1007/978-3-642-12087-9, © Springer 2010
26 3 Bikini (1946) and Eniwetok (1951)
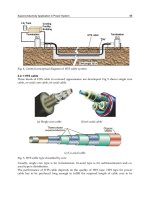
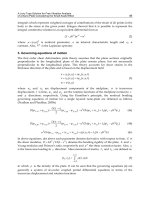
Fig. 3.1 (a) Early days of scuba diving during Operation Capricorn (1952–1953); (b) Walter ob-
serving a giant coral using the newly invented Aqualung
I revisited Bikini Lagoon five years later, on the way to Eniwetok to monitor the H-
bomb explosion, three orders more powerful than the Bikini tests [247]. Scuba div-
ing has just been invented, and we were learning how to use the new gear (Fig. 3.1).
I dove to the bottom of the lagoon, 180 feet (my deepest dive) and looked at the
eerie silhouettes of the battleships that had been sunk during the Bikini tests. Not
much had changed in five years, and the Bikini natives who had b een evacuated on
a moments notice had not been allowed to return. We established a bottom pres-
sure recorder to monitor the forthcoming explosion at Eniwetok 250 n. miles to the
west.
1
von Storch: Why would you want to install a wave recorder so far from the explosion
site?
Munk: Roger Revelle, John Isaacs, and I had become concerned that the H-bomb
would trigger a tsunami with distant outreach, and we browbeat the Atomic Energy
Commission in preparing for such an event. Looking at fathograms of the steep Eni-
wetok Seamount shows evidence of previous underwater landslides. This is a region
of very low earthquake activity, and we were concerned that the shock of a mag-
nitude 7 earthquake (the thermo-nuclear explosion) would trigger an underwater
landslide. Such landslides are good generators of tsunamis.
1
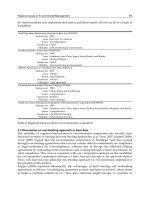
Willard Bascom had been diagnosed with terminal cancer. He was a passionate underwater pho-
tographer and had made it very clear that he did not want his photos of marine life spoiled by the
presence of ugly fellow oceanographers. Walter was standing on the lagoon bottom with a tsunami
pressure gauge raised above his head (recording a Laplace transform of instrument response) when
he noticed Bascom taking a most unusual photographic interest in the calibration. When Walter
finally turned around, he found himself a few feet from the object of Bascom’ s intense i nterest
(Fig. 3.2). The calibration was an incomplete Laplace transform.
3 Bikini (1946) and Eniwetok (1951) 27
Fig. 3.2 Willard Bascom took this picture in 1952 in Bikini Lagoon when Walter was about to be
devoured by a shark
Plans were made for evacuating low areas on islands within some hundreds of miles
of the zero-point at Eluklab Island. The evacuation order was to be triggered by the
actual detection of a tsunami signal. Offshore depths are typically 18,000 feet, but
there was an available seamount reaching to within 4,500 feet of the surface. Willard
Bascom of Scripps established two moorings, with a taut piano wire leading from
the anchor on top of the seamount to a buoyant raft at the surface. A differential
pressure gage with peak response at tsunami frequencies was clamped to the piano
wire 130 feet beneath the surface raft. The recording was on a primitive Esterline-
Angus pen and ink paper tape. Passage of the tsunami wave crest would give an
increased pressure signal. For anchor, Bascom had clamped together some old San
Diego trolley car wheels (the first example of what was to become standard practice
for the resting places of used railroad wheels).
Bascom and I tended identical moorings on the seamount, standing on 33 foot rafts
and anxiously observing the paper tape recording (Fig. 3.3). We were separated by
two miles with the Scripps vessel RV (Research Vessel) Horizon between and within
sight. We had arranged four semaphore flag signals:
ABLE ABLE ABLE Destructive tsunami Pacific Ocean
BAKER BAKER BAKER Destructive tsunami Marshall Islands
CHARLIE CHARLIE CHARLIE minor tsunami
DOG DOG DOG No tsunami
The Horizon was in open contact with the flagship USS Estes that in turn had open
communication links to the island evacuation sites. Time zero had been set for 1952
November 1 0715.000 hours Eniwetok local time. It was before dawn, cold and wet.
I put on my high-density goggles. An instant heat blast signaled the explosion. At
0721 a 5-millibar air shock arrived, followed by angry rumbling. After that, nothing.
28 3 Bikini (1946) and Eniwetok (1951)
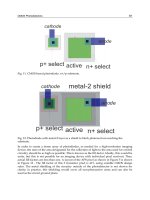
Fig. 3.3 Willard Bascom (above) and Walter observed the hydrogen bomb test, Ivy Mike, at Eni-
wetok Atoll from a 3 3 foot raft , recording bottom pressure for a possible tsunami. Four truck
inner tubes were used for floatation of the plywood raft, which was anchored to the 4500 foot
deep seamount by San Diego trolley car wheels. (Willard Bascom on raft, John Isaacs and Monk
Hendrix in the rowboat)
Fig. 3.4 Crossing the equator aboard the RV Horizon, Operation Capricorn (1953). The lettering
on the researchers’ chests reads RV HORIZON SIO LA JOLLA CAL UCLA. (Walter is seated on
the front left)
3 Bikini (1946) and Eniwetok (1951) 29
Fig. 3.5 Homeward bound after nine months at sea on Operation Capricorn (1953). Two Scripps
research vessels, RV Horizon and Baird, had participated in Ivy Mike, the H-Bomb test at Eniwetok
Atoll. The return voyage was devoted to seismic and heat flow measurements which contributed
vital information to the evolving theory of plate tectonics. Expedition leader Roger Revelle (Back
row, second fr om the left). Walter (Front row, second from the right) is s eated next to Win Horton;
he later married Win’s sister, Judith. (Standing, left to right: Dick Van Herzen, Roger Revelle,
Willard Bascom, Ted Folsom, Alan Jones, Gustaf Arrhenius, Henri Rotschi, Robert Livingston,
Russell Raitt. Seated, left to right: Phil Jackson, Dick Blumberg, Ronald Mason, Bob Dill, Art
Maxwell, Winter Horton, Walter Munk, and Helen Raitt)
By then the mushroom cloud had reached 20 miles. I was 72 n. miles from Eluklab
Island (which by then had evaporated) but the appearance was that I was beneath
a raging inferno. I kept adding 5-minute time marks to the straight line drawn by
the pressure recorder, At 0745 the Horizon came by the rafts to pick up Bascom
and me. The Task Group Commander had ordered her to proceed at flank speed
2
(11.5 knots for the Horizon) on course 045T to avoid radioactive fallout. By noon
we were hove to (as ordered) north of Ground Zero when it started to rain. The
radiation safety officer recorded 30 milliroentgens per hour (the permissible outdoor
rate was 7 mR=hr). We immediately initiated the fallout procedures, clothes were
thrown overboard and the wash-down procedure was put into action. But by then, as
Chief Scientist Roger Revelle put it, the Horizon “had lost her virginity” (Figs. 3.4
and 3.5). For the remaining twenty-six years of Scripps service she was unable to
accommodate experiments involving low-level radiation counting.
At 1400 we received orders from the Task Force Commander to again proceed
at flank speed, but now southward. After two hours the activity had decreased to
2
The nautical term “flank s peed” is its true maximum speed.
30 3 Bikini (1946) and Eniwetok (1951)
Fig. 3.6 Judith and Walter enjoying their wedding luncheon in Edward Evert Horton’s garden in
Encino, California (20 June 1953)
0.3 mR=hr. The cumulative total was well below the allowable personnel exposure
total of 3 R. None of this would have happened if we had stayed with the rest of
the fleet. We have never been able to reconstruct th e reasoning behind the initial
evacuation order.
Next morning we returned to the seamount to recover our gear. I un-spooled the
paper tape back to 0745 the previous day when I had been ordered to abandoned the
raft. Within 90 s following my final time mark, the record showed a large positive
pressure jump (perhaps the pressure gauge had slipped down the mooring wire). On
hindsight the signal was not creditable: too late, too large, too step-like. And there
was no signal at the neighboring raft tended by Bascom. Klaus, you may remember
that on my 65th birthday, I spoke of the occasion. I then thought I would have gone
through with the ABLE ABLE ABLE signal. This would have set in motion the
evacuation of several thousand people. I would h ave been too embarrassed to return
to Scripps, and would have left the ship at the next landfall in Tongatapu.
Hasselmann: Letsnotcontemplatethis an earlydemisetoyourcareer
Munk: My entire life would have been different
Hasselmann: . and what did in fact happen after your left Eniwetok?
Munk: We had made enough money participating in the bomb test to spend the next
half-year doing geophysics on the way home. Russell Raitt did some seismic work
and found a surprisingly thin sedimentary layer, consistent with only 100 million
years of sedimentation. Arthur Maxwell found a normal heat flow through the sea
bottom. This eventually became evidence for Plate Tectonics (we missed the proper
interpretation). We spent a wonderful Christmas in the Tonga Islands. When we
eventually returned to San Diego we had been gone the better part of a year. Horizon
3 Bikini (1946) and Eniwetok (1951) 31
was home, and land creatures were strange and somewhat frightening. We left the
vessel making suitably rude remarks to our shipmates, “Well I am glad I won’t have
to see you for breakfast,” and to the cook “I won’t have to eat your chow any more.”
But that evening half the contingent were back for dinner on the Horizon.
The long time at sea had given me time to reflect and I had decided to terminate
a failing marriage. I too k residence in Reno, Nevada, and filed for divorce from
Martha Chapin Munk. I proposed to Judith Horton (Fig. 3.6). Judith had come down
with polio on her 21st birthday, the day she was to enter the Harvard School of
Design. She spent some months in an iron lung, and then came to stay with her
grandmother Mrs. Oscar Kendall in Pacific Beach. By then she had recovered suf-
ficiently to walk with a cane. But old polio victims don’t get better with age. Ten
years later she required Canadian Walking Sticks. It took twenty-five years for her
to sit down in a wheel chair. She was a perfect partner in all I did for 53 years. Polio
was a challenge, not a handicap.
Chapter 4
Settling Down at Scripps
4.1 Munk Finally Gets His Degree
Hasselmann: I would assume by then you had gotten a degree and been appointed
to a Scripps faculty position?
Munk: Not yet. It was far more exciting going to Bikini than meeting the Univer-
sity’s Ph.D. requirements. One morning Harald Sverdrup said, “If you don’t get your
thesis in I will have to ask you to leave.” I then went into high gear and submitted
a 19 page thesis in one month [6]. For that purpose I combined some work I had
done on two quite different processes that lead to an increase in wave period: selec-
tive attenuation (short waves are d amped more quickly) and dispersion (the interval
between the first and second crest of a tsunami increases with time). Klaus, you
know Jules Charney. He and I had our final examination at UCLA together, he from
2 to 3 pm, I from 3 to 4 pm. We had identical committees, including Sverdrup and
Jack Bjerknes. But there was a big difference, Jules wrote a seminal thesis, mine
was awful. The two processes of wave period increase have nothing to do with
each other and discussing them jointly just leads to confusion [15]. In 1979 when
the Dean of UCLA (where Scripps degrees were awarded in the forties) called to
offer the Distinguished Alumnus Award, I thought for a moment he was going to
cancel my degree. Fortunately the University of California has no mechanism for
withdrawing a degree once granted.
Hasselmann: Oh, I had a Ph.D. student who went through because I missed his
elementary error. In such cases one should sack the advisor, not the student. So I
should have been sacked.
von Storch: Now let us see. . . I think we are more or less through with ocean waves.
What are the next things you looked at?
H. von Storch, K. Hasselmann, Seventy Year s of Exploration in Oceanography 33
DOI 10.1007/978-3-642-12087-9, © Springer 2010
34 4 Settling Down at Scripps
4.2 W ind-Driv en Ocean C irculation
Munk: In 1948 I took a sabbatical in Oslo, Norway. Harald Sverdrup had been gone
from Scripps and I missed him. I had worked next to Harald’s office when he discov-
ered the “Sverdrup relation” ˇM y D curl between the poleward water transport
M
y
and the wind curl, where ˇ D df=dy is the poleward derivative of the coriolis
parameter f . He discovered this relation not by theory, but, as was his custom, by
looking at observations. Traditional geostrophy fails at the equator where f D 0.
Sverdrup delayed the publication for months. How could such a simple result have
been overlooked? He finally published in 1947.
A year later Henry Stommel published his beautiful demonstration that western
boundary currents are associated with ˇ rath er than f . On my sabbatical I d iscov-
ered that Stommel’s equations reduce to the Sverdrup relation away from bound-
aries. This permitted an evaluation of the Gulf Stream transport from an integration
of wind stress across the Atlantic [20]. The results, 36 Sverdrups, were within a fac-
tor of 2 of existing estimates based o n hydrographic data. In the publication I used
the words “ocean gyres” which have stuck ever since.
von Storch: So you did that more or less on the side. How long did you work on this?
Munk: About a year.
von Storch: This was one of the fields that you touched only once.
Munk: A year later I met George Carrier who immediately wrote down a one-line
solution to the Gulf Stream as a boundary solution [22].
Chapter 5
From Waves to Tides 1958–1968
Hasselmann: You previously spoke of several attempts to move away from ocean
waves studies. What was the direction you were trying to take?
Munk: For a decade we made a concerted effort to explore the long period wave
spectrum between swell and tides. Here were 10 octaves of unknown territory, only
occasionally visited by storm tides and earthquake tsunamis, just waiting to be ex-
plored.
We had previously installed an analog wave recorder at the end of Scripps Pier,
which rejected both the “high-frequency” swell and the low-frequency tides [11].
This showed prominent oscillations of 1 to 5 minute periods that were clearly re-
lated to the amplitude modulation of the incoming swell. We called the oscillations
“surf beat.” They are associated with the non-linear interaction of two neighboring
frequencies f
1
and f
2
in generating f
1
f
2
. But a proper analysis had to wait fifteen
years f or “Bispectra of Ocean Waves” by Hasselmann, Munk, and MacDonald [83].
Bispectra had many applications, from surf b eat to the deep-water wave-wave inter-
actions required in Klaus’ wave forecasting.
Hasselmann: Were not bispectra an invention of your spectral mentor John Tukey?
Munk: Yes! I remember John coming by La Jolla one day and pronouncing that I
had to learn about bispectra, “I don’t know for what problem bispectra will do you
some good, but I know it will do you some good.”
Hasselmann: Were there other discoveries of long-period waves?
Munk: Yes, a host of different phenomena, mostly controlled b y topography. The
centerpiece was Frank Snodgrass’ application of the vibratron transducer for mea-
suring pressure fluctuations on the sea bottom. Recording was done on shipboard.
To avoid jerking the transducer (always a problem) there had to be a separate anchor
with lots of slack cable between anchor and transducer.
H. von Storch, K. Hasselmann, Seventy Year s of Exploration in Oceanography 35
DOI 10.1007/978-3-642-12087-9, © Springer 2010
36 5 From Waves to Tides 1958–1968
First let me mention measurements in the inshore environment. Some harbors ex-
hibit pronounced and undesirable oscillations that are excited by long period wave
activity outside the harbor. One would think that the appropriate repair would be
to narrow the harbor entrance. But just the reverse is true; narrowing the entrance
increases the resonant Q and increases resonant amplification. We called this the
“Harbor Paradox” [74].
Another early application was to edge waves, gravitationally trapped waves that
move parallel to the coastline. The amplitude decreases exponentially seaward, with
a center of mass at a distance =2. For a constant bottom slope ˇ the dispersion
law is the same as for surface waves in deep water, C
2
D g
=2 provided we
use the “reduced gravity” g
D g sin ˇ. For a representative slope of 0.01, period
1000 s, the (along-shore) phase velocity is then 16 m=s and the wave length D
16 km. The depth at the center of gravity is 25 m. We set up an array of pressure
recorders parallel to the coast at Oceanside, California where the coast is straight for
30 km [89]. Edge waves of mm amplitude were always present and easily measured.
Measured and theoretical wave velocities were in remarkable agr eement; so much
so that to the casual reader the theoretical dispersion curve looks just like any other
least-square fit to the observations rather than a confirmation of the theory.
von Storch: But, or maybe therefore, no one has paid any attention?
Munk: Quite so, but with one exception. At the time of the experiment I met Com-
mander (Cdr.) Jones (not his real name) at a party and he wanted to know all about
edge waves. Cdr. Jones was in command of a b attle cruiser and became interested in
how to generate an edge wave. I suggested that moving the cruiser parallel to shore
at a distance of 1=2 the longshore wave length (depth of about 12 fathoms) and
the resonant speed of 32 knots should do it. The experiment was carried out next
morning, but without generating an observable edge wave.
von Storch: I would think having a cruiser chase down the coast at flank speed is
not a smart thing to do.
Munk: It is not. Fortunately the careers of Cdr. Jones and Prof. Munk were not
adversely impacted. Let me go to another experiment. With vibratron pressure
recorders at about 30 m depth, we took simultaneous readings at La Jolla and on
the eastern shore of San Clemente Island, 100 km seaward [78]. We found a spectral
continuum, with the two records coherent and in phase for frequencies of less than
0.7 cycles per hour and out of phase for frequencies above 0.7cph. The measure-
ments gave clear evidence of shelf resonances. We pushed towards lower and lower
frequencies. In a tour-de-force Sir Edward Bullard and Munk reported that they had
pushed all the way to the tidal frequencies and patched the continuum across the
tidal band [86], with an underlying intensity of an astoundingly low 0.1 cm
2
=cpd.
It had become quite clear that the vibratron transducer was not up to the job. Frank
Snodgrass had started working with a quartz crystal pressure transducer that was less
5 From Waves to Tides 1958–1968 37
sensitive to temperature changes. More important, he was experimenting with a free-
fall self-contained capsule that could be left on the sea floor for months at a time,
and then recalled by acoustic command. The capsule represented half our annual
budget and Frank could not get himself to toss it overboard without a safety leash.
The leash would get fouled in various configurations. One day the leash became
accidentally undone, and things worked perfectly. Within a few years the free-fall
procedure had become routine.
Chapter 6
Deep Sea Tides 1964–2000
Hasselmann: So the tidal program was the end product of a ten-year effort of mea-
suring offshore waves of increasingly longer period?
Munk: Exactly. But the free-fall capsule was only one of three new components of
the evolving program. It always pays to know the ultimate limits set by instrument
noise and background noise. Having been spoiled by a high signal-to-noise ratio, the
tidal community has ignored the noise background. David Cartwright and I made the
caustic remark [97] that “noise-free processes do not occur except in the literature
oftidalphenomena ,”acommentthatdidnotendearustothetidalcommunity.
When you allow for the interstitial noise continuum it turns out that the weaker tidal
harmonics that are routinely included in the traditional predictions are hopelessly
contaminated; including them makes the prediction worse rather than better. From
these considerations, Cartwright and I proposed the Response Method of Tidal Pre-
diction [97].
Hasselmann: Can we return to this later? You mentioned a third consideration.
Munk: This was the time of the first meaningful solution of THE tide problem,
defined as follows: given the motions of Earth, Moon and Sun, and the dimensions
(bottom and sides) of the o cean basins, compute the global tides. The mathematician
Chaim Pekeris,
1
a U.S. citizen in residence in Israel, had just obtained a meaningful
numerical solution using a rough bathymetry of the g lobal o ceans. Prior to that, Sir
George Darwin (son of Charles) and other 19th century math ematicians had evalu-
ated the tides for ocean basins of constant depth bounded by two lines of longitude,
and other simple geometries.
1
Chaim Pekeris was born in Lithuania and became a naturalized U.S. citizen when he took his
degree at MIT under C G. Rossby. Later he founded the Applied Mathematics Department at the
Weizman Institute where he built the computer GOLEM. The computer is named for a mythical
clay giant that was miraculously brought to life by a saintly rabbi to watch over Jewish citizens in
16th century Prague.
H. von Storch, K. Hasselmann, Seventy Year s of Exploration in Oceanography 39
DOI 10.1007/978-3-642-12087-9, © Springer 2010
40 6 Deep Sea Tides 1964–2000
Judith, Myrl Hendershott, and I had gone to Israel to hear Pekeris speak about his
achievement. Myrl had followed Pekeris calculation with a numerical solution that
allowed for the tidal distortion of the solid Earth and gravitational self attraction
(the so-called Love Numbers k, h), which changed the results by a factor of order 2.
I remember that Pekeris was willing to talk to me about his own work but would not
listen to Myrl (then only a Scripps Post Doc). There is a curious twist to this story.
Pekeris had done his tidal work under an NSF (National Science Foundation) grant
that allowed him to build GOLEM, one of the early electronic computers. When Ju-
dith and I called on Pekeris, we were astounded to see his premises in the Weizman
Institute guarded by soldiers with loaded weapons. It was at about that time that
rumors were current that Israel had developed an atomic bomb. Now the design of
the bomb (as well as the solution of the tide problem) requires extensive comput-
ing facilities. Could Pekeris have helped design the atomic bomb with a computer
provided by NSF under the pretense that he was working on the tide problem? This
needs to be checked. Memory is not history.
Hasselmann: Numerical solutions of the tide problem (as you call it) must be one of
the earliest applications of electronic computers.
Munk: I believe it was. John von Neumann, who is credited with having pioneered
the design of electronic computers, was visiting La Jolla at the time. We spoke
about the application to the tide problem, and he immediately asked, “What do you
do about the coastal boundary condition?” A very perceptive question, which is still
being worked on.
von Storch: Where did you go for support of the tide problem?
Munk: To both ONR and NSF. I remember being initially turned down with the
words that, “The tide problem had gone to bed with 19th century mathematicians.”
I protested that we had planned for a much broader attack: to compare theoretical
deep-sea tides with measured deep-sea tides, using the Response Method for analy-
sis.
Tides along the American west coast can be represented by a rotational edge trav-
eling northward with velocity of order
p
.gh/ 200 m=s and long-shore wave
length
rot
D
p
.gh/=f D order 10,000km and a seaward extent of order
rot
=2.
2
(Recall that gravitationally trapped edge waves h ave of order 10 km and can go
either way.) Working with Jim Irish and Mark Wimbush, we first did some deep-sea
drops off California [119, 126] and located the Northeast Pacific M
2
amphidrome
(zero amplitude) . This was followed by drops be tween Austr a lia and Antar ctica, to
explore the latitudes where the sublunar point travels around the southern oceans at
the speed
p
.gh/ of free waves. A naïve theory predicts resonant amplification at
2
f D 2˝ sin latitude is the coriolis parameter. This horrible notation is due to Carl Gustav
Rossby. He developed the equations for the Rossby waves while visiting Sverdrup in La Jolla. I
was present when he was on the beach writing equations in the sand, and threatened by a rising
tide introduced f as an instant shorthand.
6 Deep Sea Tides 1964–2000 41
Fig. 6.1 Walter (standing in sea-going portable laboratory) discussing deep-sea tide measurements
with Frank Snodgrass (third from the left) aboard the RV E.W. Scripps (circa 1973). Frank pio-
neered the use of sea-going portable laboratories
such latitudes. We didn’t believe the theory but made measurements anyhow. The
result was a rather dull transition from Australian to Antarctic tides.
We organized an international SCOR (Scientific Committee on Oceanic Research)
working group WG27 to explore deep-sea tides with the free-fall drops. Numerous
measuremen ts were made, par ticularly by Cartwright in the U.K. and Hal Mofjeld
of NOAA (National Oceanic and Atmospheric Administration), Miami. Snodgrass
participated in an international calibration experiment in the Bay of Biscay. Even-
tually about 200 pelagic tide stations have been occupied by different investigators,
and these provided a check on the numerical modeling of tides (Fig. 6.1).
Our last drops were made in 1974 south of Bermuda in 5.5 km of water, as p art
of the MODE (Mid-Ocean Dynamic Experiment) experiment [142]. We discov-
ered unexpected pressure fluctuations at subtidal frequencies that are coherent over
1000 km [143]! As far as I know these have not been explained. With regard to
tides, an analysis by Bernard Zetler was in splendid agreement with the traditional
Atlantic cotidal charts [145]. Two independent drops in the same area gave M
2
am-
plitudes of 32.067 and 32.074 cm. When it comes to four-figure accuracies, it is no
longer oceanography. Further, satellite altimetry looked increasingly promising for
future measurements of deep-sea tides. It was time to move on.
von Storch: You previously mentioned the Response Method of Tidal Prediction.
What is that all about?